
Abstract
The aim of the study was a profound insight into the antibiotic resistance development in uropathogenic Escherichia coli strains with the use of some mathematical and statistical methods. During the previous study some antibiotics (amoxicillin, ciprofloxacin, gentamycin, and tobramycin) were applied to induce the resistance of E. coli strains, which led to the generation of ∼120 derivative strains with changed antibiotic susceptibility profiles. In this work, quantitative analysis was performed based on the strains defined as values of vectors of susceptibility for all the antibiotics' use. The Pearson correlation coefficient was used to define the correlation dissimilarity (distance) of the strains, which was further applied to hierarchical clustering. Analogously, the antibiotics were presented as vectors of susceptibility values of all the investigated strains. Correlation and cluster analysis were performed for antibiotics. The hclust method from the R system with the Ward method was used as a class agglomeration method. Mathematical analysis revealed two types of statistically relevant interactions—between antibiotics and derivative strains, as well as between the effect of individual antibiotics on the bacterial strains. These observed correlations can play a potential role for modeling uropathogenic E. coli (UPEC) resistant changes, based on the particular antibiotic used to initiate resistance development, or a model helping to predict drug resistance interactions in various UPEC strains. The obtained results can lead to development of much more sophisticated mathematical models, which, in turn, can be a potentially useful tool as a drug resistance trend predictor, both for clinicians and epidemiologists.
Introduction
The emergence and spread of bacterial drug resistance is one of WHO's priorities. The appearance of bacteria resistant to all available antibacterial agents is a real risk and poses a serious epidemiological threat even in the case of hitherto harmless infections. 1 This problem also includes urinary tract infections (UTIs), where routinely and empirically applied antibiotics contribute to the increase in bacterial antibiotic resistance.2–5 Several recent studies confirm that increasing resistance among common UTI-causing pathogens seriously limits the therapeutic options, especially in outpatient settings.6,7 Nitrofurantoin and fosfomycin belong to the first-choice drugs, which are often empirically applied for uncomplicated infections; in case of more severe cases—fluoroquinolones or/and cephalosporins are used. 8
Although the bacterial resistance to nitrofurantoin and fosfomycin remains low, empirical and ambulatory use of antibiotics may have decreased the effectiveness of therapy. This affects the activation of characteristic metabolic pathways and the induction of defense mechanisms in bacteria. 9 There are many factors that can influence bacterial pathways, including mechanisms of drug resistance.10–12 This is clearly noticeable in the case of the uropathogenic Escherichia coli, which is the major causative agent of UTI. The rapid appearance of drug resistance is observed in this group of pathotype due to excellent adaptability. 12
In the previous study we observed that a sublethal concentration of ciprofloxacin induced the resistance of an E. coli culture within 24 hours, which also led to a series of subsequent changes in the drug resistance of a given bacterial strain. 13 The study of mechanisms regulates this phenomenon, and the relationships between antibiotics and bacterial strains contribute to the development of even more rational and effective methods of antibiotic therapy. Mathematical modeling and the advanced statistical techniques are increasingly used in biological and medical sciences.14–16 They can predict the directions of drug resistance or reveal subtle dependencies between antibiotics and bacterial mechanisms of resistance. The mathematical tools can indicate some important relationships, which can be further investigated in vitro or in vivo. 17
The dependence between antimicrobial activity and bacterial response (resistance) is explored using a correlation coefficient utilizing aggregate data as the measure of association.18,19 The meta-analysis is another approach of systematic survey that adapts statistical tools to analyze different complex research results and arrive at a single quantitative summary (a weighted average). 17 In our previous study we demonstrated how mathematical modeling like the Cohen kappa, the Ward associations, and other correlations methods may indicate interesting relations between the antibiotics and bacterial strains.20,21 In this study, we present a further application of that approach for the observation of deep dependencies of the induced resistance among uropathogenic E. coli strains.
Materials and Methods
Research material
The values of bacterial growth inhibition diameter zone (mm) around the antibiotics were used for the analyses. These values were obtained from the antimicrobial susceptibility testing of 120 E. coli derivative strains generated from five clinical uropathogenic E. coli strains after the treatment with a subinhibitory concentration of different antibiotics (ciprofloxacin, amoxicillin, gentamycin, and tobramycin). 13
The derivatives and wild-type E. coli strains were tested against 16 antibiotics: amoxicillin (AML, 25 μg), amoxicillin/clavulanate (AMC, 20 + 10 μg), piperacillin (PIP, 30 μg), cefoxitin (FOX, 30 μg), cefotaxime (CTX, 5 μg), ceftazidime (CAZ, 10 μg), imipenem (IMI, 10 μg), amikacin (AMK, 30 μg), tobramycin (TN, 10 μg), gentamycin (GN, 10 μg), netilmicin (NET, 10 μg), norfloxacin (NOR, 10 μg), ciprofloxacin (CIP, 5 μg), ofloxacin (OFX, 5 μg), trimethoprim–sulfamethoxazole (STX, 25 μg), and nitrofurantoin (NI, 100 μg). All procedures of E. coli derivative preparation were described in detail by Adamus-Białek et al. 13
Mathematical analysis
The values of bacterial growth inhibition diameter zone (mm) around the antibiotics were used for these analyses. Each strain was characterized based on the profile of real number vectors (corresponding to the diameter zone of bacterial growth inhibition) of antibiotic susceptibilities for all the antibiotics used. Analogously each antibiotic was characterized as a real number vector of the antibiotic susceptibilities for all the investigated strains. The relationships between antibiotic susceptibility values were analyzed statistically, where p < 0.05 meant statistically significant.
Two approaches have been applied—bacterial similarity and antibiotic activity similarity. In the first approach, a quantitative analysis was performed based on the strains defined as values of vectors of susceptibility for all the antibiotics used. A correlation analysis of such strains (vectors) was carried out. Then the Pearson correlation coefficient r was used to define the correlation dissimilarity (distance) d of strains using the formula: d(u, v) = 1 − r(u, v) for each strain (u, v). A hierarchical clustering was performed based on the dissimilarity function d. The resulting clusters were compared and characterized. Hierarchical clustering was performed using the hclust method from the R system with the application of the Ward method as a class agglomeration method. As a result, the dendrogram presented in Fig. 1 was obtained.
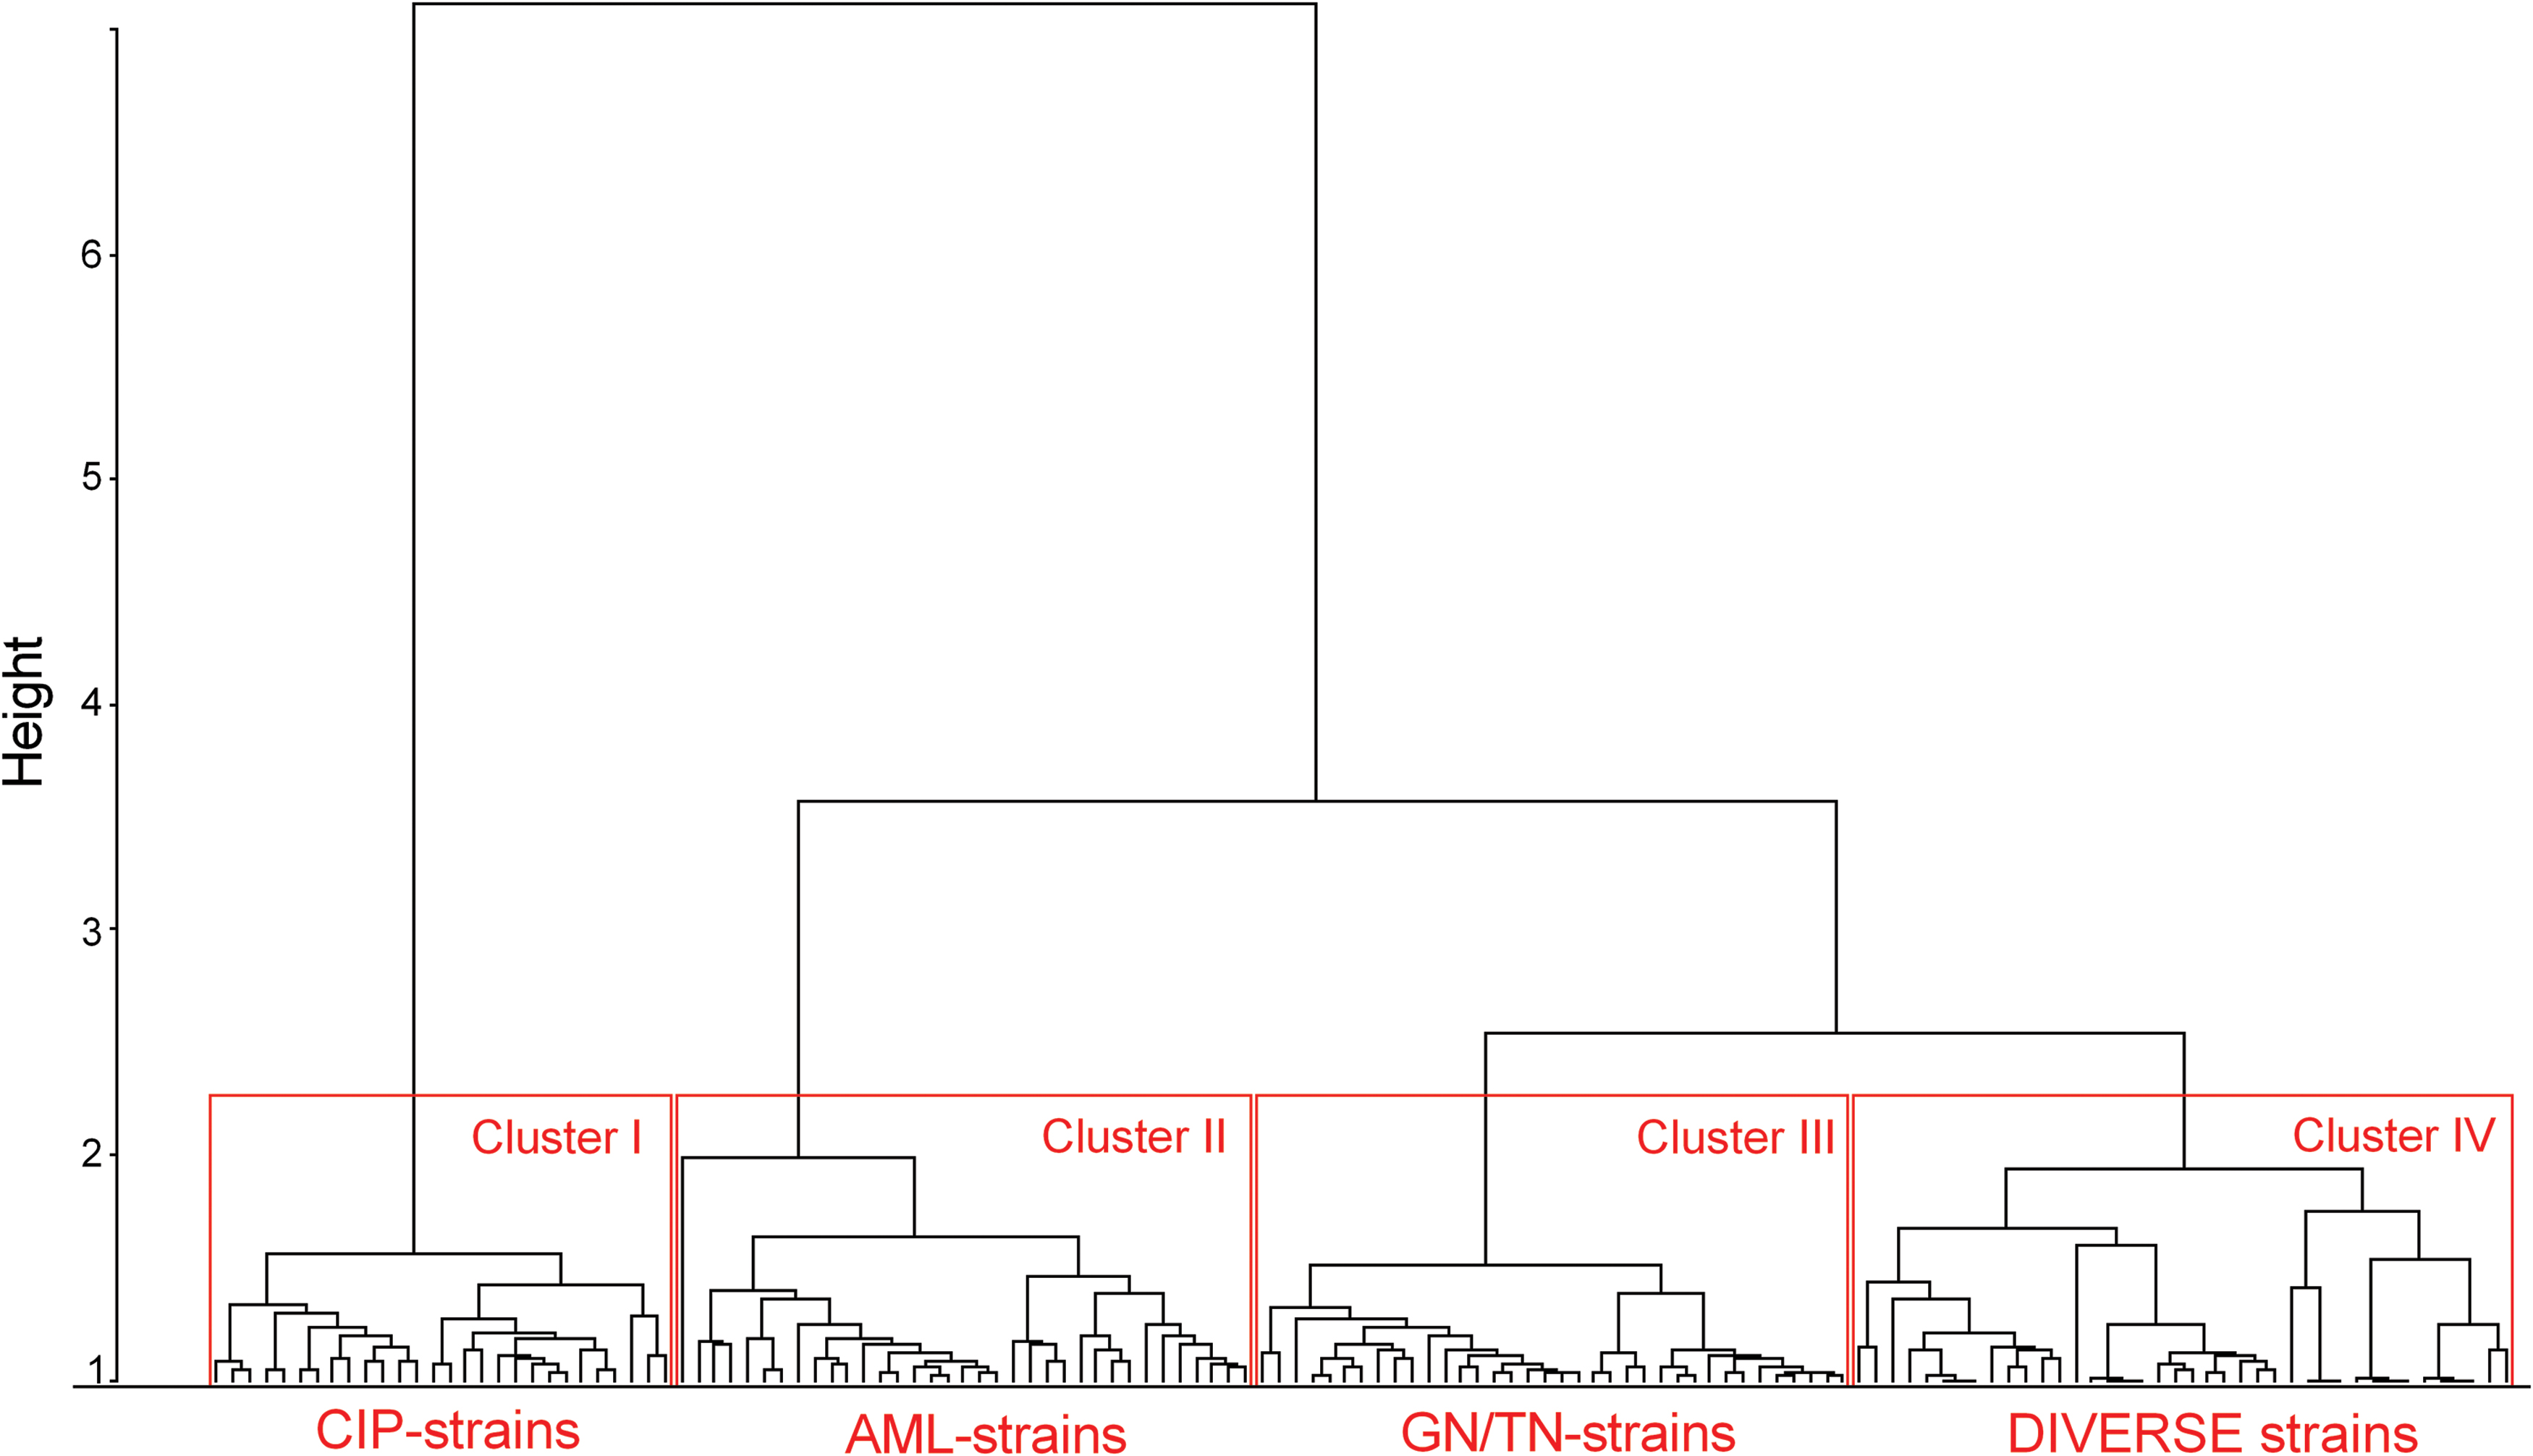
A dendrogram of derivative Escherichia coli strain with induced antibiotic resistance. The strains were clustered based on the similarities/differences of their profiles of inhibited growth diameter zones around the antibiotic discs. There are distinguished four clusters of strains: CIP-strains induced by ciprofloxacin, AML-strains induced by amoxicillin, GN/TN-strains induced by gentamycin or tobramycin, and DIVERSE strains induced by gentamycin, tobramycin, or amoxicillin. Hierarchical clustering was performed using the hclust method from the R system with the application of the Ward method as a class agglomeration method. Color images are available online.
To characterize antibiotic activity, the antibiotics were similarly defined as real number vectors of susceptibility values of all the investigated strains. A correlation analysis between the antibiotics (exactly: their strain susceptibility vectors) was performed. Then the Pearson correlation coefficient r was used to define the correlation dissimilarity (distance) d of the antibiotics. The correlation dissimilarity function d was used to perform hierarchical clustering. The result was presented on the dendrogram in Fig. 2.
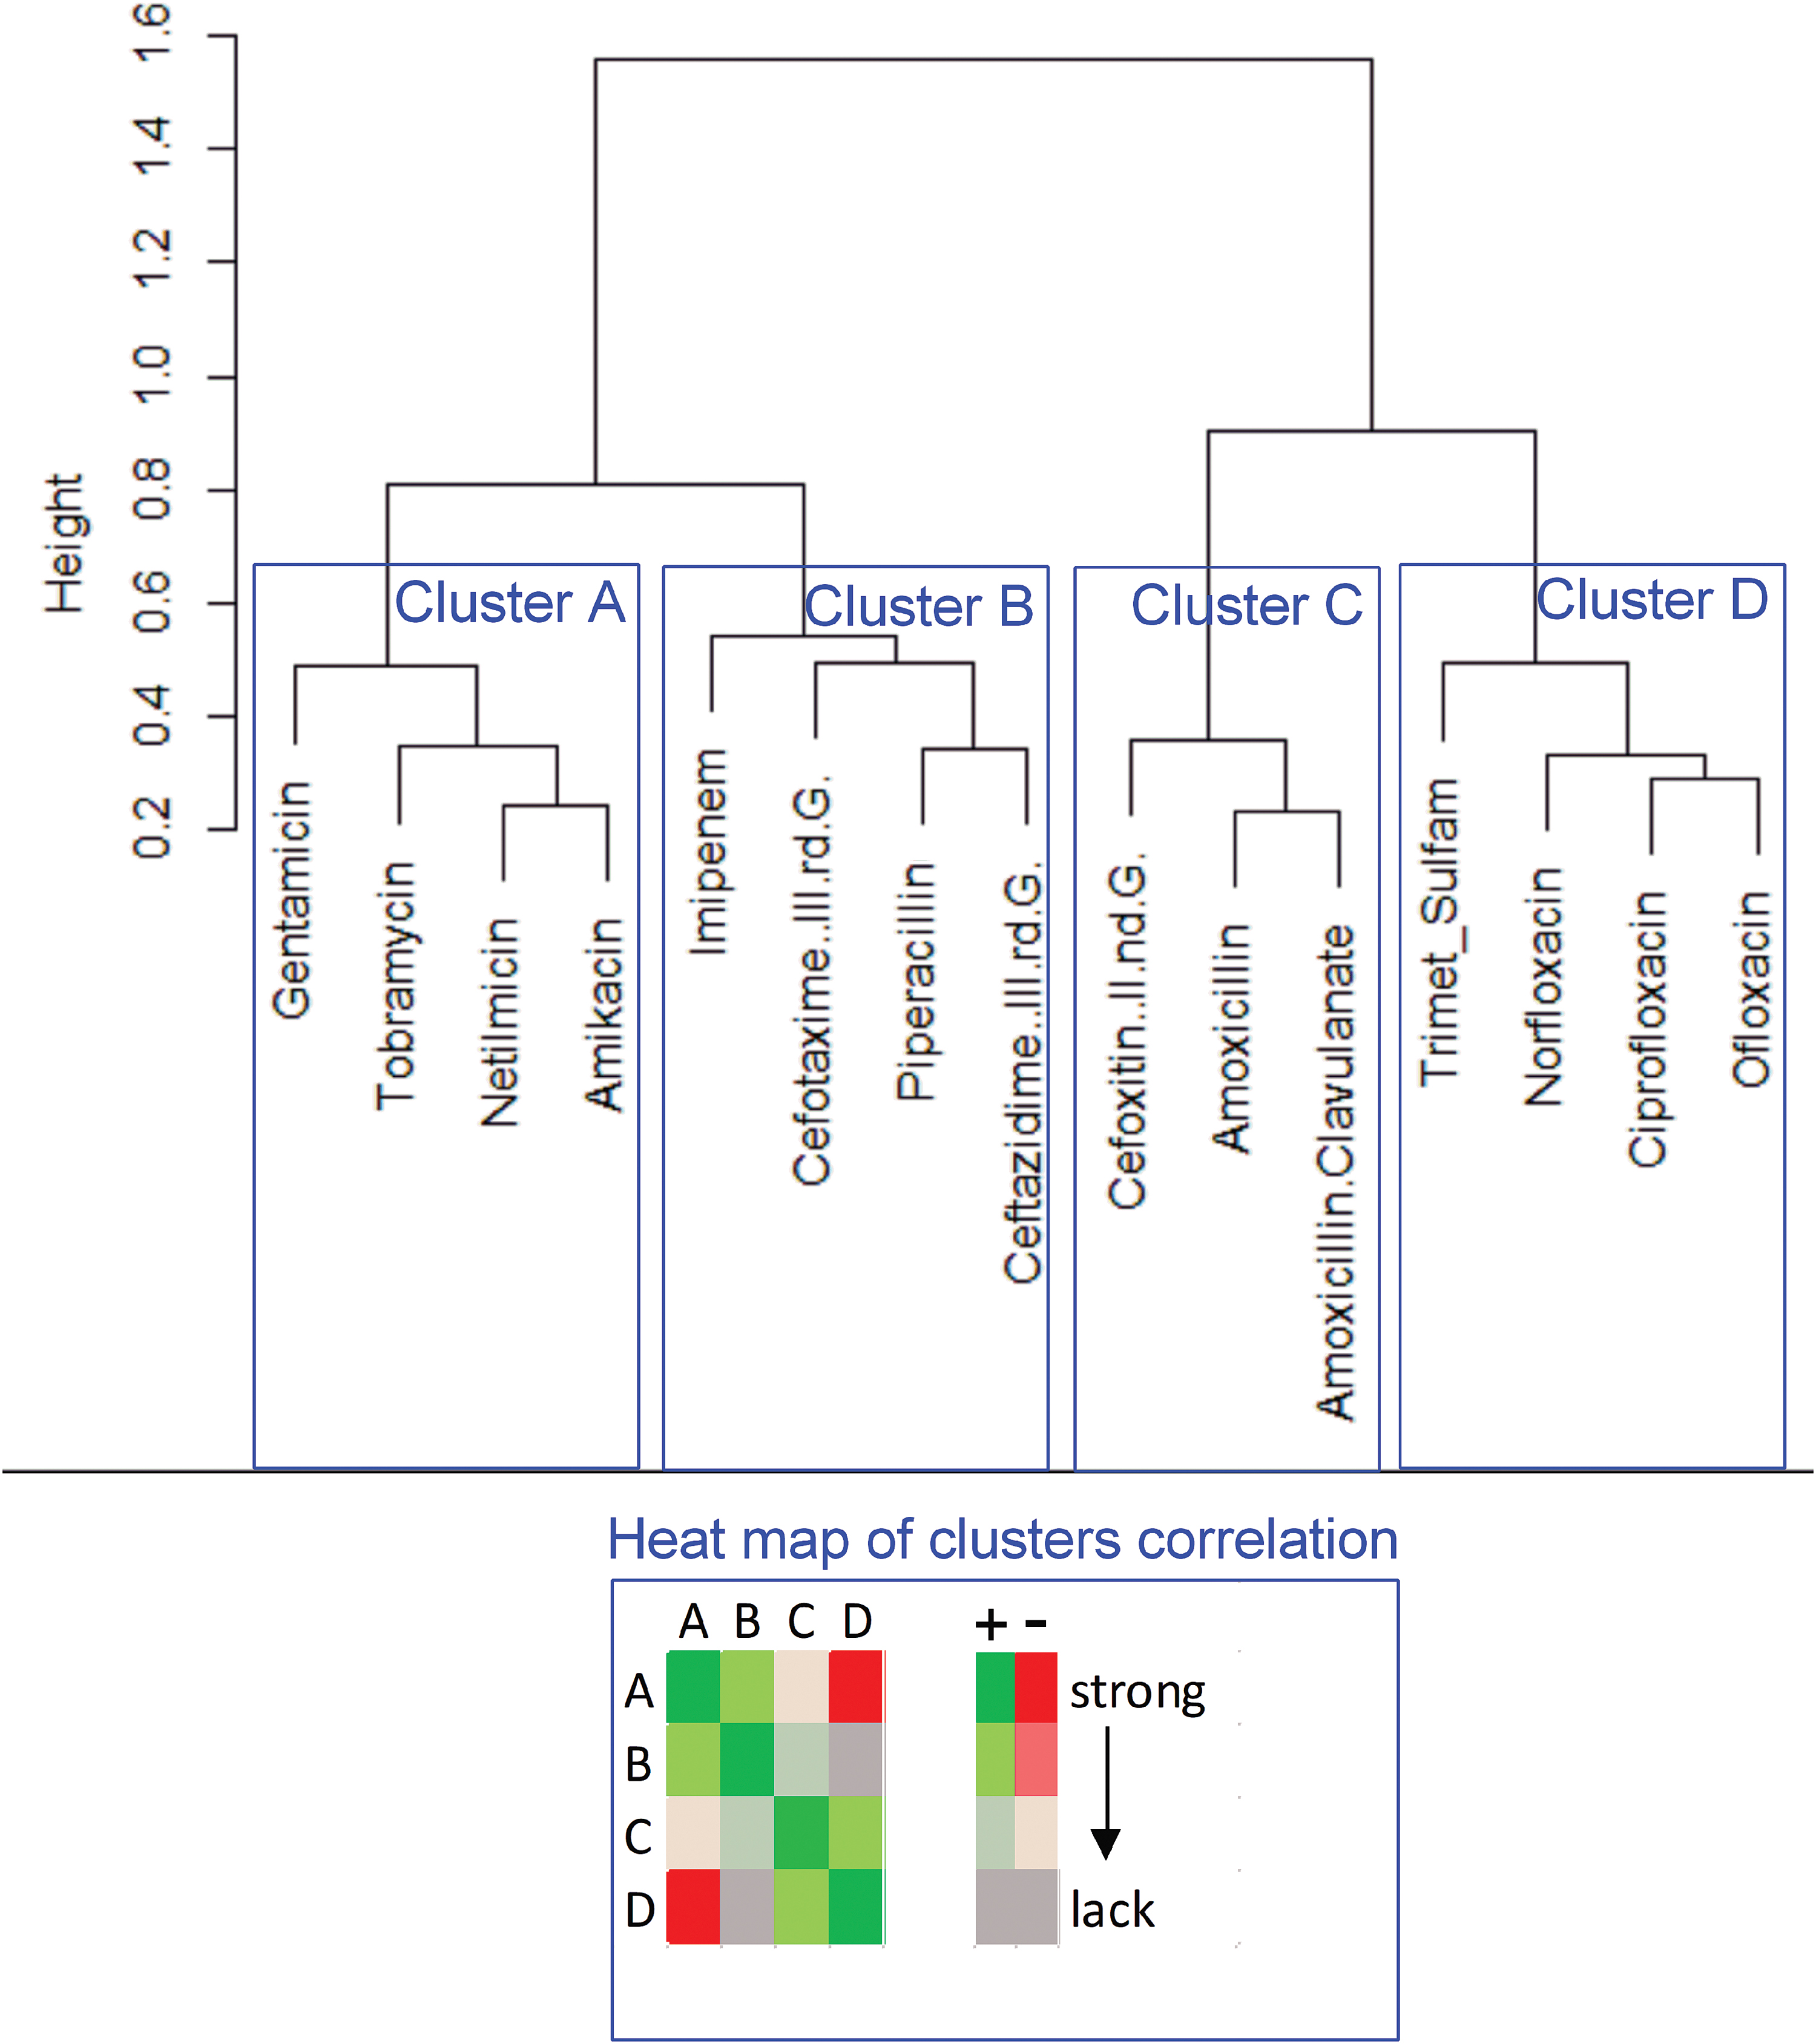
A dendrogram of similarities/differences in antibiotic activity in derivate Escherichia coli strain with induced antibiotic resistance. The antibiotic clusters (A–D) were correlated to each other. The statistically significant correlation (from strong correlation to lack of correlation) was presented on the heat map, + means positive correlation (the synergistic effect of antibiotics), − means negative correlation (antagonistic effect of antibiotics). The Pearson correlation coefficient was used to define the correlation dissimilarity of the antibiotics. The correlation dissimilarity was used to perform hierarchical clustering. Color images are available online.
Results
We present the detailed analysis of drug resistance changes with the use of mathematical tools. The values of diameter zone (mm) of bacterial growth inhibition around the antibiotics were used as vectors for the analyses. The analyses present the correlations between the antibiotic resistance correlation profiles among derivatives and the wild type of E. coli strains generated during the previous study. 13 The observation described below has been divided into two mathematical approaches—drug resistance analyses based on strain similarities and antibiotic similarities. In addition, the antibiotic resistance distribution of derivative strains was compared to their counterpart clinical collection of E. coli strains.
Bacterial strain similarity analyses
The mathematical analyses of induced drug resistance profiles allowed to show the similarities and differences between these profiles among the derivative E. coli strains. The base data used were the growth inhibition diameter zones of a given strain in the presence of the 16 tested antibiotics. The result of this assay is presented on the dendrogram in Fig. 1. The antibiotics applied for resistance induction created the four clear clusters of the strains (cluster 1–28 strains, cluster 2–37 strains, cluster 3–32 strains, and cluster 4–23 strains). It was observed that the strain's affiliation to a given cluster strongly coincides with the antibiotic that was used for the resistance induction.
Cluster 1 includes only CIP-strains (resistance induced by ciprofloxacin), and cluster 2 includes only AML-strains (resistance induced by amoxicillin). In case of cluster 3, there are 20 GN-strains and 12 TN-strains (resistance induced by gentamycin and tobramycin, respectively). Cluster 4 was the most diverse—2 GN-strains, 4 AML-strains, and 17 TN-strains. During the analysis of clusters based on the generated resistance to all antibiotics different inclination to appearance of resistance was observed.
The clusters were characterized based on resistance to particular antibiotics (Table 1). The number of emerged resistances was compared to the total number of all possible resistance events. The high prevalence of resistance was observed in cluster 1 (CIP-strains), but the most diverse resistance was observed in case of cluster 3 (GN-strains, TN-strains) and cluster 4 (diverse derivative strains). Cluster 1 included the strains resistant to nitrofurantoin; cluster 2 included the strains resistant to gentamycin, tobramycin, norfloxacin, and ofloxacin. This cluster contained only AML-strains; however, the resistance to amoxicillin was confirmed only in 15/37 cases. Cluster 3 included strains resistant to almost all of the tested antibiotics, except nitrofurantoin, ciprofloxacin, trimethoprim/sulfamethoxazole, cefotaxime, and imipenem—it was similar to cluster 4 with the exception of ciprofloxacin.
The Cases of Generated Resistance to Each/All Antibiotics in Particular Clusters of the Dendrogram of Derivative Escherichia coli Strain with Induced Antibiotic Resistance
The resistance to amoxicillin with clavulanic acid was observed most often—in 61% of derivative strains. Also common, but twice less frequent, was the resistance to cefoxitin, norfloxacin, and ofloxacin. There was no case of bacterial resistance to trimethoprim/sulfamethoxazole and imipenem.
Similarity of antibiotic impact on bacterial strains
The second type of mathematical analyses presents the similarities/differences of the effect of antibiotics on the generated derivative E. coli strains, which was presented on the dendrogram (Fig. 2). Four clusters were distinguished, in which antibiotics revealed a similar effect on the derivative strains. In general, cluster A includes aminoglycosides, cluster B—cephalosporins of a newer generation, cluster C—cephalosporins of an older generation, and cluster D—mostly fluoroquinolones. Interestingly, the new generation of cephalosporins showed a higher similarity of the effect on the E. coli strains to aminoglycosides than to the older generation of cephalosporins.
The antibiotics within the same cluster have always demonstrated strong and statistically significant positive correlations. It means that the emergence of resistance to a given antibiotic from this cluster reduced the sensitivity to other antibiotics in the same cluster. Between clusters A and D (aminoglycosides vs. fluoroquinolones), significant negative correlations have been demonstrated. It indicates that the resistance to, for example, aminoglycosides is correlated with the increased susceptibility to fluoroquinolones and vice versa. Between clusters A and C (aminoglycosides and cephalosporins of the older generation), significant positive correlations have been demonstrated. Similarly for clusters B and C (both types of cephalosporins), the existence of weak but statistically significant positive correlations has been demonstrated.
The distribution of correlations between individually compared antibiotics is presented in Fig. 3. According to the provided data, the strongest positive correlations exist between individual antibiotics of a given cluster. Apart from the above, the strongest positive correlations exist between gentamycin and all antibiotics from cluster B (piperacillin, imipenem, ceftazidime, and cefotaxime), as well as between ceftazidime and all antibiotics from cluster A (gentamycin, tobramycin, netilmicin, and amikacin). The same observation is correct for antibiotics from clusters C and D; this is particularly evident in case of cefoxitin and all antibiotics from cluster D (ciprofloxacin, norfloxacin, ofloxacin, and trimethoprim/sulfamethoxazole).
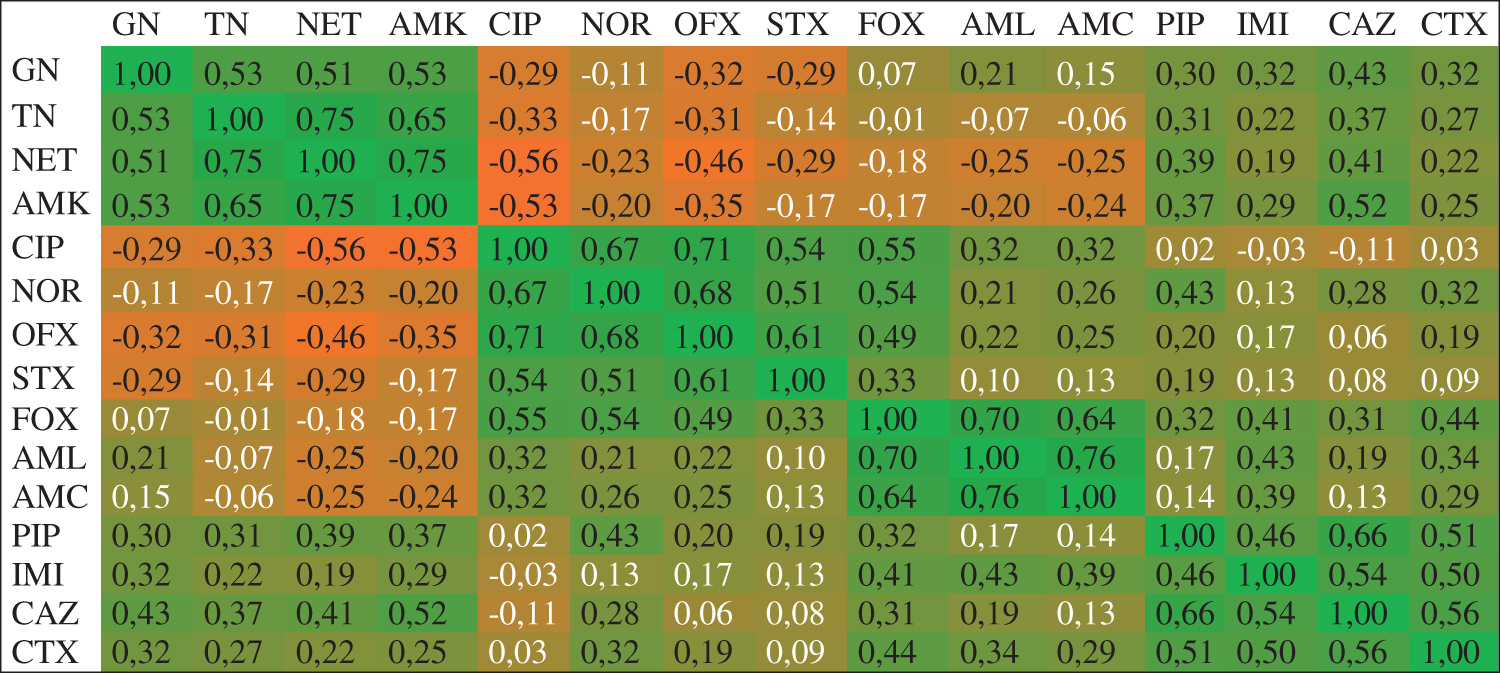
The statistically significant correlation between the individual antibiotics effect on the derivative Escherichia coli strains. The strength of correlation from positive (1) to negative (−1) is shown on the heat map (green–orange). A positive correlation means a synergistic effect of the antibiotics; a negative correlation means an antagonistic effect of the antibiotics. White font color denotes the lack of statistical significance. The analyzed antibiotics were gentamycin (GN), tobramycin (TN), netilmicin (NET), amikacin (AMK), ciprofloxacin (CIP), norfloxacin (NOR), ofloxacin (OFX), trimethoprim–sulfamethoxazole (STX), cefoxitin (FOX), amoxicillin (AML), amoxicillin/clavulanate (AMC), piperacillin (PIP), imipenem (IMI), ceftazidime (CAZ), and cefotaxime (CTX). The Pearson correlation coefficient was used to define the correlation dissimilarity of the antibiotics. The correlation dissimilarity was used to perform hierarchical clustering. Color images are available online.
The strongest negative correlations are seen in case of antibiotics from clusters A and D; the most evident cases are ofloxacin and ciprofloxacin versus all antibiotics of cluster A (gentamycin, tobramycin, netilmicin, and amikacin). A slightly lower negative correlation exists between amoxicillin and amoxicillin/clavulanate (cluster C) and the antibiotics from cluster A.
Changes in the bacterial behavior in reaction to antibiotics between the clinical collection of E. coli and their derivative strains
The antibiotic susceptibility distribution zones of the collection of derivative strains were compared to the clinical collection of previously studied E. coli strains. The analyses were conducted analogously to the previously published data. 20 In brief, the derivative strains have been assigned to one of the susceptibility-related groups. These groups have been identified as sensitive, coming intermediate, intermediate, coming resistant, resistant, and diverse. These groups were described based on the distribution of growth inhibition diameter zones. The most significant impact considering the classification to the particular groups was from the most numerous strains representing the value of the diameter zone. The results are presented in Table 2.
The Comparison of Bacterial Behavior Groups in Reaction to Particular Antibiotics Between the Clustered Derivatives (Fig. 1) and the Wild Types of Escherichia coli Strains According to Previously Published Data
Source: Adamus-Białek et al., 2017. 20
The analyzed antibiotics were amoxicillin (AML), amoxicillin/clavulanate (AMC), piperacillin (PIP), cefoxitin (FOX), cefotaxime (CTX), ceftazidime (CAZ), imipenem (IMI), amikacin (AMK), gentamycin (GN), netilmicin (NET), norfloxacin (NOR), ciprofloxacin (CIP), ofloxacin (OFX), and trimethoprim–sulfamethoxazole (STX).
The observed bacterial behavior was dependent on the antibiotic used for derivate selection. It is important to indicate that the wild type strains of E. coli, which were used for the selection of derivatives, were sensitive to all antibiotics, but the analyses described below refer to the typical status of bacterial behavior in reaction to antibiotics of the whole clinical collection of previously studied E. coli strains. Bacteria belonging to cluster 1 (selection by sub-minimum inhibitory concentration [MIC] of ciprofloxacin) showed a tendency to changes in resistance to almost all antibiotics. There was a change in the sensitivity from intermediate to coming intermediate in case of netilmicin, gentamycin, and amikacin. The bacterial behavior ranging from diverse to complete resistance concerned ciprofloxacin, norfloxacin, and ofloxacin.
The bacterial sensitivity to amoxicillin has changed from diverse to sensitive behavior. The bacterial behavior to amoxicillin/clavulanate has changed to total resistance, and the resistance to cefoxitin remained unchanged. Sensitivity to imipenem and ceftazidime changed from intermediate to sensitive, whereas sensitivity to piperacillin increased from diverse to coming intermediate. Bacteria belonging to cluster 2 (selection by sub-MIC of amoxicillin) revealed increased resistance to amoxicillin (from diverse resistance to complete resistance) and amikacin (coming intermediate to intermediate) in comparison to clinical strains. Inversely, increased sensitivity was observed in the case of ceftazidime and imipenem. In the case of cefoxitin, gentamycin, tobramycin, and netilmicin, intermediate resistance was changed to diverse resistance; the resistance to piperacillin did not change.
The sensitivity behavior of wild type strains in terms of sensitivity to ciprofloxacin, ofloxacin, and norfloxacin has changed from diverse to coming intermediate. Bacteria belonging to cluster 3 (selection by sub-MIC of gentamycin) increased resistance to amikacin and netilmicin (behavior of intermediate resistance to total resistance). Increased sensitivity was observed in case of imipenem, cefoxitin, and amoxicillin (respectively, from coming intermediate, intermediate, and diverse to sensitive behavior). The behavior in reaction to gentamycin has changed from intermediate to diverse resistance. The bacterial behavior of coming intermediate to diverse was observed in the case of ceftazidime. The sensitivity to piperacillin and cefotaxime did not change (diverse and sensitive levels, respectively).
In case of bacterial behavior in reaction to fluoroquinolones—ofloxacin remained in the diverse resistance group, whereas the behavior in reaction to ciprofloxacin and norfloxacin shifted to the sensitive group. Bacteria belonging to cluster 4 (selection by sub-MIC of tobramycin) showed a decrease in susceptibility to tobramycin and netilmicin (from intermediate to resistant) and cefotaxime (from sensitive to intermediate group). There was also a change in sensitivity to amikacin from coming intermediate to coming resistant. Increased sensitivity was observed for cefoxitin, amoxicillin, norfloxacin, and ciprofloxacin (shift to sensitive group behavior), and in the case of ofloxacin, the bacteria changed the behavior group from diverse to coming intermediate.
Discussion
UTIs caused by uropathogenic E. coli (UPEC) strains are one of the most common diseases worldwide, both in hospital environment and in the communities. It is estimated that about 150 million patients are afflicted with such infections every year, which is associated with high costs of hospitalization and other expenses related to treatment. 12 UPEC strains are pathogenic due to the presence of numerous virulence factors, both structural (fimbriae, pili) and secreted into the patient's body (toxins, extracellular systems of obtaining iron acquisition). Due to the plasticity of their genome, UPEC strains also easily acquire antibiotic resistance-related genes. Acquiring drug resistance is also facilitated by the frequent use of empiric antibiotic usage in UTIs, without first determining the antibiogram of the E. coli strain being responsible for infection. 22
Literature data suggest an unexpectedly high percentage of drug resistant strains among UPEC—11.8% of strains are resistant to third generation cephalosporins and 22.3% are resistant to fluoroquinolones. 12 This confirms the observations made during the clinical trials concerning the decreasing number of antibiotics available in the UPEC infections and the increasing drug resistance. 23 To further complicate the matter, the process of development of novel antibiotics seems to be stalled nowadays. The possibility of discovery of completely new drugs is unlikely. The option that still remains at hand is to further modify existing drugs to broaden their antibacterial spectrum, increase their activity against biofilms, or increase their activity in very low concentrations. Thus the emergence of novel, revolutionary treatment options is still unlikely. 24
Taking into account the above information, the obtained results seem to have particular importance. During both presented mathematical approaches, there were statistically significant interactions between UPEC strains and the antibiotics used. The correlation was found between the first-line antibiotic and the general direction of drug resistance evolution in the UPEC strain treated with it. The developed “scaffold” of the mathematical model allows for extrapolation (to some extent) of how the drug resistance will shape during the treatment of an UPEC infection depending on the first-line antibiotic used.
We would like to emphasize that the carried out analyses are preliminary, although with encouraging results. Analogous analysis should be repeated using more tested strains and a wider range of antibiotics. Only then could one ponder the creation of a full-fledged mathematical model. Nevertheless, the described results and the manner of their analysis are innovative, when we try to place them against the literature data on this subject. The applied research approach is a kind of novelty and has not been widely used before. Although the other authors of the available publications conducted mathematical analyses related to bacterial drug resistance studies, they had a distinctly different character.
The most widespread type of mathematical models describing the drug resistance phenomenon are those that allow the depiction of the spread of drug-resistant strains under different conditions, for example, in patient populations but also in the environment and some of its constituent parts (e.g., in wastewater). 25 Some researchers developed the models describing the spread of mobile genetic elements related to drug resistance or individual gene coding for drug-resistance related proteins. 25
Knight et al. 26 used a different approach to the problem of modeling. They developed a model showing the trends of spreading bacterial strains resistant to third generation of cephalosporins in the human host, taking into account such factors as the patient's place of contact with drug resistant microorganisms (hospital environment or community), frequent visits to health care facilities, and the general degree of antibiotic use in particular populations. Daşbaşı et al. 27 developed a model for the development of drug resistance in patients subjected to multiple antibiotics, taking into account the immunological status of each patient, which seems to be a novelty against the models proposed by other authors.
The most similar approach to the research approach proposed by the authors of this publication was used by Spalding et al. 28 They modeled the changes in the morphology of Pseudomonas aeruginosa cells treated with meropenem. In vitro studies of culturing of meropenem-treated cells were carried out, the analyzed parameter being the growth rate of the bacterial population, the dynamics of which was expressed as a function of the availability of nutrients and not as a simple reflection of growth in the logarithmic phase.
The obtained results form a kind of basis for creating a fully-fledged, “mature” mathematical model, based on the results of more extensive research, which could find many practical applications. First of all, this model could be used as a supplement or, to some extent, a replacement of the classical methods of determining bacterial resistance where UPEC strains represent a good example for this drug resistance analysis. The routine antibiotic susceptibility testing is still not automated (especially in many Polish laboratories), and it is time consuming and labor intensive. Certainly the resulting model would serve as an aid for clinicians, who would be able to administer empiric antibiotic therapy more effectively and, at the same time, have an image of the potential consequences of therapy from the point of view of drug resistance of the infecting strain.
We suggest that one of the analyses performed in this study, that is, the estimation of positive and negative correlations between resistances to various antibiotics, should be considered as a particularly useful tool. Mathematical modeling can also serve clinicians, allowing them to analyze and modify treatment protocols to avoid the development of drug resistance. 29 The developed model could also be used as an aid for clinical epidemiologists. The developed drug resistance algorithm may be used at the introductory stages of all kinds of epidemiological considerations.
In other words, mathematical modeling can help in predicting any future trends in drug resistance development and spread in various communities. 30 It can also be used to estimate the risk of epidemiological spread of drug-resistant strains in the hospital environment and beyond. In addition, it can become helpful in the process of assessment of control strategies, used for containment of the spread of drug resistant strains. 31 The analysis of selection of various drug resistance profiles (based on the antibiotic used for the therapy) happens to be the most useful for this purpose.
Antibiotics cause the appearance of characteristic profiles of drug resistance in UPEC strains
The obtained results allow to draw conclusions of two kinds. Mathematical analyses of the effect of subinhibitory concentrations of selected antibiotics (amoxicillin, ciprofloxacin, tobramycin, and gentamycin) on clinical strains showed clearly that each of the antibiotics used generates a different cross-resistance profile for many other antibiotics. The effect of each antibiotic is to create a specific cluster of resistant strains, which are characterized by far-reaching similarities within the profile of drug resistance. The mathematical tools used for detailed analyses confirmed our previously published data. 13 In case of our mathematical analysis, the scope of our study is more sophisticated and broader, taking into account possible interactions (both positive and negative) between various antibiotic classes.
In the case of the second cluster (induction by a subinhibitory concentration of amoxicillin), the emergence of mainly resistance to β-lactam antibiotics, above all of older generations, is not surprising. There is also a slight increase in the resistance level among certain fluoroquinolones. This phenomenon can be explained by the appearance of the gene encoding the acrAB membrane pump, conditioning the active transport of antibiotics outside the cell, the appearance of which is strongly correlated with mutations in the parC and gyrA genes—these changes are responsible for the emergence of resistance to fluoroquinolones. 32 When it comes to the group of strains induced by ciprofloxacin, the emergence of bacterial cross-resistance to β-lactams of the older generation is not uncommon (particularly amoxicillin). It should be emphasized that for this group of strains, the percentage of cross-resistant strains is even higher than for strains from cluster 1.
The selection of strains belonging to clusters 3 and 4 (induced by subinhibitory concentrations of gentamycin and tobramycin) proceeded in a similar way, because in addition to the induction of strains resistant to aminoglycosides, it also appeared in a significant percentage of strains increasing their resistance to many β-lactam antibiotics. This phenomenon can be explained in such a way that cross-resistance to said antibiotics is the result of changes in cell-membrane permeability—as in the cases of Serratia marcescens described by Goldstein et al. 33 In contrast, a decrease in resistance to fluoroquinolones was observed in both of these groups, which can be connected with mutually exclusive mechanisms of resistance to aminoglycosides and fluoroquinolones.34,35
The tested antibiotics are characterized by clustering in groups with positive and negative influence on sensitivity to other antibiotics
The second mathematical analysis showed that the tested antibiotics also demonstrate clustering, understood as an effect on resistance similar to antibiotics belonging to other clusters. In general, statistically significant correlations between groups can be divided into two types—positive correlations (a given group of antibiotics increases resistance to drugs from another cluster) and negative (a given group of antibiotics reduces resistance to drugs from another cluster).
It is obvious that antibiotics within the same cluster have always demonstrated the existence of a strong positive correlation among themselves. Weak, but statistically significant, positive correlations were demonstrated between drugs from clusters B and C (old and new generation of β-lactams). In contrast, strong positive correlations were noted between aminoglycosides and cephalosporins of the second generation; this can be explained by the changes in cell permeability, which was first reported by Goldstein et al. 33 The interesting observation concerns a strong negative correlation between fluoroquinolones and aminoglycosides. This fact may explain the antagonism between the mechanisms of resistance to the above antibiotics. It results from a downregulation of the acrAB membrane pump system in the case of aminoglycoside resistance and an increase in the expression of this system in the case of resistance to fluoroquinolones.34,35
To sum up, the biological aspects of the observed relationships between antibiotics and bacterial strains were described in our previous publication. 13 In this study, we present additional evidence that mathematical tools can be useful for clinicians. In our opinion, standardized software for processing of raw values obtained from antibiograms for strain clustering could be a good automatic tool for epidemiological analyses, especially in hospitals. In addition, the same raw data can be used for the prediction of the potential direction of drug resistance emergence in a particular bacterial population and it can indicate which antibiotics may be or should not be used while making a quick therapeutic decision.
Ethical Approval
For this type of study, formal consent is not required. This article does not contain any studies with human participants or animals performed by any of the authors.
Footnotes
Disclosure Statement
No competing financial interests exist.
Funding Information
This work was supported under the program of the Minister of Science and Higher Education under the name “Regional Initiative of Excellence in 2019-2022 project number: 024/RID/2018/19, financing amount: 11.999.000,00 PLN.”