
Abstract
In the treatment of septic patients, the prediction of a pathogen's susceptibility to piperacillin
The results of automated dilution showed a categorical agreement of 93.3% and presented five minor errors, four major errors, and one very major error. The results for gradient strip and disk diffusion were similar, except for the three additional major errors in the gradient strip and two additional very major errors in disk diffusion. Most of the major errors and very major errors were associated with P. aeruginosa. In conclusion, there was no relevant difference in accuracy between the three compared tests. Their overall categorical agreement ranged from 90.7% to 93.3% and was therefore at the lower end of the threshold. The possibly increased error rate for P. aeruginosa could be relevant in the preparation of empirical antibiotic guidelines and the treatment of septic patients.
Universal Trial Number: U1111-1224-0035.
Introduction
An effective antibiotic treatment is a key component to decrease mortality in septic patients. 1 Therefore, determining the pathogens' susceptibility to a chosen antibiotic is critical. In the empirical treatment of bloodstream infection, piperacillin in combination with the β-lactamase inhibitor tazobactam is commonly used due to its broad-spectrum, high efficacy, and good safety profile. 2 Three common gram-negative pathogens in septic patients are Escherichia coli, Klebsiella pneumoniae, and Pseudomonas aeruginosa. 3 These pathogens can be resistant to piperacillin–tazobactam, and therefore, antimicrobial susceptibility test systems to measure the minimal inhibitory concentration (MIC) of piperacillin–tazobactam are needed. Commercially available test systems regularly require the growth of the pathogen in blood culture and the subsequent isolation of it.
Most common test systems include disk diffusion, gradient strip, automated dilution, and broth microdilution. These differ substantially from each other in their overall design. Furthermore, they also differentiated in terms of cost, workload, processing time, and many other factors. 4 Furthermore, there is conflicting evidence in the literature regarding the accuracy of these test systems.5,6 However, the correctness of the susceptibility testing result for piperacillin–tazobactam can be crucial in septic patients. In particular, incorrect susceptibility test results can lead to delayed or less effective antibiotic treatment. Therefore, this study compared the accuracy of disk diffusion, gradient strip, and automated dilution with broth microdilution for piperacillin–tazobactam in blood culture isolates of E. coli, K. pneumoniae, and P. aeruginosa.
Materials and Methods
Piperacillin–tazobactam susceptibility testing was performed on 150 blood culture isolates from hospitalized patients at the University Hospital Bonn between 2016 and 2018. The most recent E. coli (n = 50), K. pneumoniae (n = 50), and P. aeruginosa (n = 50) isolates were chosen. Before their use, the isolates were stored at −78°C and subcultured twice on Columbia 5% sheep blood agar (Becton Dickinson) before testing. Incubations of the isolates were performed at 37°C for at least 24 hours. The species of the isolates were verified with matrix-assisted laser desorption ionization mass spectrometry using VITEK MS (bioMérieux). No approval required according to the ethic committee of the University of Bonn.
Susceptibility of all isolates to piperacillin–tazobactam was determined by disk diffusion, gradient strip, automated dilution, and broth microdilution. Susceptibility tests were used strictly according to the manufacturer's description. From each isolate, a bacterial suspension in 0.9% saline solution was prepared. The suspension was adjusted so that the absorbance at 580 nm corresponds to a McFarland value between 0.48 and 0.52 using a DensiCHEK plus photometer (bioMérieux). All tests were performed simultaneously and from the same suspension. For the disk diffusion, antimicrobial susceptibility disks (Bio-Rad) with a concentration of 30/6 μg were used. Tests were carried out on Mueller-Hinton agar plates (Becton Dickinson) and were visually read.
For the gradient strip, MIC Test Strips (Liofilchem) were used. They had a concentration range of 0.016/4 to 256/4 mg/L and were carried out on Mueller-Hinton agar plates (Becton Dickinson). MIC was visually read from the gradient strip and was rounded up to the next standard upper twofold serial dilution value. For the automated dilution, VITEK 2 (bioMérieux) was used. Antimicrobial testing cards (AST-248) with a piperacillin–tazobactam MIC range of ≤4/4 to ≥128/4 μg/mL were taken. For the broth microdilution, MICRONAUT MIC-Strips (Merlin) were used. They contain 11 dilutions of piperacillin–tazobactam at a concentration range of 0.125/4 to 128/4 μg/mL. Tests were performed with Mueller-Hinton broth (Merlin) and were visually read.
This study was conducted in two phases. During the first phase, the protocol was validated on 20 isolates from the American Type Culture Collection, which were not included in the analysis. During the second phase, the clinical isolates were measured. The primary measurements of the isolates were taken during 2 sessions, each containing 75 isolates. During a third session, measurements were repeated, which had not yielded any result during the primary measurement. All measurements were directly monitored by a medical doctor. Each sample was visually and independently read by three trained observers.
MICs were interpreted according to the clinical breakpoints of the European Committee on Antimicrobial Susceptibility Testing (EUCAST) version 8.1 (2018). To ensure comparability between the test systems, the MICs were rounded from less than 4 to 4 and from more than 128 to 128.
For the purpose of categorization of the results between two methods, the definition of the U.S. Food and Drug Administration (FDA) was adopted as follows: essential agreement, when the MIC of the test system under evaluation and the MIC of broth microdilution did not differ by more than one double-fold dilution; categorical agreement, when the test system under evaluation and the broth microdilution classified an isolate in the same susceptibility category; major error, for cases in which the test system under evaluation classified an isolate as resistant and the broth microdilution classified an isolate as susceptible; and very major error, for cases in which the test system under evaluation classified an isolate as susceptible and the broth microdilution classified an isolate as resistant. Other differences in the categorical interpretation of the susceptibility were classified as minor errors. 7
All isolates were included in the analysis. Data analysis was performed in R version 3.5.2. The chosen sample size of 150 is able to detect a decrease of 10% or greater of a test system from the expected 95% categorical agreement with a power of 80% and on a significance level of 0.05 without adjustment for multiple testing. Complementary, to allow comparison, MICs were interpreted according to the Performance Standards for Antimicrobial Susceptibility Testing M100 edition 28 (2018) of the Clinical and Laboratory Standards Institute (CLSI).
Results
The measurements of the 150 isolates with the four test systems were executed as planned. Because of repeated insufficient growth, four isolates had to be exchanged. Of the 600 primary measurements, 22 (3.4%) did not yield a result in at least one of the test systems and were, therefore, repeated. The results of the study, in total and subclassified for all three species, are summarized in Table 1. The interpreted MICs are presented. The essential and categorical agreements are shown. Minor errors, major errors, and very major errors are used to describe clinically relevant discrepancies. The distribution of the MICs for both gradient strip and automated dilution compared with broth microdilution is presented in the form of scatterplots for each species in Figs. 1–3.

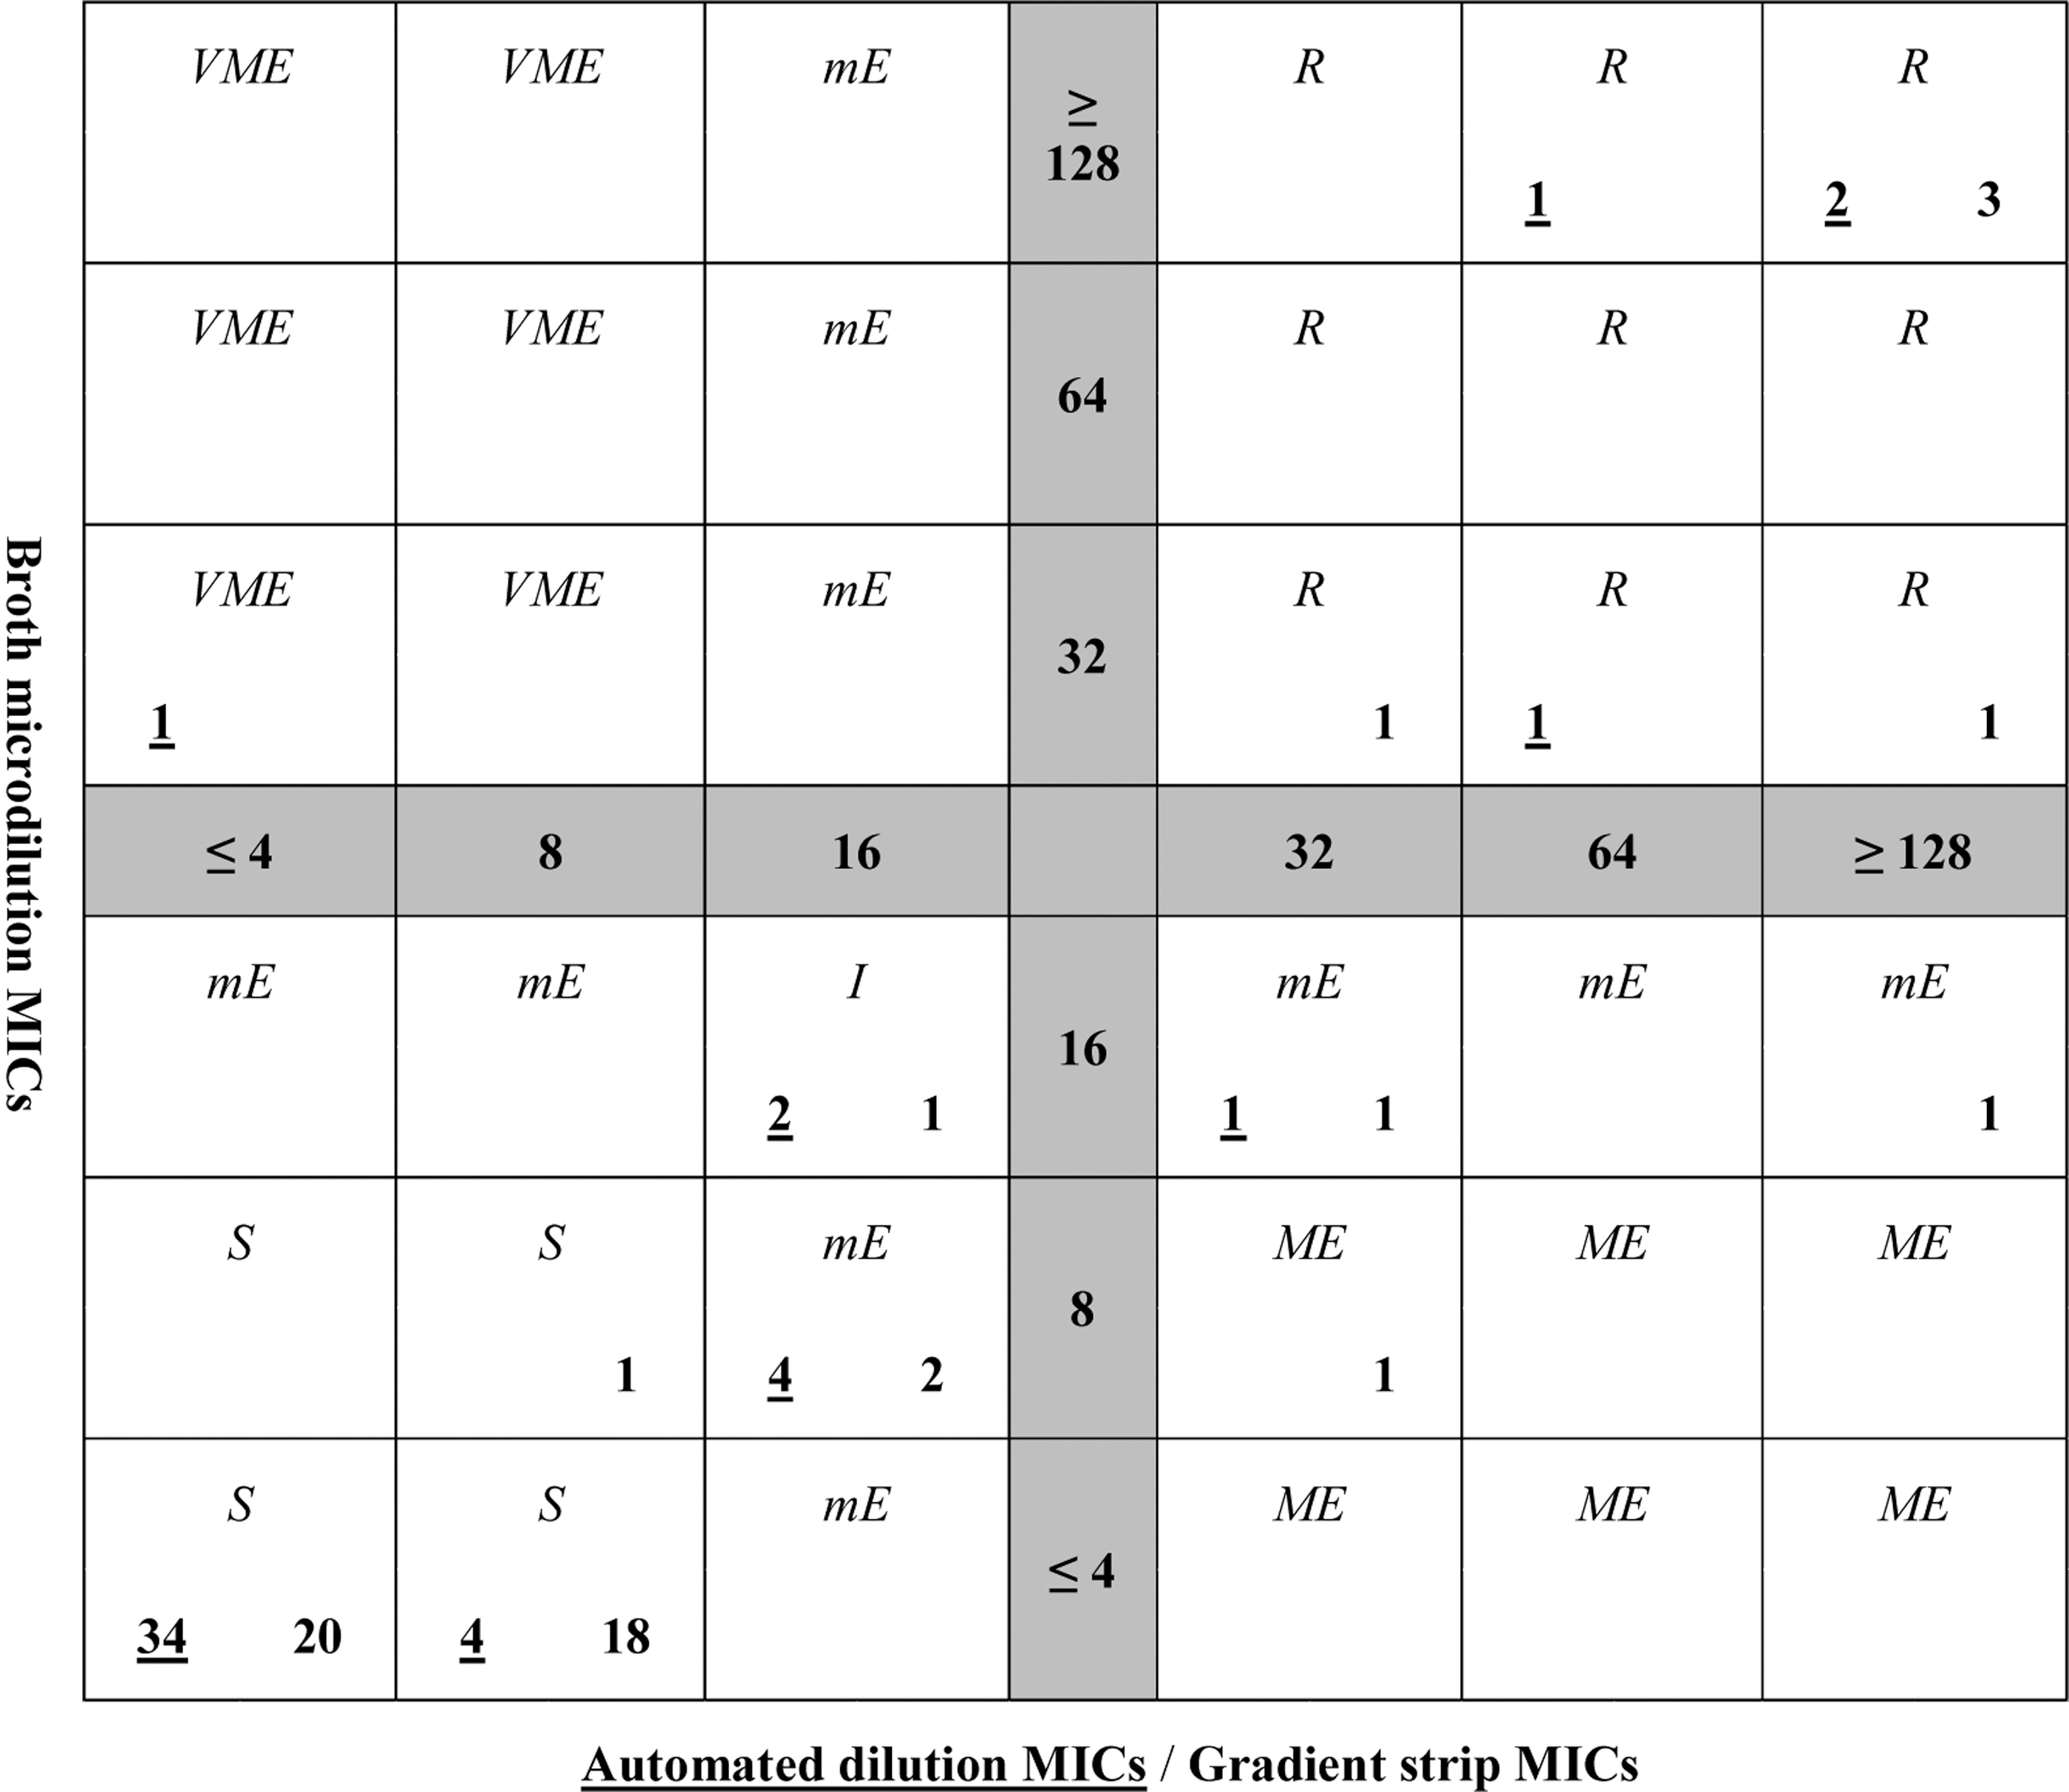
Scatterplot showing results for Escherichia coli. The central cross of the scatterplot shows the coordinate system. Horizontally, the six possible MICs of the reference system (broth microdilution), and vertically, the six possible MICs of the systems under evaluation (automated dilution, gradient strip) are displayed. Each quadratic field represents one of thirty-six possible MIC combinations between the reference system and the two systems under evaluation. The lower part of each quadratic field shows the total number of measurement results for the two systems under evaluation with the specific MIC value combination (left underlined number: automated dilution; right number: gradient strip). The upper part of each quadratic field contains the corresponding interpretation according to the susceptibility classification or error classification (S, I, R, mE, ME, VME). The background color of each quadratic field represents the presence or absence of essential agreement-specific MIC value combination (white: essential agreement; gray hatched: no essential agreement). I, intermediate; ME, major error; mE, minor error; MIC, minimal inhibitory concentration; R, resistant; S, susceptible; VME, very major error.
Scatterplot showing results for Klebsiella pneumoniae. The central cross of the scatterplot shows the coordinate system. Horizontally, the six possible MICs of the reference system (broth microdilution), and vertically, the six possible MICs of the systems under evaluation (automated dilution, gradient strip) are displayed. Each quadratic field represents one of thirty-six possible MIC combinations between the reference system and the two systems under evaluation. The lower part of each quadratic field shows the total number of measurement results for the two systems under evaluation with the specific MIC value combination (left underlined number: automated dilution; right number: gradient strip). The upper part of each quadratic field contains the corresponding interpretation according to the susceptibility classification or error classification (S, I, R, mE, ME, VME). The background color of each quadratic field represents the presence or absence of essential agreement-specific MIC value combination (white: essential agreement; gray hatched: no essential agreement).

Scatterplot showing results for Pseudomonas aeruginosa. The central cross of the scatterplot shows the coordinate system. Horizontally, the six possible MICs of the reference system (broth microdilution), and vertically, the six possible MICs of the systems under evaluation (automated dilution, gradient strip) are displayed. Each quadratic field represents one of thirty-six possible MIC combinations between the reference system and the two systems under evaluation. The lower part of each quadratic field shows the total number of measurement results for the two systems under evaluation with the specific MIC value combination (left underlined number: automated dilution; right number: gradient strip). The upper part of each quadratic field contains the corresponding interpretation according to the susceptibility classification or error classification (S, I, R, mE, ME, VME). The background color of each quadratic field represents the presence or absence of essential agreement-specific MIC value combination (white: essential agreement; gray hatched: no essential agreement).
Summary Table Showing Results Interpreted According to European Committee on Antimicrobial Susceptibility Testing Version 8.1., 2018
Values in %, absolute numbers in ().
CA, categorical agreement; EA, essential agreement; I, intermediate; ME, major error; mE, minor error; R, resistant; S, susceptible; VME, very major error.
Of all isolates, 84% were susceptible in the broth microdilution. Divided by species, 94% of E. coli, 85% K. pneumoniae, and 74% P. aeruginosa were susceptible. Fourteen percent of all isolates were resistant. Divided by species, 6% E. coli, 10% K. pneumoniae, and 26% P. aeruginosa were resistant. An extended-spectrum β-lactamase was detected in four E. coli strains and six K. pneumoniae strains. A carbapenem resistance against imipenem was found in 8, and against imipenem and meropenem in 16 P. aeruginosa strains.
With disk diffusion, 91% of all isolates showed a categorical agreement. There was one major error for E. coli, one very major error for K. pneumoniae, and three major errors and two very major errors for P. aeruginosa. Together for all species, the major error rate was 0.027 (95% CI 0.007–0.068) and the very major error rate was 0.020 (95% CI 0.004–0.058).
Gradient strip had an essential agreement of 94% for E. coli and K. pneumoniae and of 86% for P. aeruginosa. The categorical agreement was 90.7% and was consistent for all species. There were two major errors for E. coli, one major error for K. pneumoniae, and four major errors and one very major error for P. aeruginosa. Together for all species, the major error rate was 0.047 (95% CI 0.019–0.097) and the very major error rate was 0.007 (95% CI 0.000–0.037).
Automated dilution had an essential agreement of 100% for E. coli, 98% for K. pneumoniae, and 92% for P. aeruginosa. The categorical agreement was equal to the essential agreement for E. coli and P. aeruginosa, but was 10.0% points lower for K. pneumoniae. There were four major errors for P. aeruginosa and one very major error for K. pneumoniae. Together for all species, the major error rate was 0.027 (95% CI 0.007–0.068) and the very major error rate was 0.007 (95% CI 0.000–0.037).
Essential agreement for P. aeruginosa in the gradient strip was 86%. Except for that, the essential agreement for automated dilution and gradient strip was for all isolates and for each species over 90%. In direct comparison, automated dilution showed a 5.4% point higher essential agreement than gradient strip. Categorical agreement for all test systems was close to 90%. The difference between the three test systems for all isolates was ∼2%. A deviation from this was the 100% categorical agreement for E. coli in automated dilution. Minor errors were present in similar numbers among the three test systems. Regarding the species, minor errors were found more frequently in K. pneumoniae than in E. coli. There were no minor errors in P. aeruginosa due to the absence of the intermediate interpretation category. Major errors were present in equal numbers for disk diffusion and automated dilution and more frequently in gradient strip. Very major errors were present in equal numbers for gradient strip and automated dilution, but more frequently in disk diffusion. In this study, major errors were more frequent in P. aeruginosa isolates in all three test systems.
The MICs interpreted according to CLSI are presented in Table 2. The comparison with the interpretation according to EUCAST shows in all three test systems, except for major errors, a consistent difference. The categorical agreement was decreased by 2% to 5% points, and consequently, the number of minor errors has approximately doubled. In contrast, very major errors were reduced. Major errors were increased in disk diffusion, similar in gradient strip, and decreased in automated dilution. A sensitivity analysis shows that all of these differences are mainly due to the different interpretations for P. aeruginosa.
Summary Table Showing Results Interpreted According to Clinical and Laboratory Standards Institute 28th Edition January 2018
Values in %, absolute numbers in ().
Discussion
This study investigated the accuracy of disk diffusion, gradient strip, and automated dilution compared with broth microdilution for piperacillin–tazobactam in 150 blood culture isolates. Automated dilution had a categorical agreement of 93.3% and presented five minor errors, four major errors, and one very major error. Gradient strip showed similar results except for three additional major errors. Disk diffusion also showed similar results as automated dilution, except for two additional very major errors. Regarding the categorical agreement, the three test systems performed similarly. The overall categorical agreement reached the desired commonly accepted 90%.
A higher accuracy would be favorable. 7 Under the optimized measurement conditions in this study, the difference between the tests were several times smaller than the difference of each individual test to 100%. In routine diagnostics, the categorical agreement might be lower, and therefore, the difference to 100% even greater. In each test system, error discrepancy rates exceeded the accepted values of 1.5% and 3% for very major and major errors, respectively. 8 Nevertheless, the absolute numbers are too small, and therefore, the uncertainty is too high to draw a definitive conclusion from this observation. Most of the major and very major errors were associated with P. aeruginosa. The number of major and very major errors for E. coli and K. pneumoniae was low for the automated dilution, low for the gradient strip, and acceptable for the disk diffusion.
The number of major errors observed in this study implies that at least one out of five P. aeruginosa isolates categorized as resistant by one of the investigated test systems was susceptible in the broth microdilution reference method. This result could have the following consequences. First, the frequency of piperacillin–tazobactam-resistant P. aeruginosa could be overestimated in the resistance statistics. This could bias the empiric antibiotic guidelines and lead to a more frequent recommendation of other antibiotics. Second, the major errors may lead to a different choice of antibiotics in definitive therapy. Sometimes, this alternative antibiotic treatment has disadvantages and was therefore avoided in the first place. The observed very major errors can lead to a delay of an effective antibiotic treatment, which could have a critical impact on patient survival.
There are several possible explanations for the more frequent major errors in P. aeruginosa. First, a higher number of isolates close to the cutoff value can lead to more frequent errors due to the statistical distribution of measurements. However, in this study, there were only a few isolates close to the cutoff value and they were equally distributed among the three species. Second, the nonexistent intermediate interpretation category in P. aeruginosa could lead to a shift from minor to major errors or very major errors. However, this shift could not be substantiated by the data. A case-to-case analysis indicated that the increased rate of major errors could also be partly explained by failures of the reference method. Finally, the absolute number of major errors is small and therefore a clear verdict is not possible.
The interpretation of the MICs according to CLSI supports the importance of P. aeruginosa for the accuracy. Foremost, this is shown by the doubling of the number of minor errors, P. aeruginosa compared with E. coli or K. pneumoniae, using the CLSI breakpoints. Furthermore, the difference in the accuracy using EUCAST or CLSI breakpoints also resulted mainly due to the difference for P. aeruginosa. Whether the possibly lower accuracy is specific for the species P. aeruginosa or results from the higher proportion of resistant isolates cannot be resolved.
EUCAST breakpoint version 8.1 (2010), used in this study, and version 10.0 (2020) differ from each other. In version 8.1, P. aeruginosa isolates with an MIC ≤16 are classified as S (susceptible) and those with an MIC >16 as R (resistant). In version 10.0, P. aeruginosa isolates with an MIC ≤0.001 are classified as S (susceptible), between >0.001 and ≤16 as I (susceptible, increased exposure), and >16 as R (resistant). The upper threshold value for classification S (susceptible) in version 10.0 is lower than the smallest measurable MIC value of the used test systems and was therefore not observed. Otherwise, the threshold values for classification I (susceptible, increased exposure) in version 10.0 correspond to the threshold values for classification S (susceptible) in version 8.1. Therefore, the results of this study for P. aeruginosa are transferable between version 10.0 and version 8.1. The explicit dosage information and the changed class name, S (susceptible) to I (susceptible, increased exposure), do not influence the results. Similarly applies to the disk diffusion breakpoints. Except for the version 10.0 newly introduced ATU range between 18 and 19 mm, the threshold values are corresponding. In this study, only one isolate is between 18 and 19 mm. In conclusion, the findings for P. aeruginosa of this study are not influenced by the selection of the EUCAST breakpoint version 8.1 or 10.0.
The results of this study are comparable with previous studies. Several studies on the accuracy of VITEK 2 for P. aeruginosa have been conducted in the last decade. Bobenchik et al. (n = 9) found 5% mE (minor error), 0% ME (major error), and 0% VME (very major error). 9 Sapino et al. (n = 100) found 0% mE, 0% ME, and 9% VME. 10 Gagliotti et al. (n = 420, AST N022) found 0% mE, 1% ME, and 16% VME. 11 Gagliotti et al. (n = 420, AST N026) found 0% mE, 6% ME, and 3% VME. 11 Mazzariol et al. (n = 78) found 0% mE, 6% ME, and 10% VME. 12 Sader et al. (n = 100) found 0% mE, 0 ME, and 20% VME. 13 In contrast to this study, most of the older studies show a lower major error rate and a high very major error rate. However, these studies are not directly comparable because of differences in the implementation. Furthermore, none of them uses EUCAST breakpoints. García-Fernández et al. (n = 119) measured the accuracy of ETEST, a test similar to the used MIC Test Strip. The study found for E. coli 5% mE, 1% ME, and 0% VME, for K. pneumoniae 7% mE, 0% ME, and 0% VME, and for P. aeruginosa 0% mE, 3% ME, and 2% VME. 14 These results correspond to our results except for 3% less major errors for E. coli and 2% less major errors for K. pneumoniae, and 5% less major errors for P. aeruginosa.
This study has several limitations. In this work, the rate of resistant and intermediate isolates is low. Therefore, the assessment of the accuracy toward resistant isolates is limited. Nevertheless, the continuous selection of clinical isolates allowed a representation of the resistance pattern found in a university hospital with international medical service and makes the results applicable to daily practice. This single-center study was conducted under optimized conditions to exclude application errors to the maximum extent. The additional effort required for such optimization cannot be provided in the regular laboratory workflow. The isolates could not be retested due to budgetary constraints. Furthermore, only one test system of each type was used. All systems and products were clinically certified. However, deviations between different manufacturers and batches are likely.
This study used the established standard method of broth microdilution for reference. Therefore, a commercially available test system was utilized that was not fully ISO 20776-1:2006 compatible. However, the test system used should be highly accurate due to its similarity to the official reference method. Furthermore, in contrast to an in-house system, it is externally quality tested due to its clinical certification. Nevertheless, it could be subject to the same general restrictions regarding measurement accuracy as all other test systems. It is possible that systemic deviations favor certain test systems. The interpretation of the MIC based on EUCAST or the CLSI recommendations appears to influence the results. Nevertheless, the chosen EUCAST breakpoints are well established and used in many European laboratories. Finally, the investigated accuracy is only a surrogate outcome and not a clinically relevant endpoint.
Conclusion
Based on the EUCAST breakpoints, the three compared test systems showed no relevant difference in accuracy. Their overall categorical agreement ranged from 90.7% to 93.3% and was therefore at the lower end of the threshold. Most of the major errors and very major errors were associated with P. aeruginosa. The possibly increased error rate for P. aeruginosa could be relevant in the preparation of empirical antibiotic guidelines and the treatment of septic patients.
Trial Registration
This prospective study has been registered under the identifier U1111-1224-0035.
Footnotes
Acknowledgment
We sincerely thank Dr. Molitor for the inspiration to this study.
Disclosure Statement
No competing financial interests exist.
Funding Information
This study was financed by internal funding. Nonfinancial support was granted by Liofilchem with 200 MIC Test Strips, by bioMérieux with 200 antimicrobial testing cards, type 248, and by Merlin with 200 MICRONAUT MIC-Strips. Manufactures had no influence on the design, execution, or publication.