
Abstract
Antimicrobial resistance (AMR) developed by Salmonella within animals used for food products is a major global issue. Monitoring AMR in animals destined for slaughter is, therefore, critical. Abattoirs may serve as potential candidate checkpoints for monitoring resistance patterns on farms. A complicating factor, however, is the impact of lairage on Salmonella detected in pigs at slaughter. This study sought to compare AMR patterns in Salmonella spp. in swine collected upon arrival (fecal samples) at the abattoir with those at postslaughter (cecal samples) and evaluate the feasibility of using slaughterhouse samples for surveillance of prevailing AMR Salmonella on farms. Eighty-four Salmonella isolates were recovered from a large, midwestern U.S. abattoir between September and November 2013. Isolates were tested for phenotypic AMR to 12 antimicrobials using the broth microdilution assay. Whole-genome sequencing identified the AMR genes harbored by the strains. Significant differences were observed in the isolate phenotypes and genotypes; however, no significant difference was observed in genotypic resistance patterns. Hence, the AMR profiles of Salmonella spp. postslaughter cannot be predicted from preslaughter samples. Further research considering the genetic diversity of isolates and statistical power of the genotypic analysis is warranted to improve the performance of WGS-inferred antimicrobial susceptibility.
Introduction
S
Accordingly, the National Antimicrobial Resistance Monitoring System (NARMS) was established in the United States, to assess the impact of antibiotic usage in food animal production on human health.12,13 As one of the major foodborne zoonotic pathogens in the United States, Salmonella has been closely monitored by NARMS.14–16 To create a complete view of resistance trends throughout the food production chain, catchment areas for surveillance have been expanded and sampling schemes adjusted with changing needs. Numerous studies have documented the efficiency of sample collection at abattoirs, a natural concentration point of livestock production.17,18 Several pilot studies have attempted to investigate the relationship between Salmonella prevalence on farms and slaughterhouses. Some researchers suggest that it is feasible to monitor the status of Salmonella on farms based on samples collected at abattoirs,19,20 whereas others claim that the prevalence of Salmonella on farms is a poor predictor of that observed at slaughterhouses.21–23
This inconsistency may be caused by various factors. First, transport and lairage provide potential exposure to other sources of Salmonella spp. before slaughter, which can alter the colonization patterns of Salmonella in the gut.24–27 Second, mixing of animals at lairage before slaughter may contribute to different profiles from the farm-generated ones. Another source of variance may be related to the sensitivity and differences in the diagnostic techniques applied for isolation of Salmonella. Previous research has primarily been based on traditional bacteriology and immunological methods, and conventional PCR analysis,28,29 which may introduce a bias owing to selectable markers and hence, do not reflect the true state at the farm. 30 A more powerful and accurate technique is whole-genome sequencing (WGS), which has been implemented as a routine method for Salmonella surveillance by NARMS and Public Health England.31,32 The advantage of WGS technology for predicting drug resistance has proven to be a realistic alternative to the traditional antimicrobial susceptibility testing approaches.33,34
Therefore, to verify if samples collected postslaughter could be used for on-farm surveillance, we narrowed our focus to the abattoir environment and hypothesized that the antimicrobial resistance (AMR) patterns observed in pigs upon arrival at the abattoir reflect those observed on the carcasses of the same cohort after slaughter. The rationale for this presumption is that if patterns observed on carcasses postslaughter were consistent with those observed at arrival, then there is no need to make further investigations on the farm as to sources or types of resistance, negating the need for travel to multiple farms when a single point of concentration (i.e., the abattoir) could suffice. Herein, WGS was introduced to compare Salmonella spp. AMR profiles from swine upon arrival and postslaughter at the abattoir, to determine the feasibility of using postslaughter samples as proxies for on-farm samples in monitoring antibiotic resistance.
Materials and Methods
Sample collection
The sampling sites were located in a large midwestern U.S. abattoir. A total of 358 pigs from 14 truck lots over eight dates were sampled from September to November 2013. Once the lairage pens were loaded with pigs, 10 fecal swabs were immediately collected from freshly voided fecal pats in separate lairage pens, designated as arrival samples. When the lairage rest was complete (minimum 2 h), the pigs were moved to slaughter and cecal samples from the same cohort of pigs were collected on the processing line. All the procedures involving animal handling were approved by the Institutional Animal Care Use Committee (IACUC) at the Iowa State University.
All samples were stored on ice for transport to the diagnostic laboratory and processed within 48 h. Salmonella culture, isolation, and identification were all implemented following the standard methods used by the Veterinary Diagnostic Laboratory at Iowa State University (Ames, IA). Samples were pre-enriched in buffered peptone water at 37°C for 24 h, then Rappaport Vassiliadis and Tetrathionate-Hajna broths were used to isolate Salmonella. For Salmonella purification, a secondary enrichment procedure using two selective media (Brilliant Green Agar, BG; and Xylose-Lysine Tergitol 4, XLT4) were applied. A total of 307 samples tested positive for Salmonella, including 139 arrival samples, 80 environment samples, and 140 postslaughter samples. Forty-two fecal isolates and 42 cecal isolates (Supplementary Table S1) from corresponding cohorts were randomly selected to represent a variety of sources for subsequent analysis. All Salmonella isolates were serotyped using molecular analysis following the protocol described by Leader et al. 35
Antimicrobial susceptibility testing
Antimicrobial susceptibility testing was performed for 12 common antimicrobials of seven classes used in the NARMS panel: gentamicin (GEN), streptomycin (STR), amoxicillin (AMX), ampicillin (AMP), cefoxitin (FOX), ceftiofur (CEF), ceftriaxone (CRO), tetracycline (TET), sulfisoxazole (SXZ), trimethoprim (TMP), chloramphenicol (CHL), and azithromycin (AZM). Minimum inhibitory concentrations (MICs) were determined by broth microdilution using the TREK Sensititre system and NARMS (CMV2AGNF, CMV3AGNF) panels. Resistance was defined using Clinical and Laboratory Standards Institute (CLSI-VET01-A4) criteria, save for STR, for which no clinical breakpoint was available and the NARMS breakpoints were used.
Whole-genome sequencing
Genomic DNA was extracted using the ChargeSwitch gDNA mini bacteria kit (Life Technologies, Carlsbad, CA) as per the manufacturer's instructions. DNA quality was measured with the Qubit fluorometer dsDNA HS kit (Life Technologies). Sample libraries were prepared using the Nextera XT kit (Illumina) and sequenced on Illumina MiSeq platform with the MiSeq reagent kit V2 (500 cycles) to produce 250 bp paired-end reads. After removing sequencing adapters and low-quality bases with Trimmomatic v 0.36, 36 draft genomes were assembled de novo with SPAdes v 3.8.1. 37 The assembly quality was evaluated with QUAST v 5.0.2 and MultiQC v 1.8 using an in-house bash script.38,39 The sequencing depths were calculated based on the Lander-Waterman formula. 40 All sequence reads were deposited in the Sequence Read Archive of the National Center for Biotechnology Information, under the BioProject accession number PRJNA540386.
In silico resistance gene detection
SRST2 v 0.2.0 was used to identify AMR genes from all strains to avoid the influence of assembling quality on the outputs. 41 The up-to-date database of ARG-ANNOT was used as a reference and all parameters were set as default. 42
Statistical analysis
Matrices were created using phenotypic and genotypic AMR data. AMR patterns of Salmonella spp. from swine upon arrival and postslaughter were compared using the chi-square test and Fisher's exact two-tailed test (for rare variants with limited sample size) in R version 3.5.1. 43 The agreement of AMR and AMR determinants were evaluated with Cohen's kappa coefficient. 44 If the upper confidence limit was >1, 1 was reported as the upper limit. 45
Results
Sample design and sample size
Ideally, the same pigs would have been sampled throughout the slaughter process; however, since this was not possible in practice, 10 pigs were collected matched on group in the abattoir, with the assumption that 10 randomly selected pigs would be representative of the group. The final sample size was determined by a pragmatic balance between the project budget and the statistical power, comprising 84 isolates from 84 unique pigs.
Prevalence and serotype distribution
Ten serotypes were identified in this study and confirmed using Seqsero with draft genome assemblies. 46 Salmonella Derby (39.29%, n = 33), Salmonella I 4,[5],12:i:- (25%, n = 21), Salmonella Infantis (10.71%, n = 9), and Salmonella Agona (9.52%, n = 8) were the most common serotypes detected, and accounted for more than 80% of the strains examined. The distribution of serotypes was similar for samples collected pre- or postslaughter (Fig. 1). In the fecal samples (preslaughter), the predominant serotypes detected included Salmonella Derby (n = 17), Salmonella I 4,[5],12:i:- (n = 12), Salmonella Infantis (n = 5), and Salmonella Agona (n = 4). Of the cecal isolates (postslaughter), the top 4 serotypes were the same as those of fecal isolates. Additional serotypes detected included Salmonella Heidelberg, Salmonella Johannesburg, Salmonella Liverpool, Salmonella Muenster, Salmonella Rissen, and Salmonella Typhimurium. Among these, Salmonella Johannesburg and Salmonella Liverpool were only found in cecal samples (postslaughter), whereas Salmonella Muenster was only isolated from fecal (preslaughter) samples.
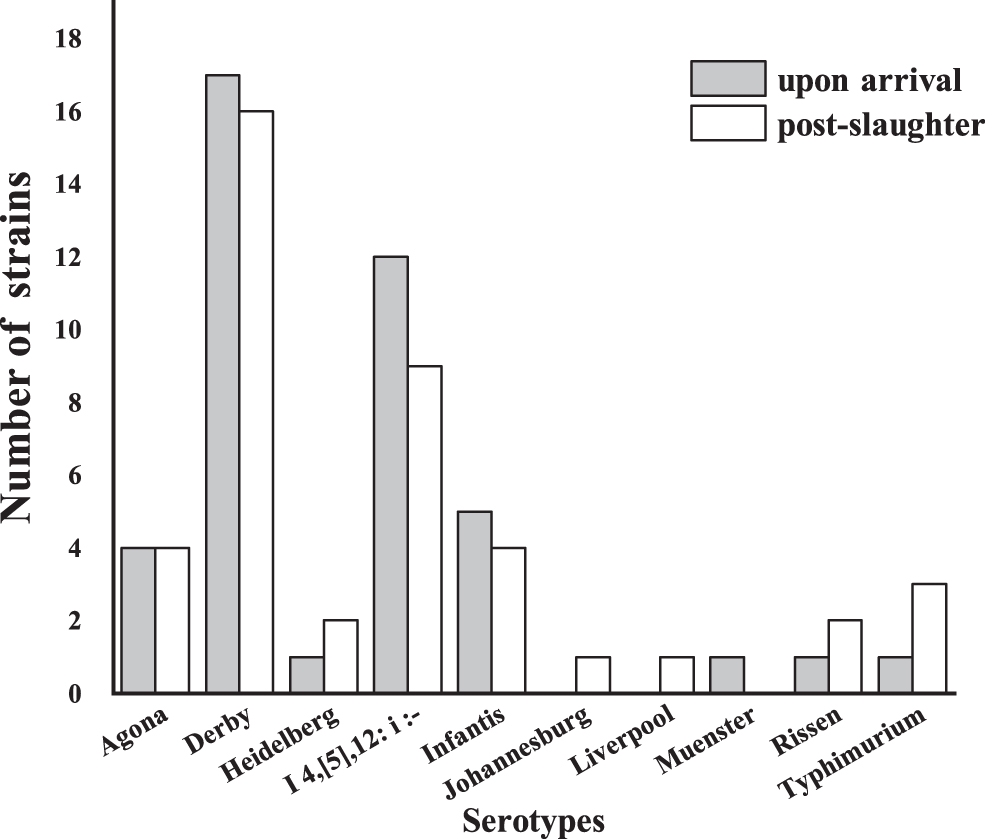
Serotype distribution of Salmonella spp. isolated from samples collected upon arrival and postslaughter at the abattoir.
Phenotypic resistance patterns detected upon arrival
Among the 42 strains tested, 66.67% (n = 34) showed AMR and 54.76% (n = 29) were multidrug resistant (MDR, i.e., displaying phenotypic resistance to at least three classes of antimicrobials). The most common resistance detected included TET (66.67%), STR (54.76%), SXZ (52.38%), and AMP (35.71%) in strains collected preslaughter (Fig. 2). Although most strains displayed susceptibility to cephalosporins, no significant difference in resistance was observed between the second (Fox, 14.29%) and third generations (CEF and CRO, 14.29%), which is important to note considering they are the first-line therapy for treating salmonellosis in humans. 47 Low levels of resistance to CHL (7.14%) and TMP (4.76%) were also detected. All isolates were susceptible to GEN and AZM (Supplementary Table S2). Moreover, nine resistance patterns, the top 3 most frequent were pan-susceptible (33.33%, n = 14), STR-AMP-TET-SXZ (21.43%, n = 9), and STR-TET-SXZ (16.67%, n = 7; Supplementary Table S3).

Antibiotic resistance of Salmonella isolates from different sample types. AMP, ampicillin; AMX, amoxicillin; AZM, azithromycin; CEF, ceftiofur; CHL, chloramphenicol; CRO, ceftriaxone; FOX, cefoxitin; GEN, gentamicin; STR, streptomycin; SXZ, sulfisoxazole; TET, tetracycline; TMP, trimethoprim.
Phenotypic resistance patterns of isolates collected postslaughter
Thirty-five of the 42 (63.33%) Salmonella strains were resistant to at least one antimicrobial and 22 (52.38%) strains showed MDR. The top 4 most common resistance patterns appeared in the same order as isolates from arrival samples (Fig. 2). A low level of resistance to cephalosporins was also found in cecal samples, whereas GEN and CHL showed higher resistance rates in the cecal than the fecal isolates. All isolates were susceptible to AZM (Supplementary Table S2). Eleven resistance patterns were identified; the three most frequent were TET (26.19%, n = 11), pan-susceptible (16.67%, n = 7), and STR-AMP-TET-SXZ (16.67%, n = 7; Supplementary Table S3).
Genotypic resistance profiles detected upon arrival
Seventeen resistance genes were identified in the 42 isolates that included five different antimicrobial classes (Table 1). Aminoglycoside resistance genes were the most prevalent. Ten distinct aminoglycoside resistance genes were detected, including the most common gene aac(6′)-Iaa in fecal samples. The prevalence of TET resistance genes was the second highest, of which tetB gene was the most frequent. Sulfonamide resistance genes ranked third, present in 42.86% of the isolates collected before slaughter, and sul2 accounted for 26.19%. Two other sulfonamide resistance genes were also detected including: sul1 in 11 strains; and sul3 in one strain. The next predominant resistant genes functioned by interacting with beta-lactam antibiotics, most of which were blaTEM-214 and blaCMY-33. Moreover, the presence of the two extended-spectrum β-lactamases (ESBL) genes indicated resistance to a third-generation broad-spectrum cephalosporin. A less frequently encountered group was the phenicol-resistant genes. An efflux pump encoding gene floR was observed in three strains. Two isolates harboring both sul1 and one diaminopyrimidine-resistant genes were also identified, which correlates with phenotypic resistance (Supplementary Table S4). Fourteen resistant gene combinations were observed, the three most frequent were aac(6′)-Iaa (n = 15, 35.71%), aac(6′)-Iaa/strA/strB/blaTEM-214/tetB/sul2 (n = 8, 19.05%), and aac(6′)-Iaa/tetB (n = 5, 11.90%; Supplementary Table S5).
Overview of Resistance Genes Detected Based on Whole-Genome Sequencing Prediction
TET, tetracycline.
Genotypic resistance profiles of isolates collected postslaughter
Twenty unique resistance genes were identified, which encoded for resistance in all six antimicrobial classes tested (Table 1); 97.62% of the tested strains harbored at least one resistance gene. The most commonly observed resistance genes included resistance to aminoglycoside, TET, sulfonamide, and beta-lactam, followed by phenicol. A single isolate harbored a combination of two different genes (sul1 and dfrA1) that also exhibited dual resistance to SXZ and TMP. Only one macrolide resistance gene (mefB) was detected in one isolate, which conversely showed phenotypic susceptibility (Supplementary Table S4). Overall, 18 genotypic resistance profiles were detected, with the most common being aac(6′)-Iaa/tetB (n = 11, 26.19%), aac(6′)-Iaa (n = 6, 14.29%), and aac(6′)-Iaa/strA/strB/blaTEM-214/tetB/sul2 (n = 6, 14.29%; Supplementary Table S5).
Comparisons of resistance patterns between upon arrival and postslaughter at abattoir
Compared with the isolates collected from cecal samples (postslaughter), fewer resistance profiles were found in the preslaughter fecal samples for phenotype (Fig. 3 and Supplementary Table S3) and genotype (Fig. 4 and Supplementary Table S5). Statistical analysis did not identify any significant association between sampling time (pre–postslaughter) and resistant gene profiles (p > 0.05, analyzed with two-sided Fisher's exact test). However, a significant difference was detected in phenotypic resistance patterns between the sample types (p < 0.01, two-sided Fisher's exact test). The strongest associations between observed resistance to each antibiotic and the presence of resistant genes were detected between blaCMY-33 and beta-lactam resistance (kappa = 0.90 and 95% confidence interval [CI] = 0.76–1.00), and dfrA1 and diaminopyrimidines resistance (kappa = 0.75, and 95% CI = 0.40–1.00; Table 2). However, there were occasions where poor associations were obtained through known resistance determinants. Genes linked to aminoglycoside resistance were identified in 82 strains (Supplementary Table S6 GEN and STR), of which only 2 (2.44%) and 45 (54.9%) strains exhibited phenotypic resistance to GEN and STR, respectively. In addition, cases were observed in which genes conferring corresponding resistance were not detected in resistant strains (SXZ-10 strains, TET-6 strains; Supplementary Table S6).
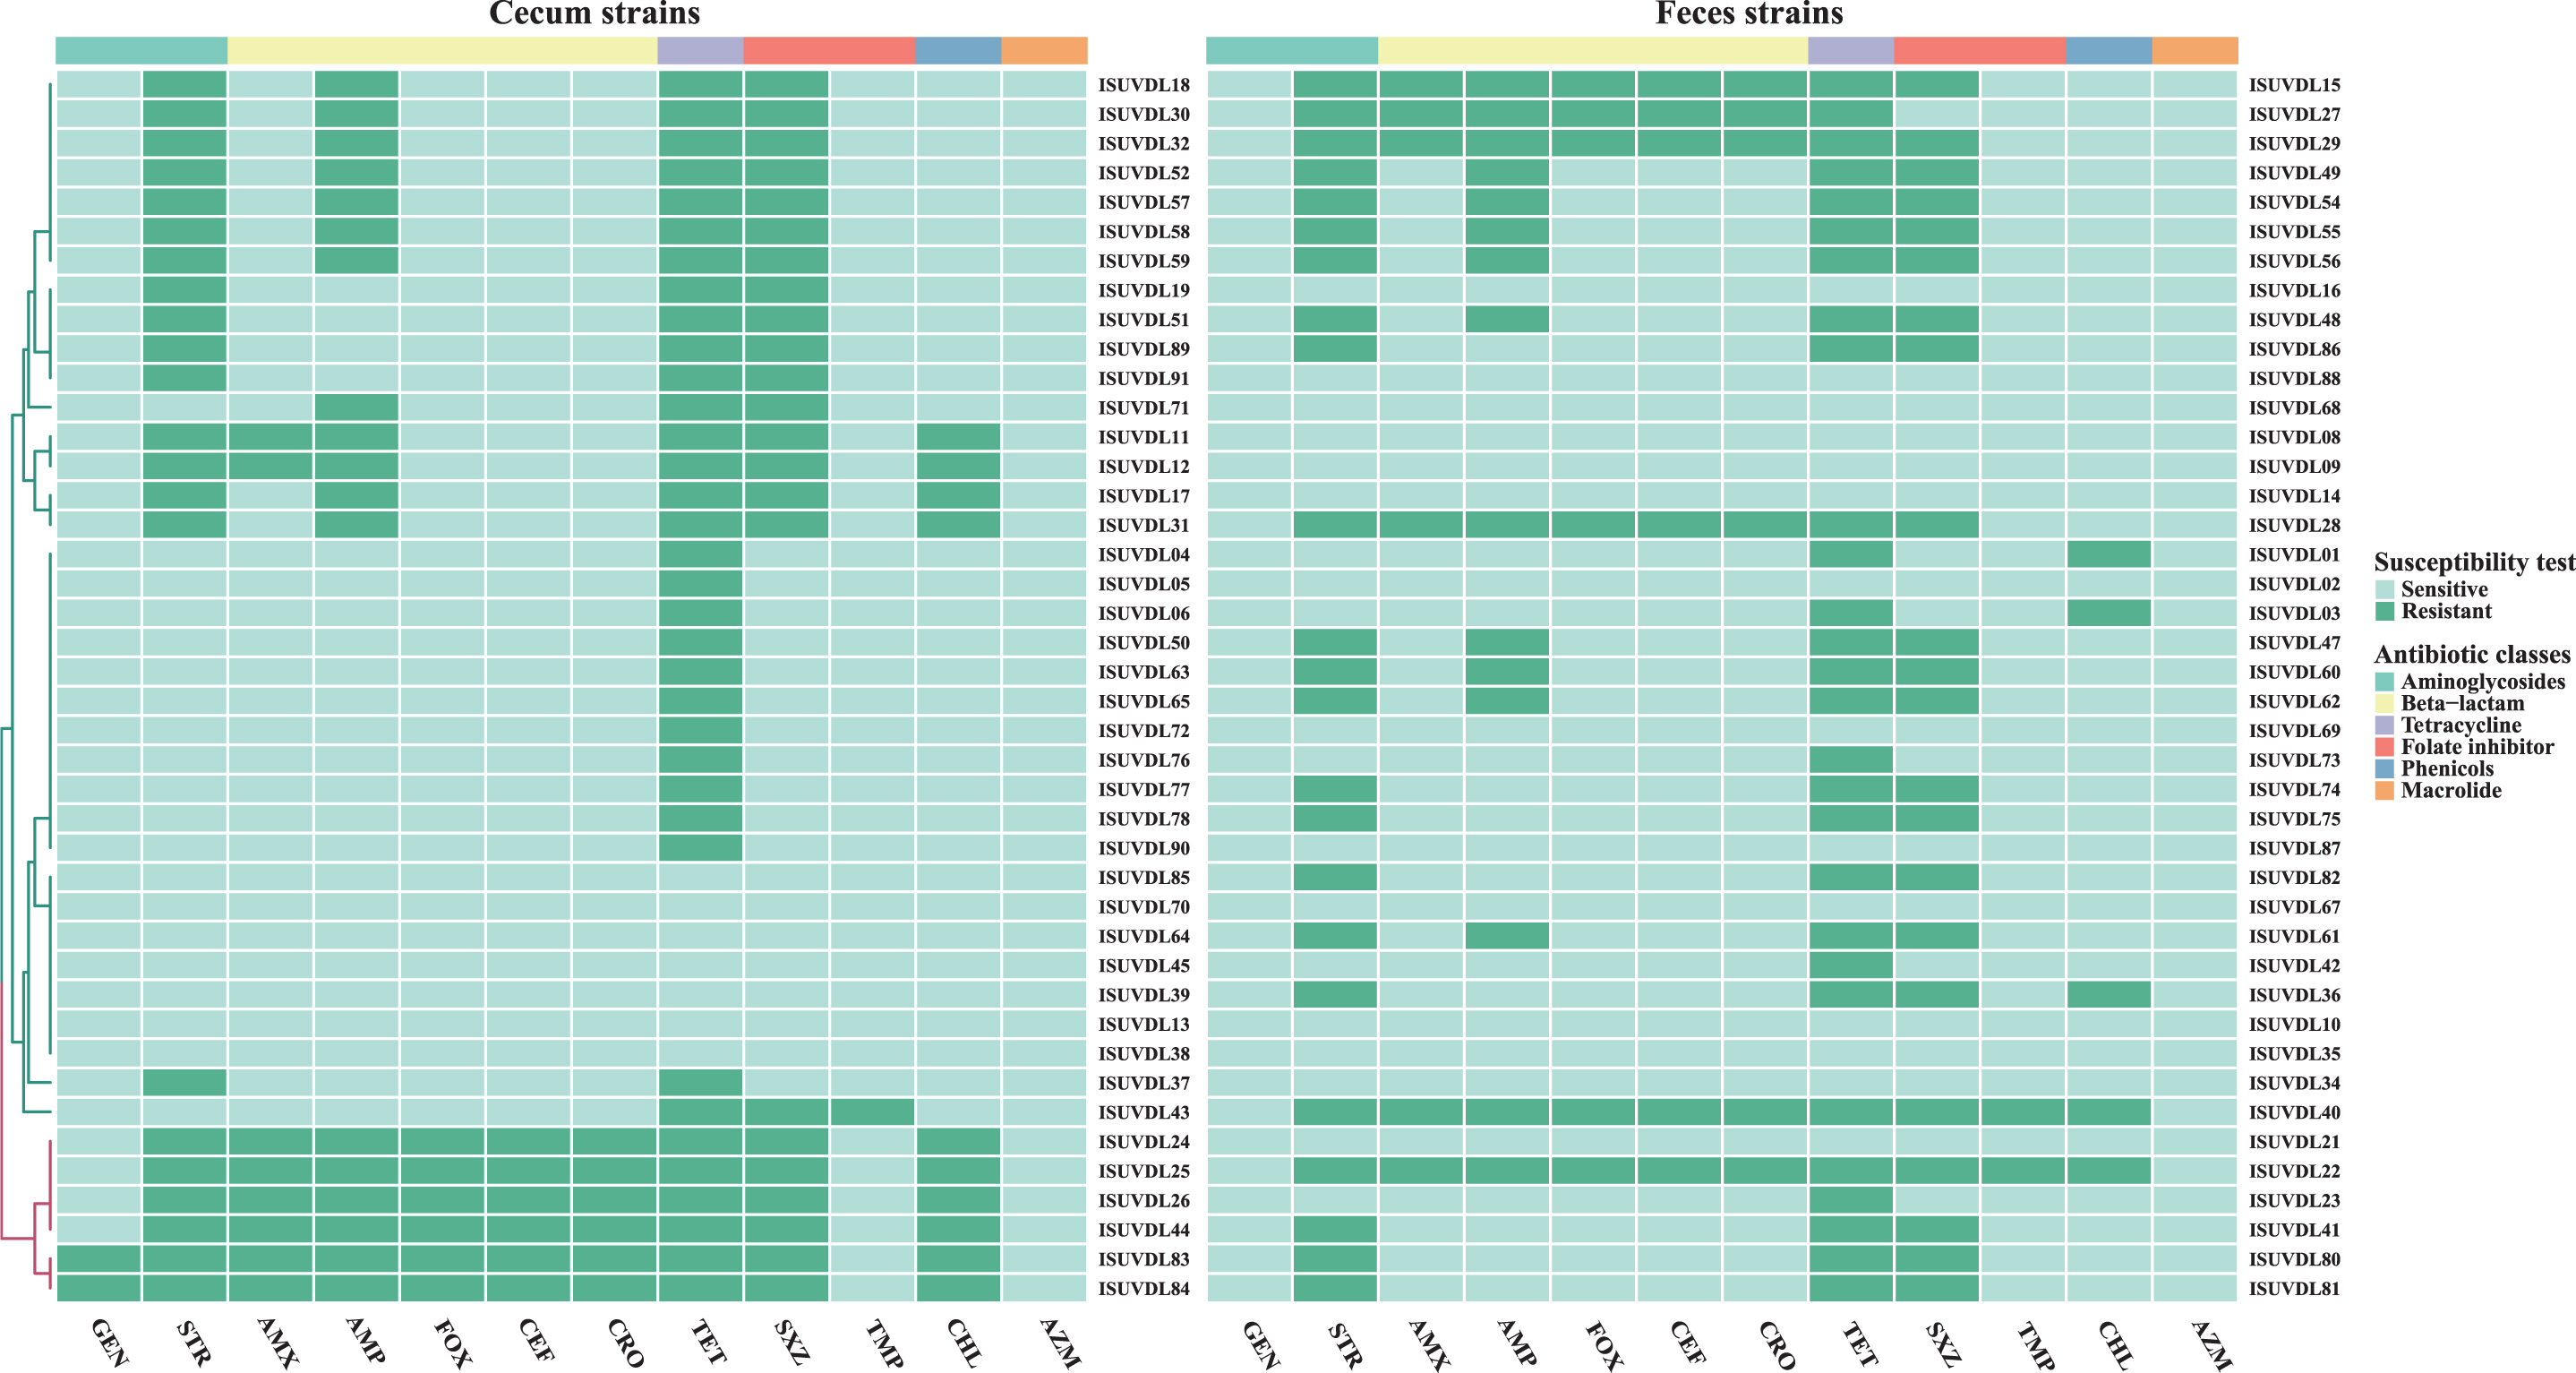
Heatmap of the phenotypic resistance profile for 84 strains from cecum and feces samples. Intermediate phenotypes were counted as resistant in this analysis. Grayish-green indicates sensitive, dark green indicates resistance. Horizontal colored bars indicate different antibiotic classes according to their chemical properties. The row dendrogram is drawn based on a hierarchical clustering calculation with Euclidean distance.

Heatmap visualization of genotypic resistance patterns identified from cecum and fecal strains. Grayish-green represents absence and dark green represents presence of resistance genes. Top bars are representatives of the different antibiotic classes. The row dendrogram is drawn based on a hierarchical clustering calculation with Euclidean distance.
Agreement Analysis Between Genotypes and Phenotypes of Antimicrobial Resistance
Genotype–phenotype agreement was evaluated using Cohen's kappa coefficient.
AMP, ampicillin; AMR, antimicrobial resistance; AMX, amoxicillin; CEF, ceftiofur; CHL, chloramphenicol; CI, confidence interval; CRO, ceftriaxone; FOX, cefoxitin; STR, streptomycin; SXZ, sulfisoxazole; TMP, trimethoprim.
Discussion
To test the hypothesis that the patterns of AMR observed postslaughter were reflective of those observed in the same cohort of pigs at arrival, comprehensive resistance profiles of Salmonella spp. strains isolated upon arrival and at postslaughter were determined through integrated surveillance approaches. Previous studies reported that cecal samples had the highest relative sensitivity and can reflect the intestinal microflora more directly postmortem.19,48 In 2016, WGS data were first published in NARMS surveillance reports and showed great potential in tracking resistance trends and mechanisms. 48 However, because WGS cannot identify novel resistance genes, both WGS and antimicrobial susceptibility tests were implemented in this study.
Among AMR types detected, the highest level of AMR was to TET and SXZ; these same resistant trends have been reported by the Food and Drug Administration from food animals. 49 A much lower resistance to GEN was observed compared with STR, suggesting that the resistance to older aminoglycosides was higher than newer aminoglycosides. Similar phenomena were reported in other Gram-negative bacteria. 50 Frye et al. 16 found a reduced susceptibility to the third-generation cephalosporin, CRO, in Salmonella enterica isolated from U.S. cattle, which was also detected in this study (14.29% resistant strains).
WGS has proven to be a promising approach for detecting trends associated with AMR34,51 and is being adopted as a routine tool by an increasing number of surveillance programs. 48 To avoid the bias of building the assembly on a reference template, de novo assembly was implemented herein. However, resistant genes may potentially be missed where splitting across multiple contigs occurs. 52 To circumvent this issue, SRST2 was used to detect resistance gene determinants in raw reads. Several other researchers have been inclined to classify intermediate phenotypes into susceptibility categories and genotype–phenotype correlations have improved as a consequence.51,53 The clinical interpretive criteria used for intermediate classification reflects the concentration ranges for isolates containing resistant genes, however, does not present MICs over the resistance threshold 54 ; hence, “intermediate” was classed as resistance in this study, which was also described by Shelburne et al. 55 in a previous study.
A medium concordance was observed between phenotypic and genotypic antibiotic-resistant profiles, with 780 of the 1,008 phenotypic tests in agreement with WGS-inferred antibiotic resistance results. From the mismatches, 198 of 228 (86.84%) constituted major errors (false positives, MEs). The largest discrepancies could be attributed to MEs caused by the false prediction of GEN (80/228, 35.09%) and STR (37/228, 16.23%) resistance, whereas the predictions for SXZ resistance accounted for 33.33% (10/30) of the very major errors (false negative, VMEs). Several recent studies reported that genotyping predictive errors were more common for specific antimicrobials and that predictions could be improved by excluding the antibiotics mentioned previously.54,56 For GEN, the many MEs were caused by the isolates carrying the aac(6′)-Iaa gene alone, which were reported to confer no resistance to GEN. 57 In the case of STR, because there is no clinical breakpoint defined by CLSI, an empirical value of 64 μg mL−1 was applied as the interpretative resistance criteria based on NARMS criteria.
The differences between phenotypes and genotypes might be the consequence of the breakpoint used for categorizing the isolates. Garcia-Migura et al. 58 found that 13.5% of the Salmonella strains tested harbored resistant genes and exhibited MICs ≤32 mg/L. Tyson et al. 59 discovered that using an STR resistance breakpoint of ≥64 μg mL−1 misclassified >20% of strains with aadA or strA/strB resistance genes as wild type (microorganisms without acquired resistance mechanisms). Therefore, reducing the phenotypic cutoff values of STR might help minimize the misclassification of resistance predictions. As for the VMEs of SXZ, several researchers suggest that heteroresistance might be an underlying cause for false-negative WGS-based AMR predictions. 60 In addition, the failure of WGS to detect resistance could be owing to the limitations of genetic mechanisms represented in the AMR database used in this study. 61
Furthermore, the genetic diversity within the Salmonella isolates tested could impact the overall resistance degree predicted by the utility of WGS. 62 A recent study by Pornsukarom et al. 63 reported that AMR genes cluster with the Salmonella serovars. Of the 10 serotypes detected by WGS, several serotypes, including Typhimurium, Heidelberg, Infantis, and Agona, were among the top 15 serotypes causing human salmonellosis in the United States. 64 In addition to the common serotypes prevalent in swine (Derby and Agona) and other food animals (Infantis),65,66 serotype I 4,[5],12:i:- (a monophasic variant of Salmonella Typhimurium) was also isolated here, which has emerged as a major public health threat in the United States over the past few decades.67,68 Decreased proportions of the serotype Typhimurium were found, and some less common serotypes, such as Johannesburg and Rissen, were also detected in this study. These results were similar to the changes in prevalence of Salmonella serovars associated with swine production reported by Yuan. 68 Multidrug resistance was observed primarily in Salmonella I 4,[5],12:i:- (17/45, 37.78%) and Salmonella Derby (13/45, 28.89%). Seventeen of 21 Salmonella I 4,[5],12:i:- strains expressed the typical resistance pattern ASSuT (AMP, STR, sulfonamides, and TETs) as described previously (Supplementary Tables S7 and S8). 69
Of interest, no matter which sample scheme was applied, statistical analysis of the data did not identify any significant difference in the frequencies of isolates against each antibiotic and the occurrence of each resistance gene (data not shown). The statistical analysis suggested that the overall phenotypic antibiograms varied, depending on the sampling schemes (Fisher's exact test, p = 0.00222), which rejected our hypothesis. Thacker 70 came to a similar conclusion, that the samples collected at the slaughterhouses are not reflective of the AMR in Salmonella from animals on arrival at the abattoir. Several factors could be responsible for the heterogeneity of the AMR profiles that were detected pre- and postslaughter, including lairage and slaughtering. The lairage time was kept to at least 2 h, which is long enough for Salmonella to colonize the gut. 71 Other studies demonstrated that Salmonella cross-contamination could occur along slaughter lines, an environment that already likely contains exotic Salmonella.17,72 In addition, the evisceration stage might play an important role in Salmonella transmission along the slaughter line. 72
This study did, however, fail to reject the hypothesis based on genetic data analysis (for resistance gene profiles, Fishers exact test, p = 0.05264). The statistical discrepancies observed may be owing to a number of other factors. First, although WGS has demonstrated promise and offers a more realistic alternative to phenotypic antimicrobial susceptibility testing in Campylobacter spp. and some serovars of Salmonella,33,34,73 phenotypic susceptibility testing is still considered the gold standard and continues to be performed to guide clinical treatments.54,62 Second, one of the limitations of WGS-based surveillance of AMR is the detection of heteroresistance, 62 which likely accounts for the primary reason why WGS is generally applied to bacterial strains with a clear genetic background. While 10 serovars were identified in this work (Fig. 1), a comparison of genotypic resistance patterns might be compounded by the genetic diversity of Salmonella. In addition, mechanisms that are currently unknown may attenuate or inhibit gene expression,58,74 which would not be determined by WGS, and could cause deviations in the comparisons of AMR profiles based on phenotypic and genotypic data.
Another important aspect to consider is library construction. Libraries were created with Nextera XT kit containing a PCR-enrichment step, which provides bias in the coverage of the reads located in different parts of genomes.75,76 Moreover, great variations of the depth of reported resistance genes were detected (ranging from 1.45 to 2,352.57; Supplementary Table S9), which could affect the WGS-derived AMR patterns. Finally, more resistance patterns were identified with WGS than with the phenotypic antimicrobial susceptibility test. Thus, as the degree of freedom increased, the p-level became less significant, which was unlikely to reveal small effects.77,78 Beyond this, further work that takes genetic diversity and test power into account needs to be done to improve the performance of WGS-inferred antimicrobial susceptibility.
Conclusions
This study suggests that the samples collected postslaughter can be used to monitor neither AMR in Salmonella observed at arrival in swine, nor on-farm resistance which is geographically and temporally even more distant to the arrival samples.
Footnotes
Acknowledgments
The authors thank Huigang Sheng for whole-genomic sequencing of the tested isolates, Ying Zheng for the assistance in bioinformatic analysis.
Disclosure Statement
No competing financial interests exist.
Funding Information
This work was supported by the National Pork Board. Drs. Qi Feng and Shanyuan Zhu was supported by the Integration and Innovation Center for industry technology system of Jiangsu modern agriculture (Grant No: JATS[2019]367); and Jiangsu Agricultural Science and Technology Innovation Fund (Grant No: CX(18)1004).
References
Supplementary Material
Please find the following supplemental material available below.
For Open Access articles published under a Creative Commons License, all supplemental material carries the same license as the article it is associated with.
For non-Open Access articles published, all supplemental material carries a non-exclusive license, and permission requests for re-use of supplemental material or any part of supplemental material shall be sent directly to the copyright owner as specified in the copyright notice associated with the article.