




Abstract
Background:
Defining and detecting the metabolic syndrome in children and adolescents is difficult because of ongoing discussion of components and thresholds. The aim of this work was to highlight the limitations of a dichotomous definition of the metabolic syndrome, leading to considerable overlap between those with and without the metabolic syndrome, by computing different continuous scores.
Methods:
A total of 50 children and adolescents ages 6–16 years were studied. Height and weight were measured; body mass index (BMI) was calculated, and obesity was defined by age- and sex-specific 97th percentiles of French reference values. Metabolic syndrome prevalence was based on the criteria reported by Chen et al. in 2006 and compared with five scores reflecting specific metabolic syndrome components (MetScores): Fat mass, waist circumference, BMI, homeostasis model assessment (HOMA), and systolic blood pressure.
Results:
Using a standard clinical definition, 48% of obese children and adolescents were diagnosed with metabolic syndrome. The prevalence of metabolic syndrome in the sample was much higher using specific MetScores: Fat mass, 92%; waist circumference, 94%; BMI, 94%; HOMA, 98%; and systolic blood pressure, 84%. Insulin resistance (IR), assessed as a high HOMA index, was present in 68% of the sample, and was the metabolic syndrome component with the highest prevalence.
Conclusions:
The use of a continuous indicator of the metabolic syndrome, such as MetScores, may help to overcome limitations imposed by dichotomous definitions, particularly among obese children and adolescents. A high prevalence of IR indicates the relevance of HOMA in detection of the metabolic syndrome.
Introduction
C
It is not clear whether a definition based on dichotomized parameters is useful in children and adolescents.7 Dichotomous and categorical approaches oversimplify the complexity of the metabolic syndrome, which involves several components.8 , 9 Therefore, a definition of metabolic syndrome based on the continuous distribution of individual components may be useful. The definition and existence of metabolic syndrome is currently debatable, and it has even been suggested that the metabolic syndrome is a “myth.” 10
The establishment of a unified set of criteria for the metabolic syndrome in children and adolescents may form the foundations for addressing public health concerns regarding the progression of the syndrome in different populations.11 Some suggest that the use of a score to characterize metabolic syndrome may be more useful than standard dichotomous definition.12 Such a score could reflect the continuous nature of each of the risk factors, which may be more informative prognostically than the use of dichotomous variables, and in turn may be a better and useful predictor of metabolic and cardiovascular risks.13 Mainly the European Youth Heart Study (EYHS) has used a score to define risk and presence of metabolic syndrome.14 –18 The model used in the EYHS computed a risk score for metabolic syndrome from 6 measurements—insulin, glucose, high-density lipoprotein cholesterol (HDL-C), triglycerides, sum of 4 skinfold measurements, and the average of systolic (SBP) and diastolic blood pressures (DBP).
The continuous distribution of a risk score that captures the major components of the metabolic syndrome appears to overcome limitations of standard dichotomous definitions. If such a score is more realistic than dichotomous classification of the presence or absence of the metabolic syndrome, the choice of specific components of a risk score, for convenience the MetScore, needs further examination. The aim of this work was to highlight the limitations of a dichotomous definition of the metabolic syndrome, leading to considerable overlap between those with and without the metabolic syndrome, by computing different continuous scores.
Subjects and Methods
Subjects
A sample of 50 obese French children and adolescents, 26 boys and 24 girls, between 6 and 16 years of age was recruited in collaboration with the Pediatrics Department of Clermont-Ferrand University Hospital. A body mass index (BMI) >97th percentiles for age and sex for the French population defined obesity.19 Informed consent was provided by parents and/or legal guardians and by the children and adolescents before the study. This work received an ethical agreement from the Regional Committee of Human Protection (IRB05921).
Measurements
After height and weight were measured and the BMI calculated to define the presence of obesity, a more comprehensive medical evaluation including hematology and biochemistry, urine analysis, blood pressures, more detailed anthropometry, and dual X-ray absorptiometry (DXA) assessment of body composition was carried out.
Anthropometry and body composition. Body weight was measured to the nearest 0.1 kg with a calibrated manual scale (Seca 709, France). Height was assessed to the nearest 0.5 cm with a standardized wall-mounted stadiometer. Waist circumference was measured at a level midway between the last rib and superior iliac crest, and hip circumference was measured as the largest hip diameter. Total body composition was estimated with DXA using a Hologic QDR 4500 unit and version 9.10 of total body scans software (Hologic Inc., Bedford, MA).
Blood pressures and blood samples. SBP and DBP were measured using an auditory stethoscope with a blood pressure cuff adapted to the arm circumference of the subject (Column Trimline graduated in mmHg, blood pressure cuff Welch Allyn). A Modular P900 clinical chemistry analyzer (Roche Diagnostic) was used to determine plasma concentrations of several markers based on a fasting blood sample. Plasma glucose concentration (hexokinase) and the total cholesterol (esterase cholesterol/peroxydase) were determined by enzymatic methods. HDL-C, low-density lipoprotein cholesterol (LDL-C) levels, and triglyceride concentration (lipoprotein lipase) were based on enzymatic colorimetric assays. Microalbuminuria values by immunoturbidimetry were also provided by the Modular P900. Plasma insulin concentration was measured by chemoluminescence (Immulite 2000, DPC Society). Insulin resistance was based on insulin and glucose concentrations using homeostasis model assessment for insulin resistance (HOMA-IR) as proposed by Matthews et al.20: Insulin (mIU/L) × glucose (mmol/L)/22.5. The index has been used in children and adolescents,21 , 22 and apparently is an accurate tool in obese children and adolescents, both prepubertal or pubertal.22
Detection of the metabolic syndrome
The presence or absence of metabolic syndrome was based on the criteria of Chen et al. using thresholds adapted to the French population.23 Metabolic syndrome was indicated when a child or adolescent presented at least 3 of the following criteria: (1) BMI ≥97th percentiles for age and sex19; (2) SBP or DBP ≥90th percentile24; (3) HDL-C ≤0.4 g·L−1 or triglyceride ≥1 g·L−1 in youth <10 years and ≥1.3 g·L−1 in youth >10 years 25; and (4) fasting glucose ≥1.1 g·L−1 or HOMA index >75th percentile.26
Metabolic syndrome risk scores
Metabolic syndrome risk scores (MetScores) were computed following the method of Brage et al.16 Z-scores for 6 variables were calculated: Insulin, glycemia, triglycerides, HDL-C, percentage fat mass based on skin folds, and the average of SBP and DBP. To indicate higher risk with increasing values, scores were multiplied by −1 if necessary. The scores were derived by subtracting the sample mean from the individual mean and then dividing by the standard deviation (SD) (of the sample mean) : Z = ([value − mean]/SD. By definition the mean of this continuously distributed metabolic syndrome score is therefore zero. The sum of Z-scores for each variable was divided by 6 to obtain the MetScore, which only applied to the population under study. The method of calculation of such a score has been previously presented in the literature.14 –16
The same procedures were used in the present study with different anthropometric and physiological indicators of metabolic syndrome; however, individual Z-scores were retained for analysis (in contrast to a mean Z-score). Three scores expressed different aspects of obesity: Percentage of total fat mass (MetScoreFM) based on DXA, waist circumference (MetScoreWC), and BMI (MetScoreBMI). HOMA was used to indicate insulin resistance (MetScoreHOMA), whereas only SBP instead of the average of blood pressures was used (MetScoreSBP).
Statistics
Statistical analyses were performed using the Statview version 5 for Windows. Data are presented as means and SD; significance was set at P = 0.05. The normality of variables was checked by the Kolmogorov–Smirnov test. Student t-tests were used to compare subjects with and without the MS based on the criteria of Chen et al.23 Analysis of variance (ANOVA) was used to test for differences and interactions between the different MetScores.
Results
Age and anthropometric and metabolic data for the total sample and for subjects with and without metabolic syndrome are summarized in Tables 1 and 2. If the whole sample was diagnosed as obese using the French values for obesity,19 38% were overweight and 62% were obese regarding the international cut-offs proposed by Cole et al. in 2001.27 A total of 48% of the whole sample was diagnosed with 3 or more of the metabolic syndrome criteria recommended by Chen et al.23 Obese children and adolescents with metabolic syndrome had significantly higher weight, BMI, and waist circumference than those not detected with the syndrome (P < 0.05). On the other hand, the metabolic parameters did not differ significantly in any variables except for SBP (P < 0.001), DBP (P < 0.01), and plasma triglycerides (P < 0.05), which were significantly higher in youths with metabolic syndrome.
Data expressed as mean ± standard deviation; *P ≤ 0.05.
Abbreviations: BMI, body mass index; WC, waist circumference; HC, hip circumference.
Data expressed as mean ± standard deviation; *P ≤ 0.05; **P < 0.01; ***P < 0.001.
Abbreviations: SBP, systolic blood pressure; DBP, diastolic blood pressure; HDL-C, high-density lipoprotein cholesterol; LDL-C, low-density lipoprotein cholesterol; HOMA, homeostasis model assessment.
Frequency of criteria of metabolic syndrome
The relative frequency of specific criteria of the metabolic syndrome after Chen et al.23 in the total sample of children and adolescents is shown in Fig. 1. According to the protocol of the study, all children were obese. After obesity, an elevated HOMA index was present in 68%, arterial hypertension in 48%, and dyslipidemia in 26% of the subjects. In a study by Chen et al.,23 among 24 children and adolescents with metabolic syndrome, 83.3% presented a high HOMA index and arterial hypertension and 50% had dyslipidemia. It is worth noting that among children without metabolic syndrome, 58.3% had a high HOMA index. The prevalence of the metabolic syndrome components is presented in Fig. 2, with a distinction made between children with or with the metabolic syndrome.
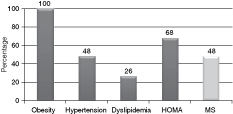
Prevalence of the metabolic syndrome (MS) among the whole population and relative frequency of MS criteria in the total sample using the criteria of Chen et al.23: Obesity, body mass index (BMI) ≥97th percentile19; Hypertension, systolic blood pressure (SBP) or diastolic blood pressures (DBP) ≥90th percentile24; Dyslipidemia, high-density lipoprotein cholesterol (HDL-C) ≤0.4 g·L−1 or triglycerides ≥1 g·l−1 <10 years and ≥1.3 g·L−1 >10 years25; homeostasis model assessment (HOMA) index ≥75th percentile.26

Prevalence of the metabolic syndrome (MS) components discriminating subjects with and without MS using the criteria of Chen et al.23: Obesity, body mass index (BMI) ≥97th percentile19; Hypertension, systolic blood pressure (SBP) or diastolic blood pressures (DBP) ≥90th percentile24; Dyslipidemia, high-density lipoprotein cholesterol (HDL-C) ≤0.4 g·L−1 or triglyceride ≥1 g·L−1 <10 years and ≥1.3 g·L−1 >10 years25; homeostasis model assessment (HOMA) index ≥75th percentile.26
Metabolic syndrome risk score (MetScores)
MetScores for subjects with and without metabolic syndrome as per Chen et al.23 are given in Table 3. All of the MetScores proposed were significantly lower in obese children and adolescents without metabolic syndrome. By definition, the MetScores, based on a Z-score model, divide the sample into equal groups around the mean for the total sample.
Data expressed as mean ± standard deviation; *P ≤ 0.05; ***P < 0.001.
Abbreviations: BMI, body mass index; %FM, percentage of total MetScore; WC, waist circumference; SBP, systolic blood pressure; HOMA, homeostasis model assessment.
Some children without metabolic syndrome have similar or higher scores than those with metabolic syndrome, and so on. Then, using these scores, among children and adolescents without metabolic syndrome (using the clinical definition), those who had a MetScore equal or greater than the subject with metabolic syndrome with the lowest score were presented as being at risk for developing the syndrome. This is illustrated in Fig. 3, which shows the distribution of the MetScoreWC for the total sample as an example. Table 3 expresses the prevalence of the metabolic syndrome obtained using the distribution of scores of individual children and adolescents. There are no significant interactions or differences between the MetScores.

Distribution of the metabolic syndrome risk score/waist circumfrence (MetScoreWC) for individual children and adolescents with and without metabolic syndrome (MS) using the criteria of Chen et al.23
Discussion
Relatively few studies have investigated the metabolic syndrome in Europe and in French children and adolescents in particular. Nevertheless, a relatively high prevalence is often observed. In a recent study of obese youths 7–17 years of age, a prevalence of 15.9% was noted, using the definition of metabolic syndrome proposed by the National Cholesterol Education Program (NCEP) whose cut points were adapted to a French population.28 The present study compares a definition of the metabolic syndrome based on a dichotomous model in obese children and adolescents with scores for individual components of metabolic syndrome that express the continuous nature of this increasingly common clinical condition. Using the criteria of Chen et al.,23 48% of obese children and adolescents were diagnosed with metabolic syndrome. Although obesity influences the prevalence of the metabolic syndrome,29 the 2 studies of French youths illustrate the problems associated with the variety of definitions and criteria of metabolic syndrome that influence estimates of its prevalence.
Although metabolic syndrome was diagnosed in 48% of 50 obese children and adolescents in the present study, the relative frequencies of the presence of specific metabolic components varied considerably: Insulin resistance, 83.3%; hypertension, 83.3%; and dysplipidemia, 50%. The results are consistent with those of Csabi et al.2 in presenting specific components of the metabolic syndrome in obese children, although the presence of metabolic syndrome was not diagnosed.
Metabolic syndrome: dichotomous or continuous?
The present study compared the model of metabolic syndrome described by Chen et al.,23 which was based on the findings of the World Health Organization (WHO) and NCEP for adults with scores for individual components of the metabolic syndrome. A total of 48% of the obese French children and adolescents in the study were diagnosed with at least 3 components of metabolic syndrome. The method of Chen et al.,23 however, does not take into consideration components that do not exceed the cut points, but may be close to them. Thus, the dichotomous nature of the method may be a major limitation. The present study also used risk scores (MetsScores) for individual components of metabolic syndrome based on the model proposed by the EYHS.14 , 16 –18 The utility and derivation of such continuous scores in pediatric populations have been presented recently in an overview by Eisenman.30 Three of the MetScores were based on different expressions of obesity and percentage of total fat based on DXA, BMI, and waist circumference, in contrast to the sum of skinfold measurements proposed by the EYHS. Two other risk factors were the HOMA index as an indicator of insulin resistance and SBP as an indicator of arterial hypertension. The latter is in contrast to the EYHS, which used the average of SBP and DBP; however, some evidence suggests that SBP is a better indicator of metabolic syndrome risk in children and adolescents.31 , 32
Significantly higher MetScores for percent fat mass (FM) (P ≤ 0.01), BMI (P ≤ 0.001), WC (P ≤ 0.001), HOMA (P ≤ 0.05), and SBP (P ≤ 0.001) in children diagnosed with metabolic syndrome following the definition of Chen et al.23 imply the reciprocal validity of the methods. All five MetScores indicated a higher prevalence of the metabolic syndrome compared to the definition of Chen et al.23 Effectively, using the lowest score as a reference among children and adolescents with metabolic syndrome after Chen et al.,23 94% of the total sample would be at risk for developing metabolic syndrome using the MetScores for the BMI and WC, 92% using the MetScore for percent FM, 84% for SBP, and 98% using the MetScore for HOMA. The results suggest that the use of a standard dichotomous definition of the metabolic syndrome, i.e., with or without metabolic syndrome, does not adequately diagnose patients who may be at risk of developing metabolic syndrome, consistent with the observations of Goodman et al.12 , 33 Calculating MetScores for individual components of the metabolic syndrome may thus be more useful than a dichotomous approach. Continuous scores for individual components of the metabolic syndrome may lead to less error than a dichotomous approach34 and may provide a valid indicator of the metabolic syndrome.16
To the best of our knowledge, this study is perhaps the first to compare scores reflecting risk of the metabolic syndrome in obese children and adolescents, with a commonly used method of detection based on dichotomous thresholds. The MetScore, by its continuous nature, takes into consideration the degree of development of each of the components of metabolic syndrome, which seems to be essential, and perhaps particularly for obesity that generally progresses with age in children and adolescents35 and that plays a central role in the metabolic complications.3
Limitations of MetScores
The scores described apply only to the sample of obese French children and adolescents in this study. The MetScore was based on the approach used in the EYHS,14 , 16–17 but different anthropometric and physiological parameters were used in the present study. The EYHS used the sum of 4 skinfold measurements as an index of adiposity, whereas the present study used percent FM based on DXA, which is a more sensitive indicator of adiposity than skinfold measurements. In addition, WC and BMI were also used to provide a more comprehensive approach to obesity. Insulin and glucose concentrations used in the EYHS were replaced by the HOMA index as an indicator of insulin resistance, whereas the average of SBP and DBP was replaced by SBP as an indicator of arterial hypertension.
A limitation of the present research is the broad age range of the subjects, 6–16 years, including prepubertal and pubertal subjects. Although Cook et al.36 observed no discrepancy in the prevalence of the metabolic syndrome by stage of pubertal development, information on pubertal development in the present study may have strengthened the analysis. Considering only age does not satisfactorily adjust for variation in body composition and hormonal levels in a sample including prepubertal, pubertal, and mature youths. However, pediatric criteria for metabolic syndrome components are given by age, not by pubertal stage. SBP and DBP,24 HOMA,26 and BMI19 are expressed relative to percentiles based on the age. The reference values are sex specific, emphasizing a potential gender effect. Concerning dyslipidemia, the detection of triglycerides concentrations is also established regarding the patients’ age.25
The present study results show that the prevalence of metabolic syndrome in a sample can vary as a function of the indicators for classification. This illustrates the need for indicators that best characterize the risk of metabolic syndrome in a population. Further studies are needed to express precisely individual components of the metabolic syndrome. The results based on 50 obese children and adolescents indicate a high prevalence of insulin resistance expressed in the MetScore for the HOMA index. This suggests that the HOMA index should be an essential component in screening for the metabolic syndrome in obese children and adolescents. The present study results highlight a high prevalence of the HOMA index in subsamples with and without metabolic syndrome. Effectively, 53.8% of children and adolescents who were not detected with metabolic syndrome (less than 3 of components using the criteria of Chen et al.23) presented a high HOMA index. Although IR added to their obese status, they were not considered at risk for metabolic syndrome, which illustrates the limitations of threshold values. These results echo those of previous studies showing an inverse relationship between metabolic risk and insulin sensitivity (IS); children with metabolic syndrome had 51% to 60% lower IS (P ≤ 0.001), regardless the definition used.37
MetScore can consider all components of metabolic syndrome with similar coefficients, which implies that each component has the same impact on diagnosis and development of the clinical condition. However, the frequencies of specific components are not equivalent in obese children. Thus, the calculation of the MetScore is a limitation. Further statistical and methodological investigations are needed to understand the influence of each factor in the development of metabolic syndrome and specifically the expression of the risk in an appropriate MetScore. The development of an optimal algorithm considering the different weight and contribution of each component would indeed constitute a great and helpful tool in the detection and prevention of metabolic syndrome and its related complications.
Conclusion
The use of continuous indicators of the metabolic syndrome, such as the MetScores, provides the possibility of passing over the limitation imposed by dichotomous definition, particularly among obese children and adolescents. It has to be clearly noted that the present paper does not pretend to provide an exemplar method to detect the metabolic syndrome in obese children and adolescents, but tends to underline the need to develop tools such as the MetScores to avoid existing limitations of dichotomous schemes. Further investigation is needed to refine this approach to document more precisely the physiological bases of the metabolic syndrome and to obtain better indicators of this condition.
Author Disclosure Statement
No competing financial interests exist.