




Abstract
Background:
The aim of this study was to investigate insulin sensitivity and secretion in lean and obese Asian (Thai) type 2 diabetic patients.
Methods:
Insulin sensitivity and insulin secretion was assessed with the hyperinsulinemic euglycemic (80 mU/m2 per min) and hyperglycemic clamp technique in 9 lean and 10 obese patients with type 2 diabetes and 4 lean and 4 obese nondiabetic control subjects.
Results:
Obese type 2 diabetics had a lower M-value (sensitivity to exogenous insulin) than lean type 2 diabetics (8.7 ± 1.3 versus 16.5 ± 1.6 mg · fat free mass kg−1 · min−1, P < 0.001) and obese control subjects (15.9 ± 4.0 mg · fat free mass kg−1 · min−1, P < 0.05). Insulin sensitivity (M-value) was similar in lean type 2 diabetics as compared to lean nondiabetic control subjects. During the hyperglycemic clamp, the first (P < 0.001) and second phase (P < 0.02) of insulin and C-peptide response (P < 0.02) was significantly decreased in lean type 2 diabetics as compared to lean nondiabetic subjects. In obese type 2 diabetics, the first and second phase of insulin response was significantly decreased (P < 0.05) compared to obese nondiabetic subjects.
Conclusions:
Obese type 2 diabetics have significant defects in both insulin sensitivity and insulin secretion whereas lean type 2 diabetics demonstrate primarily a defect in insulin secretion. Lean diabetics have similar insulin sensitivity when compared to healthy age- and sex-matched nondiabetic subjects during the euglycemic clamp study, suggesting the lack of significant insulin resistance in lean type 2 diabetics.
Introduction
T
In Thailand,5 the prevalence of type 2 diabetes is alarmingly high, and around 7% of the population is affected by the disease. Furthermore, about half of the type 2 diabetics are not overweight. In the present study we compared insulin sensitivity and insulin secretion using the gold standard euglycemic and hyperglycemic clamp technique between lean and obese type 2 diabetics for the first time in this population.
Materials and Methods
Subjects
We enrolled 9 lean and 10 obese patients (all Thai ethnicity) with type 2 diabetes and 4 lean and 4 obese healthy control subjects (see Table 1). Eleven type 2 diabetic patients had been taking a stable dose of an oral hypoglycemic agent (only sulfonylurea, metformin, and α-glucosidase inhibitor) for at least 6 months before study, and 9 type 2 diabetic subjects were treated with diet alone. Patients who had received insulin or a thiazolidinedione within the previous 12 months were excluded. All medications were discontinued at least 2 weeks before the patients were studied. Entry criteria included age (18–70 years), stable body weight for at least 3 months before enrollment, and fasting plasma glucose (FPG) between 7.0 and 14.5 mmol/L. Type 2 diabetic patients were excluded if they had evidence of complications from their diabetes or significant underlying diseases other than hypertension and dyslipidemia.
Healthy control subjects were matched for age to the type 2 diabetics. Healthy control subjects were excluded from the study if they had a family history of diabetes, were taking medication that disturbed glucose metabolism, or had abnormal glucose tolerance test based on American Diabetes Association 2004 criteria.7 Patients were excluded if they ever had diabetic ketoacidosis or had evidence of complications from their diabetes or significant underlying diseases other than hypertension and dyslipidemia. All patients were in good general health, without evidence of cardiac, hepatic, renal, or other chronic diseases as determined by history, physical examination, screening blood tests, and urinalysis. This study was approved by the ethics committee of Bangkok Metropolitan Administration Medical College and Vajira Hospital. All participants gave signed voluntary written informed consent before participation.
Data are means ± SEM.
a P < 0.01, lean versus obese diabetics.
b P < 0.05, control versus diabetics.
c P < 0.05, lean versus obese diabetics.
Abbreviations: BMI, body mass index; FPG, fasting plasma glucose; HgA1c, glycosylated hemoglobin; HDL, high-density lipoprotein; SEM, standard error of the mean.
Study design
Each subject underwent a hyperglycemic glucose clamp and an euglycemic hyperinsulinemic clamp on a separate day, as previously described.8 All subjects consumed a weight-maintaining diet with 50% of total energy from carbohydrate, 30% from fat, and 20% from protein. All studies were started at 9:00 a.m. following a 12-h overnight fast.
Insulin secretion was assessed by the hyperglycemic clamp technique. Briefly, after collection of baseline samples, plasma glucose was acutely raised and maintained at 125 mg/dL above baseline for 120 min by periodic adjustment of a 20% dextrose infusion based on the negative feedback principle. Under these conditions of constant hyperglycemia, the plasma insulin response is biphasic with an early burst of insulin release during the first 6 min, followed by a gradually progressive increase in plasma insulin concentration. Plasma samples were obtained every 2 min from 0 to 10 min (first-phase insulin secretion) and every 5 min from 10 to 120 min (second-phase insulin secretion). Subjects voided immediately before and at the end of the study for measurement of urinary glucose loss.
Insulin sensitivity was assessed with a 2-h euglycemic hyperinsulinemic (80 mU · m−2 · min−1) clamp. At 9:00 a.m., a catheter was placed retrogradely into a vein on the dorsum of the hand, which was then placed in a heated box (60°C). The second catheter was inserted into an antecubital vein on contralateral arm vein for a 20% dextrose infusion. Baseline arterialized venous blood samples for determination of plasma glucose and insulin concentrations were drawn at −10, −5, and 0 min. At time zero, a prime-continuous infusion of human regular insulin (Humulin R, Eli Lilly, Indianapolis, IN) was started at a rate of 80 mU · m−2 · min−1 and continued for 120 min. After the start of the insulin infusion, glucose was not infused until the plasma glucose concentration declined to 5.55 mmol/L. During the insulin clamp, arterialized blood samples were collected every 5 min for plasma glucose determination, and a 20% glucose infusion was adjusted, based upon the negative feedback principle, to maintain plasma glucose at approximately 5.55 mmol/L. Under these steady-state conditions of hyperinsulinemia and euglycemia during a high dose (80 mU · m−2 · min−1) insulin clamp, endogenous (hepatic) glucose production is almost completely suppressed and the glucose infusion rate equals insulin-stimulated whole-body glucose uptake and is therefore a measure of peripheral (muscle) sensitivity to exogenous insulin (M-value). Blood sample for determination of plasma insulin were collected every 10 min of the last 30 min of the study. An insulin sensitivity index (M/I) was obtained by dividing the M-value by the steady-state insulin value during the last 30 min of the clamp. Body composition was measured using bioelectric impedance.9
Analytical determinations
Plasma glucose was measured by the glucose oxidase method (Analox, London, U.K.). Plasma
Calculations
During the euglycemic hyperinsulinemic clamp study, basal and steady-state (80–120 min) plasma glucose and insulin represent the mean of values drawn at 10-min intervals. The steady-state glucose infusion rate (M-value) during the euglycemic clamp represents the mean glucose infusion rate from 80 to 120 min, corrected for urinary glucose losses. The insulin sensitivity index (ISI) was derived from the euglycemic clamp data, as previously described.10
All results are presented as the mean ± standard error of the mean (SEM). Differences between groups were compared using the Student t-test for unpaired samples and repeated measures analysis of variance (ANOVA), as appropriate. P < 0.05 was considered significant in all analyses.
Results
The baseline anthropometric and metabolic measurements are presented in Table 1. The obese type 2 diabetic and nondiabetic subjects had similar body mass indexes (BMIs) and waist circumferences. Both lean and obese type 2 diabetic patients had the similar glycemic control and duration of diabetes.
The mean insulin levels during the euglycemic insulin clamp were similar between all groups (Table 2). Obese type 2 diabetics had a lower M-values than lean type 2 diabetics (8.7 ± 1.3 vs. 16.5 ± 1.6 mg · fat free mass kg−1 · min−1, P < 0.001) and obese control subjects (15.9 ± 4.0 mg · fat free mass kg−1 · min−1, P < 0.05). Insulin sensitivity (M-value) was similar in lean type 2 diabetics as compared to lean nondiabetic control subjects (Table 2). The insulin sensitivity index (M/I) was similarly lower for obese type 2 diabetics compared to lean type 2 diabetics subjects (P = 0.01), but was not significantly different when obese nondiabetic subjects were compared with obese type 2 diabetics.
Data are means ± SEM. M/I, the insulin sensitivity index = M-value divided by the plasma insulin levels during the insulin clamp.
a P < 0.05, controls versus diabetics.
b P < 0.01, lean versus obese diabetics.
c P < 0.05, lean versus obese diabetics.
Abbreviations: SEM, standard error of the mean; FFM, fat free mass; ISI, insulin sensitivity index.
Obese nondiabetic subjects had pronounced hyperinsulinemia with higher level of fasting plasma insulin and C-peptide levels than lean nondiabetic subjects (Table 3). During the hyperglycemic clamp (Fig. 1), the first (P < 0.001) and second phase (P < 0.02) of insulin and C-peptide response (P < 0.02) was significantly decreased in lean type 2 diabetics as compared to lean nondiabetic subjects. In obese type 2 diabetics, the first and second phase of insulin response was significantly decreased (P < 0.05) compared to obese nondiabetic subjects (Table 3).
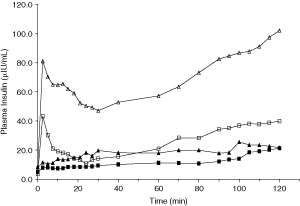
Mean plasma insulin levels during the hyperglycemic clamp in lean nondiabetic subjects (□), lean type 2 diabetics (▪), obese nondiabetic subjects (▵), and obese type 2 diabetics (▴).
Data are means ± SEM.
a P < 0.05, controls versus diabetics.
b P < 0.05, lean versus obese diabetics.
c P < 0.01, controls versus diabetics
Abbreviation: SEM, standard error of the mean.
Discussion
In this study, we investigated both insulin secretion and insulin action using the gold standard insulin clamp technique in lean and obese Thai type 2 diabetics. The results of this study demonstrate that whereas obese type 2 diabetics have significant defects in both insulin sensitivity and insulin secretion, lean type 2 diabetics were characterized primarily by a defect in insulin secretion. These results are consistent with earlier studies performed in a European population that showed normal peripheral insulin action in association with defects in insulin secretion in elderly nonobese type 2 diabetics.11 Lean diabetics had similar insulin sensitivity when compared to healthy age- and sex-matched nondiabetic subjects during the euglycemic clamp study, suggesting the lack of significant insulin resistance in lean type 2 diabetics. Our results differ from a previous study in a North American population that quantified insulin secretion and insulin resistance in nonobese and moderately obese patients (approximately 30% overweight) with type 2 diabetes. No significant differences were noted between the two groups for either variable.12 These previous studies seem to suggest a fundamental difference between the relative contribution of insulin resistance and β-cell dysfunction amongst two different populations in the pathogenesis of hyperglycemia in type 2 diabetes. Although none of the lean type 2 diabetics had clinical characteristics of maturity onset diabetes of the young (MODY), further studies in a larger group of Thai type 2 diabetics examining genetic defects in beta cell function need to be performed. Also, anti-glutamic acid decarboxylase (GAD) antibodies need to be measured in this population of lean type 2 diabetics to determine the prevalence of latent autoimmune diabetes in adults (LADA).
Previous studies in Southeast Asian populations have examined the role of insulin resistance in lean type 2 diabetics, but insulin clamp studies have not been performed. Korean lean diabetic women were studied using the oral glucose tolerance test for quantifying insulin secretion and sensitivity.3 Lean elderly type 2 diabetic Korean women had impaired oral glucose-induced insulin secretion but relatively preserved insulin sensitivity with the homeostasis model assessment of insulin resistance (HOMA-IR). Thus, insulin resistance is not a necessary and essential component of type 2 diabetes in lean Korean diabetic women. Our studies in a relatively younger Southeast Asian population (Thailand) suggest similar results. Although none of the type 2 diabetics had clinical characteristics of MODY, further studies in a larger group of Thai type 2 diabetics examining role of genetic defects in β-cell function need to be performed. Also, anti-GAD antibodies need to be measured in lean Thai type 2 diabetics to determine the prevalence of LADA.
The obese type 2 diabetics had decreased insulin-stimulated glucose disposal and insulin sensitivity index as well as impaired first- and second-phase insulin response, confirming that insulin resistance and β-cell dysfunction are major contributors to the pathogenesis of hyperglycemia in obese Thai type 2 diabetics and are consistent with similar studies in obese type 2 diabetics in European and North American populations.13 –15 Furthermore, as expected, the obese Thai subjects with normal glucose tolerance had peripheral insulin resistance in combination with a compensatory hyperinsulinemia. Finally, although it has been suggested that increased visceral fat and insulin resistance are important metabolic abnormalities in Southeast Asian patients with a BMI <25.0, the results of this study underscore the importance of β-cell dysfunction in lean type 2 diabetics.
These results have important implications for national guidelines for diabetes treatment, especially in lean Southeast Asian type 2 diabetes patients who have impaired insulin secretion as a primary defect. Whereas insulin sensitizers such as metformin and thiazolidinediones are the mainstay of initial therapy in obese type 2 diabetics, insulin secretagogues as well as exogenous insulin therapy may be more appropriate for early treatment of lean Southeast Asian patients with type 2 diabetes, despite the risk of hypoglycemia. Further studies are needed to compare initial metformin therapy with insulin secretagogues/exogenous insulin in this lean type 2 diabetic population.
Footnotes
Acknowledgments
This study was supported by a grant from The Thailand Research Fund, The Endocrine Society of Thailand, and BMA Medical College and Vajira Hospital to S.S. The authors thank Prof. Boonsong Ongphiphadhanakul and Associate Professor Chittiwat Suprasongsin for their guidance and support. The skillful laboratory assistance of Sirirat Chareosap at BMA Medical College and Vajira Hospital and Aruchalean Taweewongsounton and Suwannee Chanprasertyothin at Ramathibodi Research Center are gratefully acknowledged. Finally, we acknowledge all the patients who participated in the study.