




Abstract
Background:
Previous work suggests a positive correlation between intraabdominal adipose tissue and high-sensitivity C-reactive protein (hsCRP). We sought to further explore the relationships between body fat mass/distribution and hsCRP levels in sedentary overweight and obese men and women.
Methods:
Body composition and abdominal fat areas were measured using dual-energy X-ray absorptiometry and abdominal computed tomography, respectively. Concentrations of hsCRP were measured in serum by nephelometry.
Results:
Values for hsCRP were 3.2±0.3 mg/L and 4.8±0.6 mg/L in men and women, respectively. Fat mass was nonsignificantly (P=0.09) higher in women (38.8±1.0 kg) than men (36.2±1.1 kg). Abdominal visceral adipose tissue (VAT) area was greater in men than women (104.5±5.7 vs. 59.6±4.3 cm2, P<0.001) whereas women had greater abdominal subcutaneous adipose tissue (SAT) area compared to men (334.6±11.6 vs. 285.0±13.4 cm2, P<0.01). Significant associations were present between hsCRP concentrations (natural log transformed) and total fat mass (r=0.502, P<0.01), VAT (r=0.241, P<0.05), and SAT (r=0.418, P<0.01) in men, whereas a significant association for women was found only for total fat mass (r=0.359, P<0.01). Multiple regression analyses showed that men and women had similar concentrations of hsCRP for a given age and fat mass. In both men and women, neither VAT nor SAT area independently predicted hsCRP when included individually or separately in models with age and fat mass.
Conclusions:
Results suggest that whole body fat mass, but not abdominal fat distribution, is associated with hsCRP concentrations in overweight and obese men and women.
Introduction
Concentrations of hsCRP are also positively correlated with adiposity, a relationship that is generally stronger in women than in men. 4 –6 Adipose tissue secretes a number of hormones and adipokines, such as interleukin-6 (IL-6), that may regulate the release of hepatic hsCRP. 7 Women tend to have greater overall fat mass than men, which may further explain, at least in part, the disparity in concentrations of circulating hsCRP between women and men. 8
Recent observations have suggested a positive correlation between abdominal adipose tissue distribution and hsCRP concentrations. 9 –11 Results from the Framingham Heart Study suggested that total abdominal adiposity, which includes both abdominal visceral adipose tissue (VAT) and abdominal subcutaneous adipose tissue (SAT), was more strongly associated with hsCRP in women than in men. 11 However, Cartier et al. 10 presented data suggesting that hsCRP levels were more influenced by abdominal VAT in men and SAT in women. In the present study, we aimed to assess the relationships between indices of adiposity, including fat mass and abdominal adipose tissue distribution, and hsCRP levels in overweight and obese men and women.
Experimental Methods
Study design
The data for the present investigation are from tests completed at baseline for a clinical trial. 12 Data were collected from two clinical research sites, Provident Clinical Research (Bloomington, IN) and Meridien Research (St. Petersburg, FL) under Good Clinical Practice Guidelines, the Declaration of Helsinki (2000), and the U.S. 21 Code of Federal Regulations (Part 50, Protection of Human Subjects). An institutional review board (Schulman Associates Institutional Review Board, Inc., Cincinnati, OH) approved the protocol before the initiation of the study. Informed consent was obtained from all subjects before any protocol-specific procedures were performed. Subjects were informed of their right to withdraw from the study at any time.
Subjects
Subjects included generally healthy, sedentary men and women who had been recruited for participation in a weight-loss trial. 12 Pregnant or lactating women (or those planning to become pregnant during the study) were excluded. Eligible participants were 21–65 years of age, with a waist circumference ≥87 cm (women) or ≥90 cm (men), and total cholesterol (TC) ≥200 mg/dL at screening. Participants with a body mass index (BMI) ≥40.0 kg/m2 or <25.0 kg/m2; recent weight loss of more than 4.5 kg; recent use of any weight loss medications, supplements, or programs; a history of weight-reducing surgery; or an eating disorder were excluded.
Measures of body composition, cardiorespiratory fitness, and physical activity
Waist circumference was determined on a horizontal plane at the level of the iliac crest using a nonstretch anthropometric tape at the end of a normal expiration. 13 Whole-body dual-energy X-ray absorptiometry (DXA) scans were performed with the GE Healthcare LUNAR (Madison, WI). Fat mass and fat-free mass were determined utilizing Prodigy Advance DXA System software, version 9.30 (Bloomington, IN) and version 9.0 (St. Petersburg, FL). Abdominal computed tomography (CT) scans were performed at the Bloomington site on a Seimens Somatom® (Malvern, PA) and at the St. Petersburg site on a Highspeed GE spiral (Madison, WI). Three-slice abdominal CT scans were taken at the level of the lumbar 4–5 vertebrae using a slice thickness of ≤7 mm. The measurement protocol and central reading of the CT scan data were completed by Bio-Imaging Technologies, Inc. (Newtown, PA) using a standard protocol as described elsewhere. 14
Maximal treadmill exercise testing using the United States Air Force protocol was completed as described elsewhere. 15 Time to volitional exhaustion was used as an indicator of cardiorespiratory fitness/exercise capacity. A physical activity score was calculated as described by Sallis et al. 16 from the Stanford 7-day physical activity recall questionnaire.
Laboratory measurements
Biochemical measurements were conducted by Medpace Reference Laboratories (Cincinnati, OH). Serum lipids were analyzed according to the Standardization Program of the Centers for Disease Control and Prevention and the National Heart, Lung and Blood Institute. Serum TC and triglyceride (TG) concentrations were measured using Roche reagents on a Roche Modular instrument. Serum high-density lipoprotein cholesterol (HDL-C) was measured by photometry after precipitation of apolipoprotein B–containing lipoproteins with Mg-dextran sulfate. The serum low-density lipoprotein cholesterol (LDL-C) concentration in mmol/L was calculated according to the Friedewald equation 17 as follows: LDL-C−TC−HDL-C−TG/2.2. LDL-C was not calculated when the TG concentration was >4.5 mmol/L. Fasting insulin was measured by chemiluminescence on a Roche Elecsys, and fasting glucose was measured using photometry on a Roche Modular instrument. Plasma hsCRP was measured on a Siemens Medical Solutions BN II nephelometer (Deerfield, IL).
Statistical analyses
Statistical analyses were conducted using SAS version 9.1.3 (Cary, NC). All tests for significance were performed at alpha=0.05, two-sided. The normality assumption for each variable was evaluated by using the Shapiro–Wilk test, and logarithmic transformations were performed if necessary. For categorical variables, differences between sexes were evaluated using chi-squared tests. Associations between variables were measured using Pearson correlation coefficients. Backward, stepwise multivariate linear modeling was used to investigate the relationships between measures of adiposity, physical activity, and logarithmically transformed (base e) hsCRP concentrations in the entire sample and for men and women separately. Sensitivity analyses were performed to assess potential confounding or effect modification by BMI category (overweight=0, obese=1) in the multivariate linear regression models. Subgroup analyses were also performed in which the relationships between body composition and abdominal fat distribution variables were assessed in those with BMI 25.0–25.9 and ≥30.0 kg/m2, respectively.
Results
Anthropometric and laboratory characteristics of the study sample are presented in Table 1. Compared to women, men had higher values for body weight, BMI, waist circumference, physical activity score, exercise capacity, triglycerides, TC:HDL-C, insulin, and glucose. Women were older and had higher concentrations of HDL-C. There were no differences between men and women in total fat mass or total abdominal fat area; however, men had greater abdominal VAT, whereas women had more abdominal SAT.
SEM, standard error of the mean; BMI, body mass index; hsCRP, high-sensitivity C-reactive protein; TC, total cholesterol; LDL-C, low-density lipoprotein cholesterol; HDL-C, high-density lipoprotein cholesterol; MET, metabolic equivalent.
The relationships between total fat mass, total abdominal fat area, VAT, and SAT, with hsCRP concentration (loge transformed) are shown in Fig. 1. In women, a significant association was observed between total fat mass and plasma hsCRP (r=0.359, P=0.004). In men, significant associations were present between total fat mass (r=0.502, P<0.001), total abdominal fat area (r=0.445, P<0.001), SAT (r=0.418, P<0.001), and VAT (r=0.241, P<0.05).
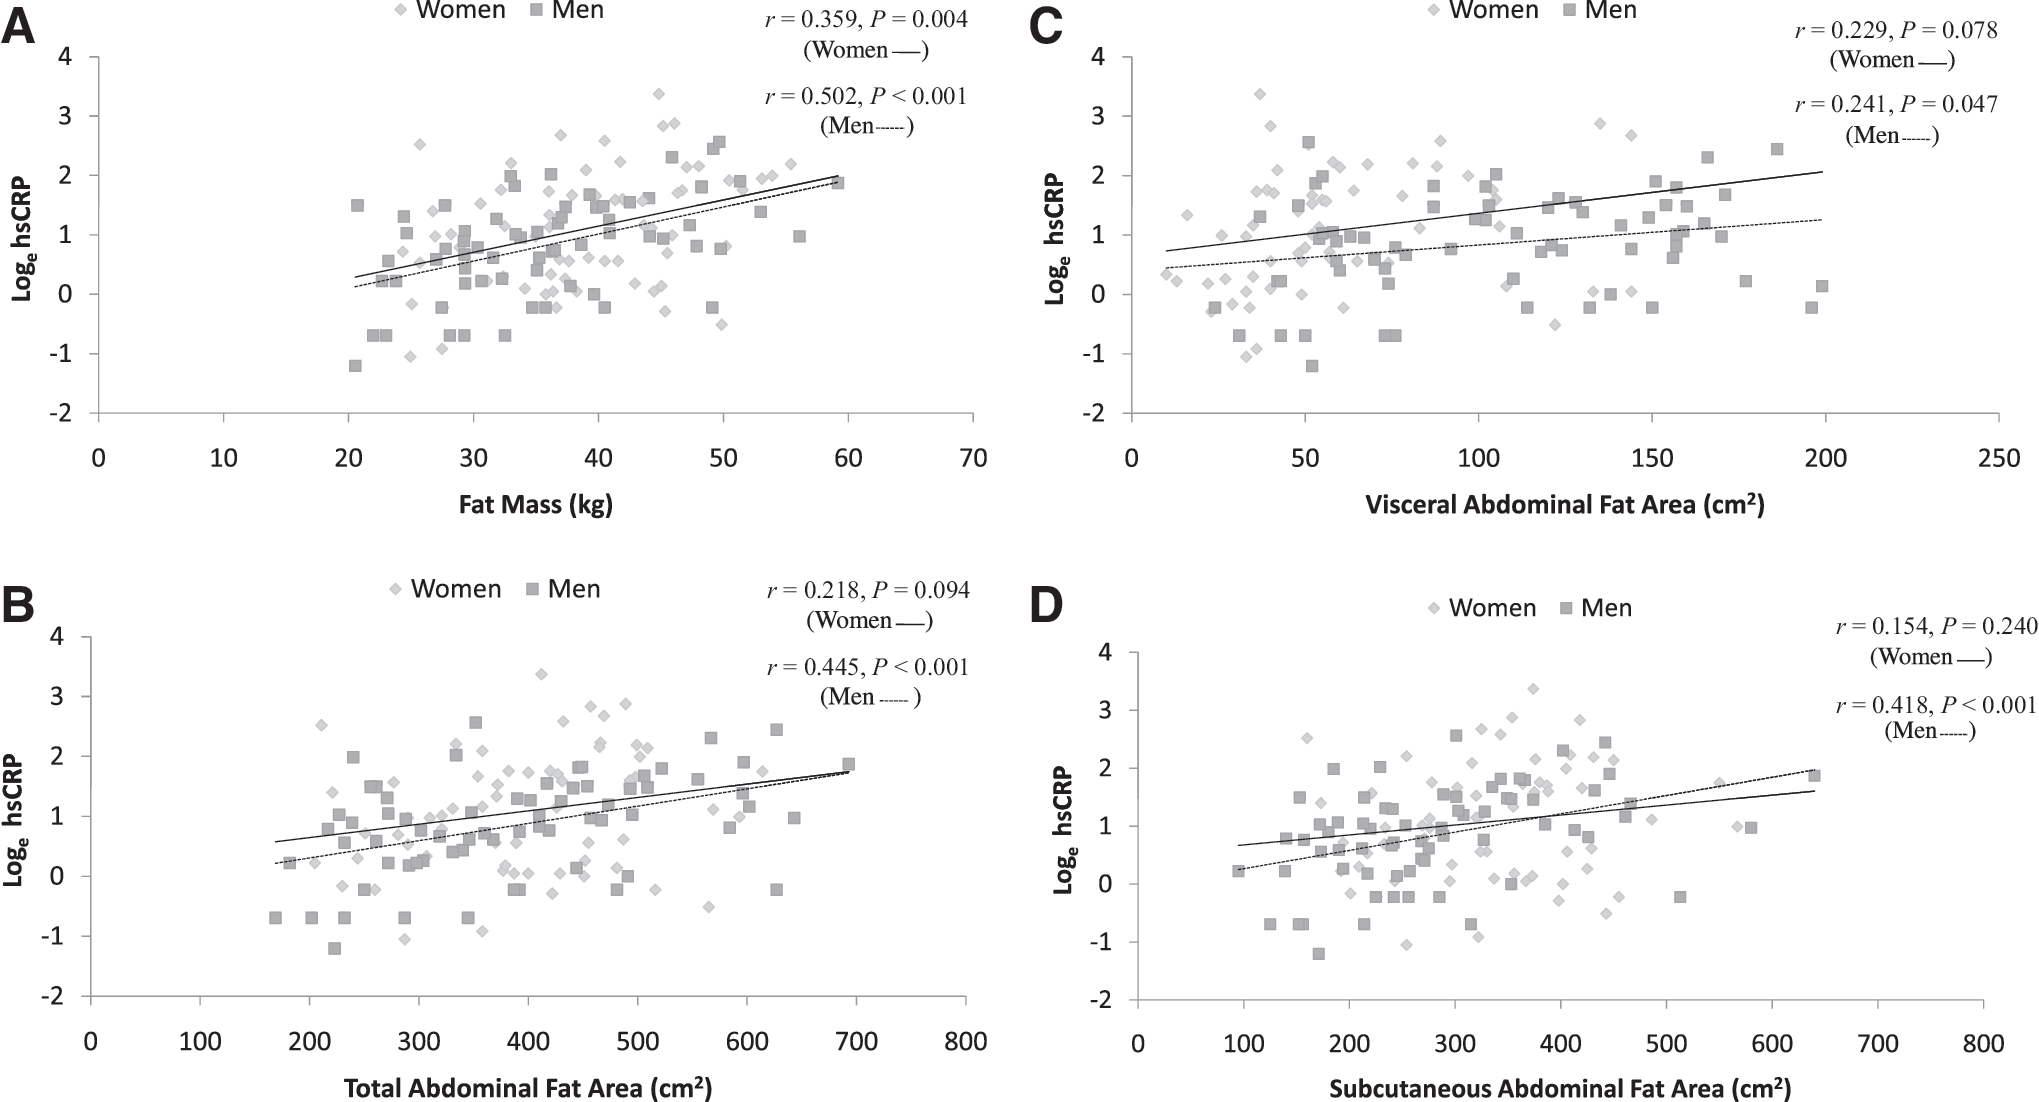
Relationship between loge high-sensitivity C-reactive protein (hsCRP) and whole-body fat mass
Pearson correlation coefficients for the relationships between loge hsCRP and other variables are shown in Table 2. In men, plasma hsCRP was positively correlated with BMI (r=0.399, P<0.001) and waist circumference (r=0.388, P<0.01), and inversely correlated with age (r=−0.247, P<0.05). In women, significant positive relationships were present between hsCRP and BMI (r=0.386, p<0.01), waist circumference (r=0.335, p<0.01), and TG (r=0.281, P<0.05).
hsCRP, high-sensitivity C-reactive protein; BMI, body mass index; TC, total cholesterol; LDL-C, low-density lipoprotein cholesterol; HDL, high-density lipoprotein cholesterol.
Table 3 shows results from selected multiple regression models. In model 1, age, sex, total fat mass, VAT, and SAT were included as independent variables. Age (P<0.05), sex (P<0.05), and fat mass (P=0.002) were the only variables significantly and independently associated with loge hsCRP. In model 2, age, sex, fat mass, and VAT were included as independent variables. As in model 1, only age (P<0.05), sex (P<0.05), and fat mass (P<0.001) were independently associated with hsCRP. This model was then reduced (model 3) to include only, age, sex, and fat mass as independent variables. Only fat mass maintained significance (P<0.001), although the P value for age neared statistical significance (P=0.056). Models run separately for men and women specifically also showed that neither VAT nor SAT was an independent predictor of loge hsCRP concentration after adjustment for age and fat mass (data not shown). Adding treadmill time as an indicator of cardiorespiratory fitness, or physical activity score, did not materially alter the relationships between measures of body fat or fat distribution and loge hsCRP concentration overall or in sex-specific models. Sensitivity analyses showed no evidence of material confounding or effect modification by BMI category (data not shown).
hsCRP, high-sensitivity C-reactive protein; VAT, visceral adipose tissue; SAT, subcutaneous adipose tissue.
Discussion
The results of the present study indicate that whole body fat mass was directly associated with hsCRP concentrations in this sample of overweight and obese men and women. In addition, for given levels of age and fat mass, men and women had similar concentrations of hsCRP, despite differences in abdominal fat distribution. Accordingly, these results support the conclusion that fat mass is a more important predictor of hsCRP concentration than abdominal adipose tissue distribution for both men and women.
These results are in agreement with those from previous investigations showing a strong positive correlation between total adiposity and hsCRP levels. 4 –6,18 Adipose tissue is an endocrine organ that secretes several hormones and other substances that affect systemic inflammation, including IL-6, tumor necrosis factor-α (TNF-α), and adiponectin. 19 These substances, particularly IL-6, stimulate hepatic synthesis and secretion of other markers of inflammation, including hsCRP. Larger, more lipid-filled fat cells appear to release greater quantities of these substances, leading to enhanced hsCRP secretion. 20
Results from some investigations have suggested that abdominal adiposity, and in particular VAT, is a stronger predictor of hsCRP concentrations than total adiposity in men and/or women. 8,11,21 There is evidence that VAT produces more proinflammatory cytokines, such as TNF-α and IL-6, and less adiponectin, than SAT. 22 As such, it is plausible that increasing levels of VAT would result in higher levels of hsCRP. 7 This has been hypothesized to explain, at least in part, the stronger associations between VAT and accelerated atherosclerosis and insulin resistance than with gluteal–femoral adipose tissue. 23
However, our results do not support abdominal fat distribution as an important determinant of sex differences in hsCRP concentrations. In the present study, total fat mass showed the strongest association with hsCRP levels in both men and women, and VAT area was not an independent predictor of hsCRP concentration after adjustment for age and fat mass. Moreover, for given levels of age and fat mass, men and women had similar levels of hsCRP, despite substantial differences in distribution of abdominal fat between abdominal VAT and SAT depots. It is not entirely clear why the present results differ from those of some other investigations. Subjects in the present study were all overweight or obese and sedentary. It is possible that the entry criteria for the study (a weight-loss trial) resulted in a restriction of the range of values for VAT and physical activity, which could have obscured the relationship between VAT area and hsCRP concentration. However, given that the values for VAT ranged from just below 100 cm2 to just above 600 cm2, the authors believe this to be unlikely. Moreover, 12 weeks of exercise training did not significantly alter the hsCRP concentration, 12 so it also appears unlikely that physical activity was a confounding factor.
The effects of age and sex were both nonsignificant after adjustment for fat mass, although the term for age had marginal significance (P=0.056). Interestingly, the slope for age was negative. Thus, these results are consistent with the possibility that the positive relationship between age and hsCRP may be secondary to age-associated increases in fat mass. Additional research will be required to assess this possibility.
There are several limitations of the current study. Because this was a cross-sectional investigation, causality and directionality of the relationships observed cannot be ascertained. Furthermore, the subjects in the present study were all overweight or obese, mainly of non-Hispanic white race/ethnicity, less than 66 years of age, and willing to volunteer for a weight-loss trial. Thus, the generalizability of these findings to other groups is uncertain. Finally, no markers of inflammation other than hsCRP were evaluated. However, hsCRP is the most commonly measured inflammatory marker in clinical practice and has been judged to have the greatest potential for use in cardiovascular disease risk stratification. 24 Cartier et al. reported similar associations for IL-6 and hsCRP with fat mass, which is consistent with the hypothesis that IL-6 may be involved in the physiologic link between circulating hsCRP concentration and whole body fat mass. 10
Conclusion
In conclusion, the results of this investigation suggest that whole body fat mass, but not abdominal fat distribution, is associated with hsCRP concentrations in overweight and obese men and women.
Footnotes
Author Disclosure Statement
K.C. Maki, T.M. Rains, M. Reeves, M. Bell, and M. Farmer received a research grant from Kao Corporation to conduct the original clinical study upon which these results are based. K. Yasunaga is an employee of Kao Corporation.