
Abstract
Background:
Adiponectin is a plasma protein produced by the adipose tissue, with insulin sensibility, antiinflammatory and antiatherogenic properties. Many adiponectin gene polymorphisms have been described, and their implication in obesity, metabolic syndrome, and cardiovascular diseases was controversial. Our aim was to study the relationship between eight adiponectin polymorphisms (−1391G/A, −1377C/G, 4522C/T, 395 G/A, 276G/T, 639C/T, 45T/G, and +2019delA), metabolic syndrome parameters, and the risk of obesity in Tunisian volunteers.
Methods:
We have recruited 169 nonobese [sex ratio=0.594, mean age 43.25±13.12 years; mean body mass index (BMI) 24.73±3.50 kg/m2] and 160 obese (BMI≥30 kg/m2) (sex ratio=0.221, mean age 48.41±10.92 years; mean BMI 36.6±4.8 kg/m2). Genotyping was performed using polymerase chain reaction restriction fragment length polymorphism (PCR-RFLP). Glucose, insulin, and lipids were measured. BMI and homeostasis model assessment of insulin resistance (HOMA-IR) were calculated.
Results:
The polymorphisms 276G/T, 639 C/T, 11391 G/A, 11374C/G, and +2019delA seem to contribute to obesity. In fact, adjusted odds ratios (ORs) of obesity associated with mutated genotypes of each polymorphism were, respectively: OR=0.64, P=0.039; OR=1.85, P=0.018; OR=1.68, P=0.044; OR=1.77, P=0.038; and OR=1.94, P=0.010). Mutated genotypes at 639 C/T were associated with higher waist circumference, BMI, and systolic and diastolic blood pressure. In addition, the 11391AA genotype was associated with increased BMI. Concerning 2019delA, the delAdelA genotype was associated with increased HOMA-IR and BMI, suggesting a possible effect of these single-nucleotide polymorphisms (SNPs) on insulin resistance parameters. Mutated genotypes at 276G/T were associated with lower serum insulin concentration and lower systolic and diastolic blood pressure. The other genotypes showed no association with metabolic syndrome parameters.
Conclusion:
Adiponectin gene polymorphisms were associated with obesity and metabolic syndrome parameters in Tunisian volunteers.
Introduction
The ACDC gene was identified through a systemic survey of active genes in adipose tissue using complementary DNA sequencing; it spans 16 kb and three exons. 5 Epidemiological studies have indicated that single-nucleotide polymorphisms (SNPs) and some haplotypes present in the ACDC gene, including the promoter region, are associated with obesity, as well as with T2D, metabolic syndrome, and CAD in some populations, but the results were controversial. 6,7,10 –17 The linkage disequilibrium (LD) of the ADIPOQ gene is moderate, but there are two small LD blocks, one including SNPs in the promoter region and another one spanning the boundary of exon 2–intron 2. 11 The reasons for partially discrepant results are unknown and may result from the different genetic background and environmental factors in different ethnic populations.
To our knowledge, no adiponectin polymorphisms study has been performed in Tunisians. On the basis of the conflicting results of adiponectin polymorphisms association with obesity and metabolic syndrome according to the populations studied, we aimed to study the relationship between adiponectin genetics variability and obesity in Tunisian volunteers.
Materials and Methods
Study subjects
This study was performed on two groups. One group was composed of 160 Tunisian unrelated obese subjects, on the basis of body mass index (BMI, kg/m2) ≥30 kg/m2, who were volunteers from external consultations from Sahloul University Hospital (Sousse, Tunisia). The mean age was 48.41±10.92 years and their mean BMI was 36.6±4.8 kg/m2. The second group was composed of 169 nonobese, unrelated subjects, who were volunteer personnel from the Sahloul University Hospital (mean age 43.25±13.12 years; mean BMI 24.73±3.50 lg/m2). In the two groups, we excluded patients taking lipid-lowering drugs and all subjects having a renal, hepatic pathology or/and dysthyroidia. All of the study participants were individually interviewed using a structured questionnaire for information on sociodemographic characteristics, details of personal history, presence of diseases, drug intake if any, and smoking habits. The participants underwent physical examinations and laboratory tests. The examiners undertook training in the questionnaire collections and measures.
The study was approved by the Medical Hospital Ethic Committee and informed consent was obtained from all study subjects.
Anthropometric parameters and blood pressure measurements
Weight and height were measured while the subjects were barefooted and lightly clothed. BMI was calculated as body weight (kg)/height 2 (m2) and obesity was defined as BMI ≥30 kg/m2. 18 Waist circumference was measured by a trained examiner from the narrowest point between the lower borders of the rib cage and the iliac crest.
Blood pressure was read three times from the left arm of seated subjects with a blood pressure monitor after 20 min of rest. The average of the two last measurements was recorded for each subject.
Biochemical measurements
Blood samples were collected from subjects after a 12-h overnight fast. Serum total cholesterol (TC) and triglycerides (TG) were determined by standard assays. High-density lipoprotein cholesterol (HDL-C) was measured by direct assay. Low-density lipoprotein cholesterol (LDL-C) concentrations were calculated with the Friedwald formula 19 if TG was <4 mmol/L. If not, LDL-C concentrations were measured by direct assay. Fasting glucose was measured by the glucose oxidase method. All biochemical parameters were performed on a Synchron CX7 Clinical System (Beckman, Fullerton, CA). Insulin concentration was measured by microparticule immunoassay (MEIA) on an AxSym® Abbott Chemistry Analyzer (Abbott laboratories, Abbott Park, IL). Insulin resistance (IR) was evaluated with the homeostasis model assessment (HOMA) using the following equation: HOMA-IR={(Fasting insulin (μU/mL)×Fasting glucose (mmoL/L)}/22.5. 20
Definitions of risk factors
Diabetes mellitus was defined as fasting glucose more than 7 mmol/L or currently receiving antidiabetic medication. 21 Hypertension (HTA) was defined as greater than 140/90 mmHg or currently using antihypertensive medication. 22 Dyslipidemia was defined as a LDL-C concentration ≥4.1 mmoL/L and or a HDL-C concentration ≤1 mmoL/L and or a triglyceride concentration ≥1.71 mmoL/L. 23 Metabolic syndrome was defined according to the International Diabetes Federation definition 2005. 24
DNA analysis
Genomic DNA was isolated from peripheral blood leukocytes by the salting out method. 25 The genotypes for each adiponectin polymorphism −11391G/A and −11377C/G [promoter], 4522C/T and 395 G/A (intron 1), 276G/T and 639C/T (intron 2), 45T/G (exon 2 coding synonymous) and +2019delA [3′-untranslated region (UTR)] were determined by polymerase chain reaction restriction fragment length polymorphism (PCR-RFLP), as described by Kyriakou et al. 26 PCR products and the digest product were resolved by 2% agarose gel electrophoresis and visualized by ethidium bromide staining.
Statistical analysis
Statistical analyses were performed using SPSS 17.0. The biological parameters values were reported as means±standard deviation (SD) and were compared by the Student t-test. Categorical variables were analyzed by the chi-squared test or by the Fisher exact test for small numbers. We used the SNPAnalyzer2 program to test genotype frequencies for Hardy–Weinberg equilibrium, to assess LD between SNPs by calculating the disequilibrium expressed as D′, 27 and to determine haplotype frequencies. Odds ratios (ORs), two-tailed P values, and 95% confidence intervals (CI) were calculated as a measure of the association of the SNPs with the presence of obesity. ORs were adjusted to confounders parameters (all parameters that show a P<0.25 between the two groups) by logistic binary regression. For the other comparison (Student, Fisher exact and chi-squared test), no correction for multiple testing was made. A P value of <0.05 was considered statistically significant for all tests.
Results
Patient characteristics
The clinical and biological characteristics of these subjects are summarized in Table 1. There were no significant differences in dyslipidemia frequency and LDL-C concentrations between the two groups. The prevalence of HTA, diabetes, metabolic syndrome, and personal cardiovascular disease history were higher in obese than in the nonobese group (P<0.001). Compared with nonobese subjects, the obese subjects had higher weight, waist circumference, TG, TC, HOMA-IR, and insulin levels, but lower HDL-C concentration.
Mean±standard deviation or n (%).
BMI, body mass index; HOMA-IR, homeostasis model assessment of insulin resistance; TC, total cholesterol; TG, triglyceride; HDL, high-density lipoprotein; LDL, low-density lipoprotein.
Genotype frequencies
Genotype distributions for different SNPs were in Hardy–Weinberg equilibrium in obese and nonobese groups. The frequencies of the 639 C/T, 11391G/A, 11374C/G, and +2019delA genotypes differed significantly between the two groups. The results were not statistically significant for the other examined polymorphisms (P>0.05) (Table 2).
Differences for each genotypes between obese and nonobese.
P value using a test of additivity.
ADIPOQ gene SNPs association with clinical and metabolic parameters
The clinical and metabolic characteristics were analyzed according different genotypes (Table 3). No association was found with the 45T/G, 4522C/T, 395G/A, and 11374C/G SNPs, whereas mutated genotypes at 276G/T were associated with lower serum insulin concentration (P=0.011) and lower systolic and diastolic blood pressure. Mutated genotypes at 639C/T were associated with higher waist circumference, BMI, and systolic and diastolic blood pressure. Furthermore, the 11391AA genotype was associated with increased BMI. Concerning 2019delA, the delAdelA genotype was associated with increased HOMA-IR and BMI, suggesting a possible effect of this SNP on IR parameters.
TC, total cholesterol; TG, triglyceride; HDL, high-density lipoprotein; LDL, low-density lipoprotein; HOMA-IR, homeostasis model assessment of insulin resistance; WC, waist circumference; BMI, body mass index; SBP, systolic blood pressure; DBP, diastolic blood pressure. Means±standard deviation and P values in bold indicate significant results.
Associations between AdipoQ genotypes and the risk of obesity
After adjustment for confounding parameters (age, gender, smoking status, HTA, diabetes, dyslipidemia, and CAD), the OR of obesity associated with mutated genotypes at 639TT, 11391AA, 11374GG, and 2019delA delA compared to normal genotype was (1.85, P=0.018; 1.68, P=0.044; 1.77, P=0.038; and 1.94, P=0.010, respectively). We also noted that the TT genotype at 276 GT was associated with a lower risk of obesity OR=0.64, P=0.039. (Table 4).
OR, adjusted odds ratio; CI, confidential interval. Significant P are in bold.
Linkage disequilibrium and haplotypes frequencies distribution
The LD test (Fig. 1) showed that SNP 45T/G was linked to 4522CT, 639T/C, and 395 G/A. 276 G/T was linked to 639C/T, 11391G/A, and 2019delA. 4522C/T was highly linked to 639T/C and 11374 CG. 639TC was linked to 395 G/A, 11391G/A, and 11374C/G. 395 G/A was linked to 11391G/A.
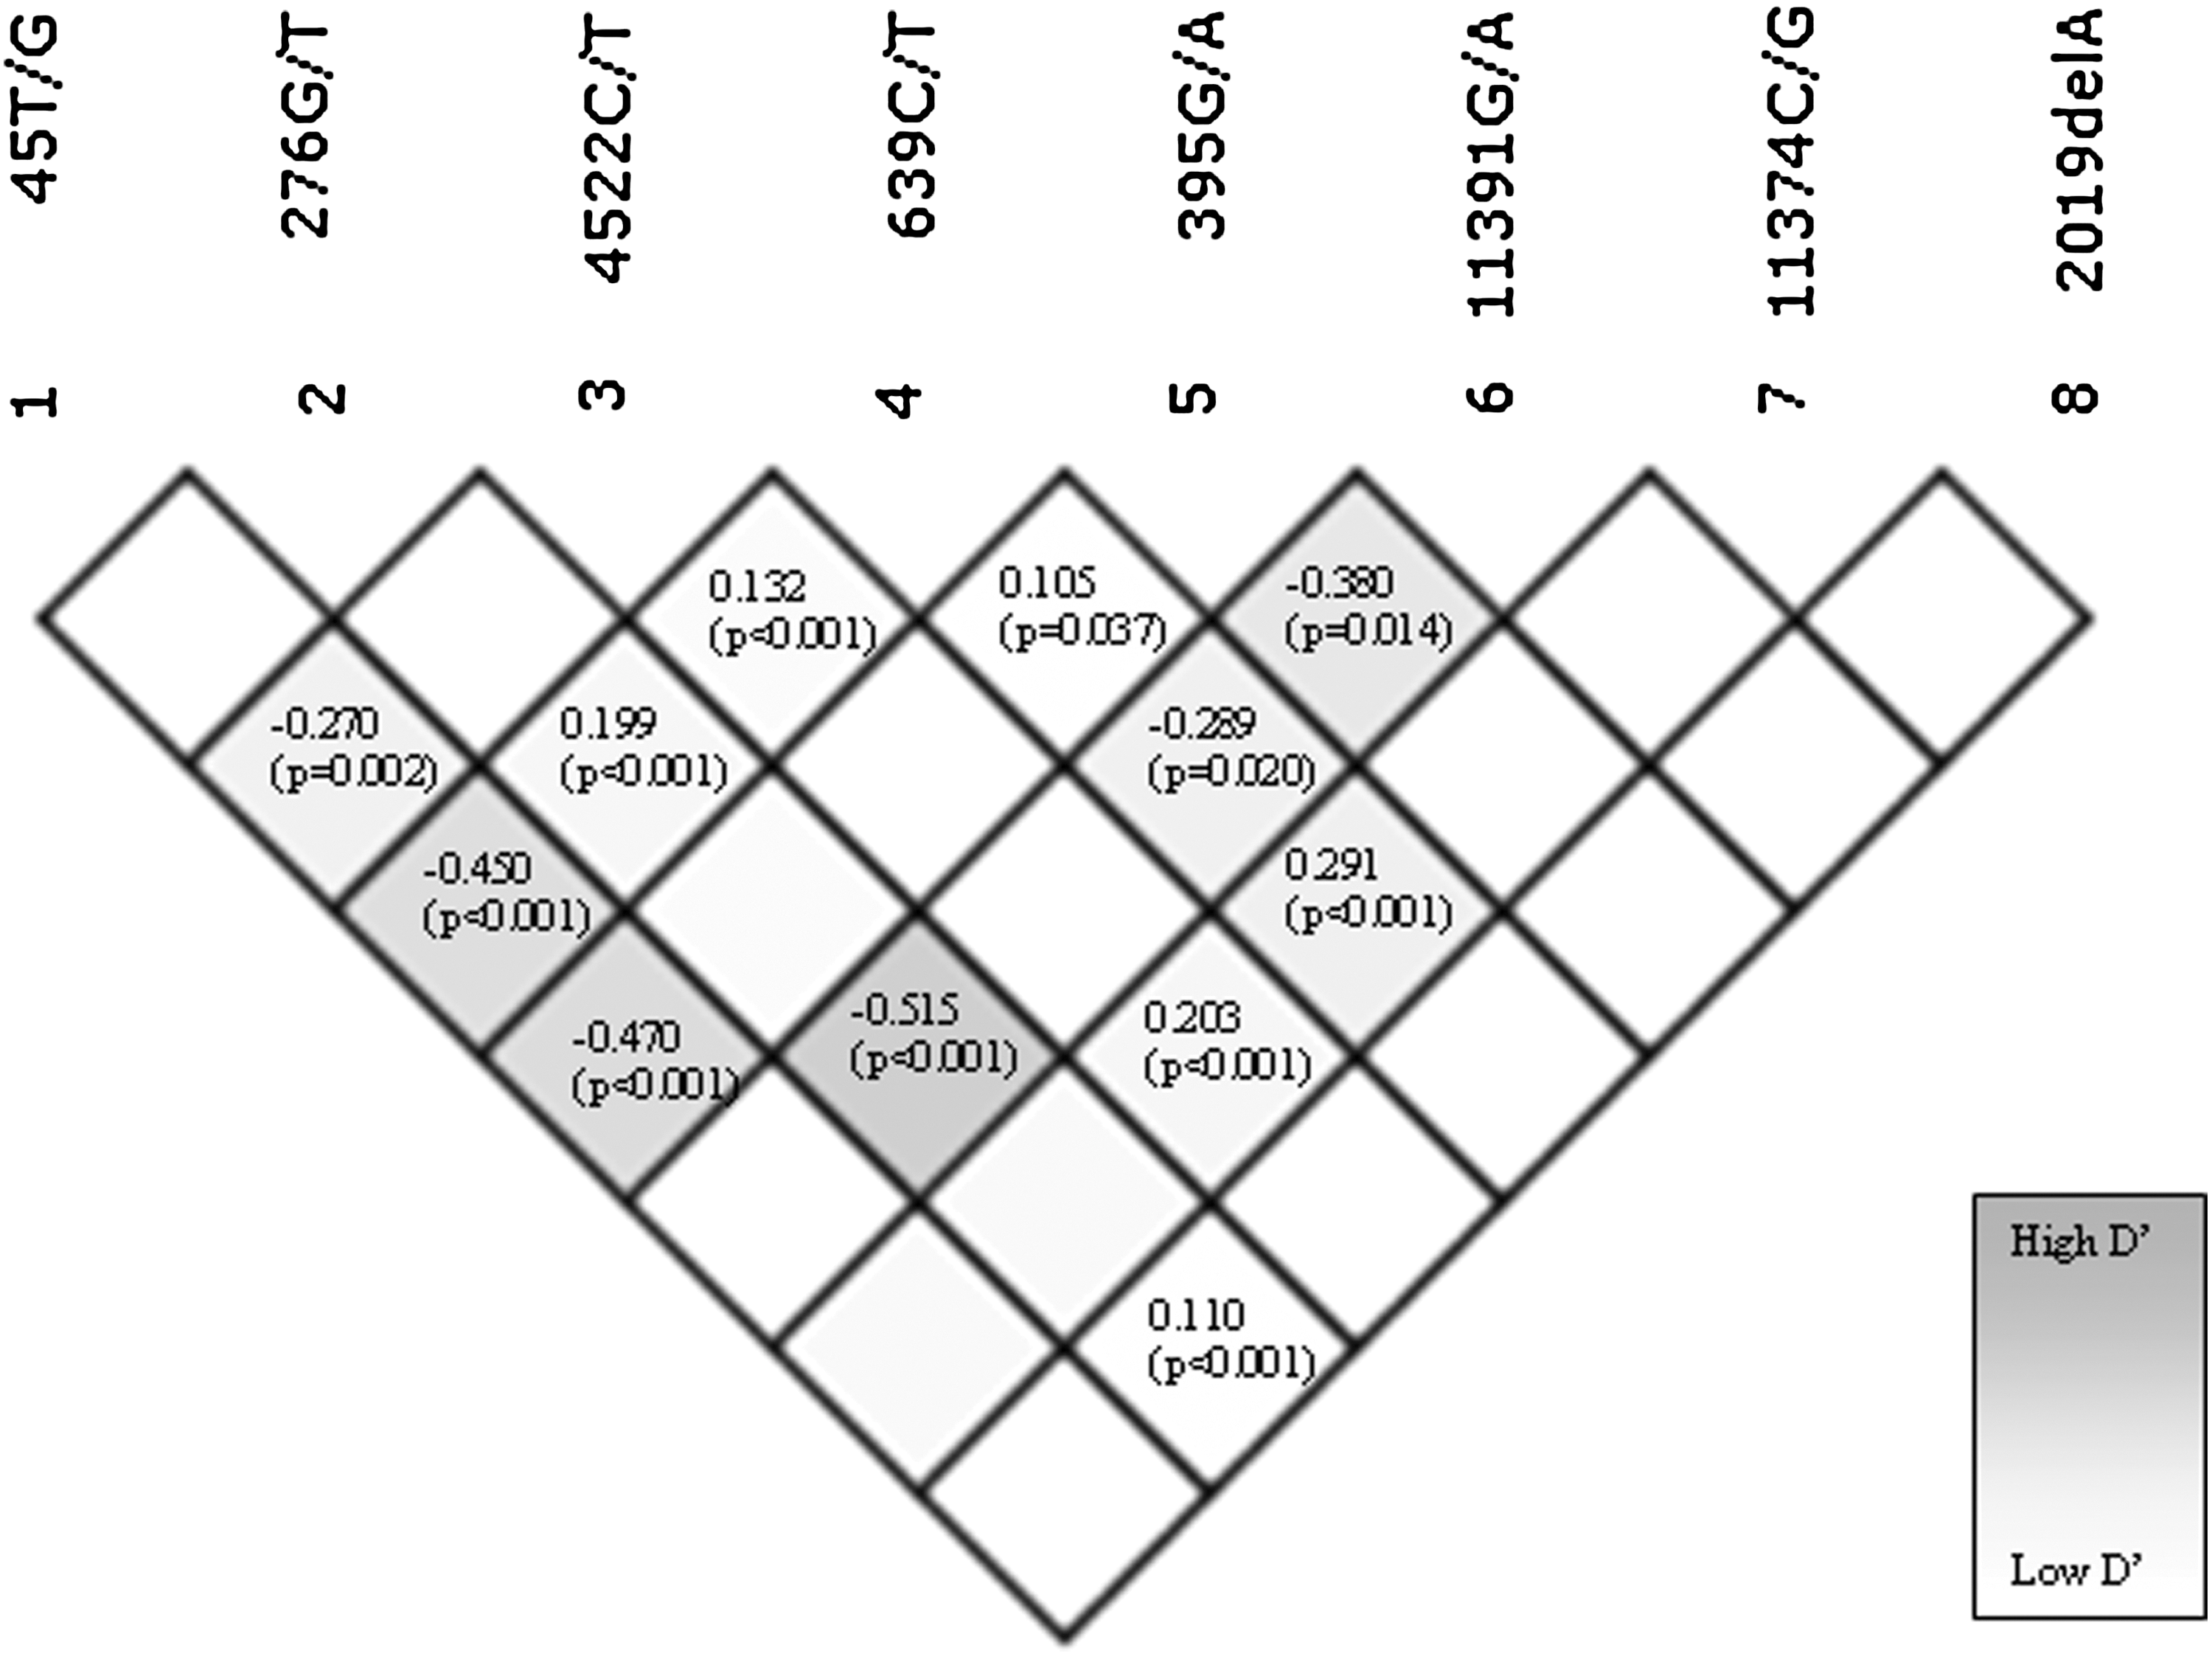
Pairwise linkage disequilibrium (LD) between the eight single-nucleotide polymorphisms (SNPs) examined in the present study. Disequilibrium statistics reported as exact value of D′ ranging from −1 to +1 and (P) value. The shading also indicates the degree of LD between SNPs.
For haplotype analysis, we performed stratification according obesity and compared the haplotype frequencies in obese and nonobese groups. SNPAnalyzer2 showed 84 haplotypes in our study population. The haplotype containing the eight wild genotypes TGCCGGCinsA was more frequent in nonobese than in obese group (P<0.0001). The haplotype model X/X/X/X/X/G/C/insA possessing X,X,X,X,X,11391G, 11374C, and +2019insA seems to be protective. In fact, it occurred more frequently in nonobese than in obese groups. The haplotype model X/T/X/C/X/G/C/insA possessing X, 276T, X, 639T, X, 11391G, 11374C, and +2019insA seems to be the most protective (P<0.0001).
Discussion
The increasing prevalence of obesity and metabolic syndrome has attracted considerable interest because both represent risk factors for cardiovascular and other degenerative diseases, actually the most important causes of morbidity and mortality in developed and in developing countries. 28 Different evidence suggests that ACRP30 possesses antihyperglycemic, antiatherogenic, and antiinflammatory properties, so it can be speculated that low adiponectin levels might be considered an early marker of metabolic risk in obesity. 6,29 Furthermore, genetic polymorphisms have been considered repeatedly as a predisposing genetic background to develop obesity and its complications. Several common SNPs have been identified in the whole ACDC gene (promoter, intron, and coding sequence) in different populations. 11,17,30 –32 Today, obesity is associated with high premature mortality and represents a major public health problem. 28,33
We investigated this gene on the basis of pathophysiological premises and by comparing results of earlier reported association studies. We showed significant association between mutated genotypes at 276G/T, 639C/T, 11391G/A, and +2049delA SNPs and metabolic syndrome parameters. Despite our relatively small number of subjects, our results confirmed previously reported associations of metabolic syndrome parameters with 276 T, 14,15,30,34 11391A, 35,36 +2019delA 12 and found a new association with 639T. This association has not been reported by Hivert et al. 37
The mechanisms explaining the association between adiponectin polymorphisms and metabolic syndrome parameters are still unclear in humans, but animal models have shown that adiponectin is a potent insulin enhancer, regulating energy homeostasis and glucose tolerance. 38,39 Mice fed a high-fat diet experienced profound weight loss when chronically treated with a proteolytic fragment of adiponectin. 39
We also examined the possible association of the adiponectin gene variation to obesity. We noted that AA genotype at 11391, GG genotype at 11374, and delAdelA genotype at +2019 polymorphisms as risk genotypes with regard to obesity after adjustment to confounders parameters. Vasseur et al. 17 have reported that SNP 11377 and SNP 11391 were significantly associated with hypoadiponectinemia and T2D. A study including more than 2,500 French Caucasian subjects revealed that 11374C was associated with severe childhood and adult obesity. 40
Our results suggest a protective role of the 276 GT SNP in obesity risk. The same results have been reported by Menzaghi et al. 15 and Stumvoll et al., 41 but Fillipi et al. 34 reported that the T allele is associated with IR and obesity risk. This discrepancy might be partly due to the ethnic specificity, the difference in the entry criteria of subjects, or the limited number of subjects. It is difficult to assess by only genetic studies exactly which SNP is involved, especially when a gene is very polymorphic with several SNPs in LD.
In addition to genetic studies, functional studies have been performed by other investigators to explore the biological role of sequence differences in the adiponectin gene. For example, it was shown that a deletion of the human promoter region where 11391G/A was located increased its transcriptional activity. 42 An in vitro study of SNP 276G/T showed no difference between alleles in the binding with adipocyte nuclear factors. 40 Thus, 276G/T could possibly be just a marker in LD with a yet unidentified functional variant, which could be specific for the population. Of note, we found that SNP 276G/T was in LD (P<0.001) with 11391G/A placed in the promoter region and affected the promoter activity and with +2019delA placed in the 3′-UTR, a region known for playing a pivotal role in the control of gene expression by binding proteins that regulate mRNA processing, translation, or degradation. In this gene, a [tcctgc] nucleotide sequence next position 11,374, was similar to an enhancer element in the epidermal growth factor receptor (EGFR) gene, and perhaps it could indirectly explain the association of 11374CG with decreased adiponectin levels and T2D. 43
In our haplotype analysis, X/T/X/C/X/G/C/insA seems to be the most protective; it occurred more frequently in the nonobese than in the obese group (P<0.0001). Vasseur et al. reported that a haplotype containing a G allele at 11,391 and 11,374 was associated with low plasma adiponectin levels and T2D risk; they explained this association by the presence of a polymorphic regulatory element. 17 In addition, Gu et al. 11 reported that the haplotype composed by SNPs in the promoter (such as 11391G/A, 11374C/G) and intron 2 (such as 276G/T, 639C/T) regions in the ADIPOQ gene plays a functional role on the regulation of adiponectin. Our results seem to confirm this report.
Our study has some limitations. The first is that the serum adiponectin level was not measured and thus the pathophysiologic mechanism underling the association could not be further dissected, but it was reported that serum adiponectin levels do not necessarily reflect adiponectin concentration in adipose tissue. The second limitation is the small size of study population.
In summary, in this first association study of the adiponectin gene in Tunisian volunteers. We showed that mutated genotypes 276TT, 639TT, 11391AA, 11374GG, and 2019delA delA compared to the normal genotype was associated with obesity risk. In addition, 276 G/T, 639C/T, 11391G/A, and +2019delA SNPs were associated with metabolic syndrome parameters. Further studies with more comprehensive and informative genetic markers are warranted to explore the genetic effects of ADIPOQ on obesity, IR, metabolic syndrome, and cardiovascular diseases in our cohorts and other populations.
Footnotes
Acknowledgments
This study was supported by grants from the Tunisian Ministry of Higher Education, Scientific Research and Technology and the Tunisian Ministry of Health (UR 28/04); without their extremely generous and strong support, this study could not have been undertaken. We are especially grateful to the study participants. We acknowledge the general director of Sahloul University Hospital and the excellent technical assistance of members of the Biochemistry Department of Sahloul University Hospital.
Author Disclosure Statement
The authors report no conflicts of interest.