
Abstract
Objective:
The aim of this study was to determine if an increasing number of traits of metabolic syndrome was associated with an increased severity of each of the traits.
Methods:
A cohort of otherwise healthy 387 Latin-American subjects was evaluated for traits of metabolic syndrome according to National Cholesterol Education Program Adult Treatment Panel III (NECP ATP III) guidelines. Waist cricumference and triglyceride, high-density lipoprotein cholesterol (HDL-C), and blood pressure (BP) levels were measured. Glucose and insulin levels were obtained after 75 g of oral glucose.
Results:
The prevalence of subjects with no traits and 1, 2, 3, and 4–5 traits was 10.1%, 27.1%, 36.7%, 20.9%, and 5.1%, respectively. Low HDL-C accounted for 55.2% and larger waist circumference for 30.5% of all cases with one trait. High BP and high glucose contributed mainly as the 4th or 5th trait. Higher values for obesity, abdominal obesity, dyslipidemia, BP, hyperglycemia, and hyperinsulinemia were observed as the number of traits increased from 0 to 4–5 traits. More traits meant more severe traits, even after adjusting by age. Subjects with metabolic syndrome but with 4–5 traits had a much higher risk load than those with 3 traits, due to more traits and more severe traits.
Conclusions:
We found that with an increasing number of traits of the metabolic syndrome that the severity of each trait increased. A gradual increase in risk load defined by trait clustering and severity was observed when moving from no traits to fully blown metabolic syndrome. Such a continuum of risk was also observed among subjects with metabolic syndrome, implying that subjects diagnosed with the syndrome may be at quite different risk load.
Introduction
Despite its extensive use, the diagnosis and clinical use of metabolic syndrome has been challenged. Instead, attention to each of the metabolic and cardiovascular risk factors has been proposed. 13 We propose that this may result, in part, from the fact that diagnosis of metabolic syndrome is based solely on number of traits and not on the severity of individual traits. Additionally, diagnosis of metabolic syndrome may mislead subject's management by failing to account that subjects with metabolic syndrome may be at quite different level of risk. In support of this view, is the finding that BP and fasting glucose levels are better predictors of cardiovascular mortality in older adults than the actual presence of metabolic syndrome. 14
In this study, we determined if an increasing number of metabolic syndrome traits was associated with an increased severity of each of the traits. Specifically, we determined if subjects with more traits had also higher values for weight, girth, triglycerides, and BP, as well as greater glucose and insulin abnormalities, and lower HDL-C levels, than those with fewer traits. This investigation allowed us to test whether presence of metabolic syndrome represents an all-or-none risk load or if there is a continuum of risk load as we moved from no traits to the fully blown metabolic syndrome. The study was conducted in a cohort of otherwise healthy Latin-American individuals screened for presence and severity of traits of metabolic syndrome defined according to NCEP ATP III guidelines.
Research design and methods
Voluntary subjects 18–70 years of age, living in the city of Caracas, and attending the Center for the Detection and Treatment of Silent Risk Factors for Cardiovascular and Metabolic Diseases affiliated with the Clinical Pharmacology Unit at the Central University of Venezuela were evaluated. Advertisement of Center activities and subject recruitment was achieved via radio and newspaper announcements, flyers, health fairs, and health screening programs. Our population consisted of 387 otherwise healthy treatment-naïve subjects who were screened for traits of the metabolic syndrome. This random sample was expected to represent the general population, excluding subjects with type 1 diabetes mellitus and known type 2 diabetics. None of the studied subjects was taking medications affecting glucose or insulin metabolism. The study was conducted in adherence to the Declaration of Helsinki, and the research protocol was approved by the institutional review board of the Central University Hospital serving the city of Caracas. All participants gave written informed consent. All applicable institutional and governmental regulations concerning the ethical use of human volunteers were followed during this research.
Complete history, physical examination and laboratory investigations, including hematology, chemistry, fasting lipid panel, fasting, and postload (75 g
After at least 5 days of weight-maintaining diet, the fasting subjects underwent a 75-g oral glucose tolerance test (OGTT). Blood samples were obtained at baseline, 30, 60, 90,120, and 180 min after the glucose ingestion. Both plasma glucose and insulin were determined at those times. Incremental areas under the curve (AUC) for plasma glucose and insulin were calculated and expressed as mg·dL−1·h−1 and μIU·mL−1·h−1, respectively.
Subjects were categorized as having the metabolic syndrome if they met at least three of the NCEP ATP III criteria: Waist circumference >102 cm (>40 in) in men and >88 cm (>35 in) in women; triglycerides >150 mg/dL (>1.7 mmol/L), HDL-C <40 mg/dL (<1.03 mmol/L) in men and <50 mg/dL (>1.29 mmol/L) in women, BP >130/>85 mmHg or on antihypertensive medication, and fasting glucose >110 mg/dL (>6.1 mmol/L) 2 .
Plasma glucose was measured with an automated glucose analyzer (Beckman Instruments, Palo Alto, CA), employing a glucose oxidase technique. Plasma insulin was quantitated by radioimmunoassay solid-phase radioimmunoassay (Diagnostic Products Corporation, Los Angeles, CA).
Statistical analyses
Descriptive statistics were generated for the study population using means [and standard error of the mean (SEM)] for continuous variables and proportions (%) for dichotomous variables. The significance of mean differences was tested with analysis of variance (ANOVA). Differences between categorical variables were tested with the chi-squared test. Two-sample comparison for continuous variables was analyzed with the Student t-test or paired t-test with Bonferroni adjustment for repeated testing. Triglyceride levels were log transformed for statistical analysis and back transformed for reporting. Pearson correlation analysis was used to assess the relationships between continuous variables. Ordinal logit regression analysis was employed to determine association between number and severity of traits. Differences were considered significant at values of P<0.05. All statistical analysis was performed with SPSS version 11.0 (SPSS Inc, Chicago, Ill).
Results
Data from 387 unselected subjects were evaluated. Subjects were classified based on the number or traits of the metabolic syndrome as defined by the NECP ATP III. 2 In this population, the distribution of subjects with no traits, 1, 2, 3, and 4–5 traits was 10.1%, 27.1%, 36.7%, 20.9%, and 5.1%, respectively. The prevalence of metabolic syndrome was 26% (subjects with 3 or more traits). Because of the young age of our subjects, few individuals had 5 traits; therefore, subjects with 4 and 5 traits were combined.
In subjects with one trait, low HDL-C, and increased waist circumference accounted for 55.2% and 30.5%, respectively, of all cases (Table 1). High triglyceride was the third commonest factor, which together with abdominal obesity and low HDL-C comprised 85% of the traits present in subjects with 2 traits. High BP, abnormal fasting glucose, or presence of newly diagnosed type 2 diabetes mellitus were the least frequent traits, contributing mainly as a fourth or fifth trait (Table 1).
Traits of the metabolic syndrome were defined based on National Education Cholesterol Program Adult Treatment Panel (NECP ATP III) guidelines.
Frequency of traits present was expressed as the percent of subjects with such a trait, in subjects with 1, 2, 3, or 4–5 traits.
HDL-C, high-density lipoprotein cholesterol; BP, blood pressure.
The severity of traits rose in parallel with the increase in number of traits. In fact, the number of traits present in an individual was directly related to the severity of each of the traits. Employing ordinal logistic regression with traits as a factor, a positive significant association was observed for weight, waist, BMI, systolic blood pressure (SBP), diastolic blood pressure (DBP), and serum glucose and triglyceride levels with number of traits. Serum HDL-C concentrations were inversely related to the number of traits (Table 2 and Fig. 1). Subjects with 4 or 5 traits were more obese (+5 kg, +5 cm waist), had higher BP, triglycerides (+58 mg/dL), fasting and postload glucose (+46 mg/dL) and insulin levels, and lower HDL-C (−4 md/dL) than subjects with 3 traits, even though both were diagnosed with metabolic syndrome. SBP in subjects with 3 traits was an average of 18 mmHg lower than in those with 4–5 traits (Table 2). Similarly, subjects with 2 traits were more obese, had worse dyslipidemia, higher BP, and higher fasting and postload glucose levels than those with one or no traits (Table 2, Fig. 1).
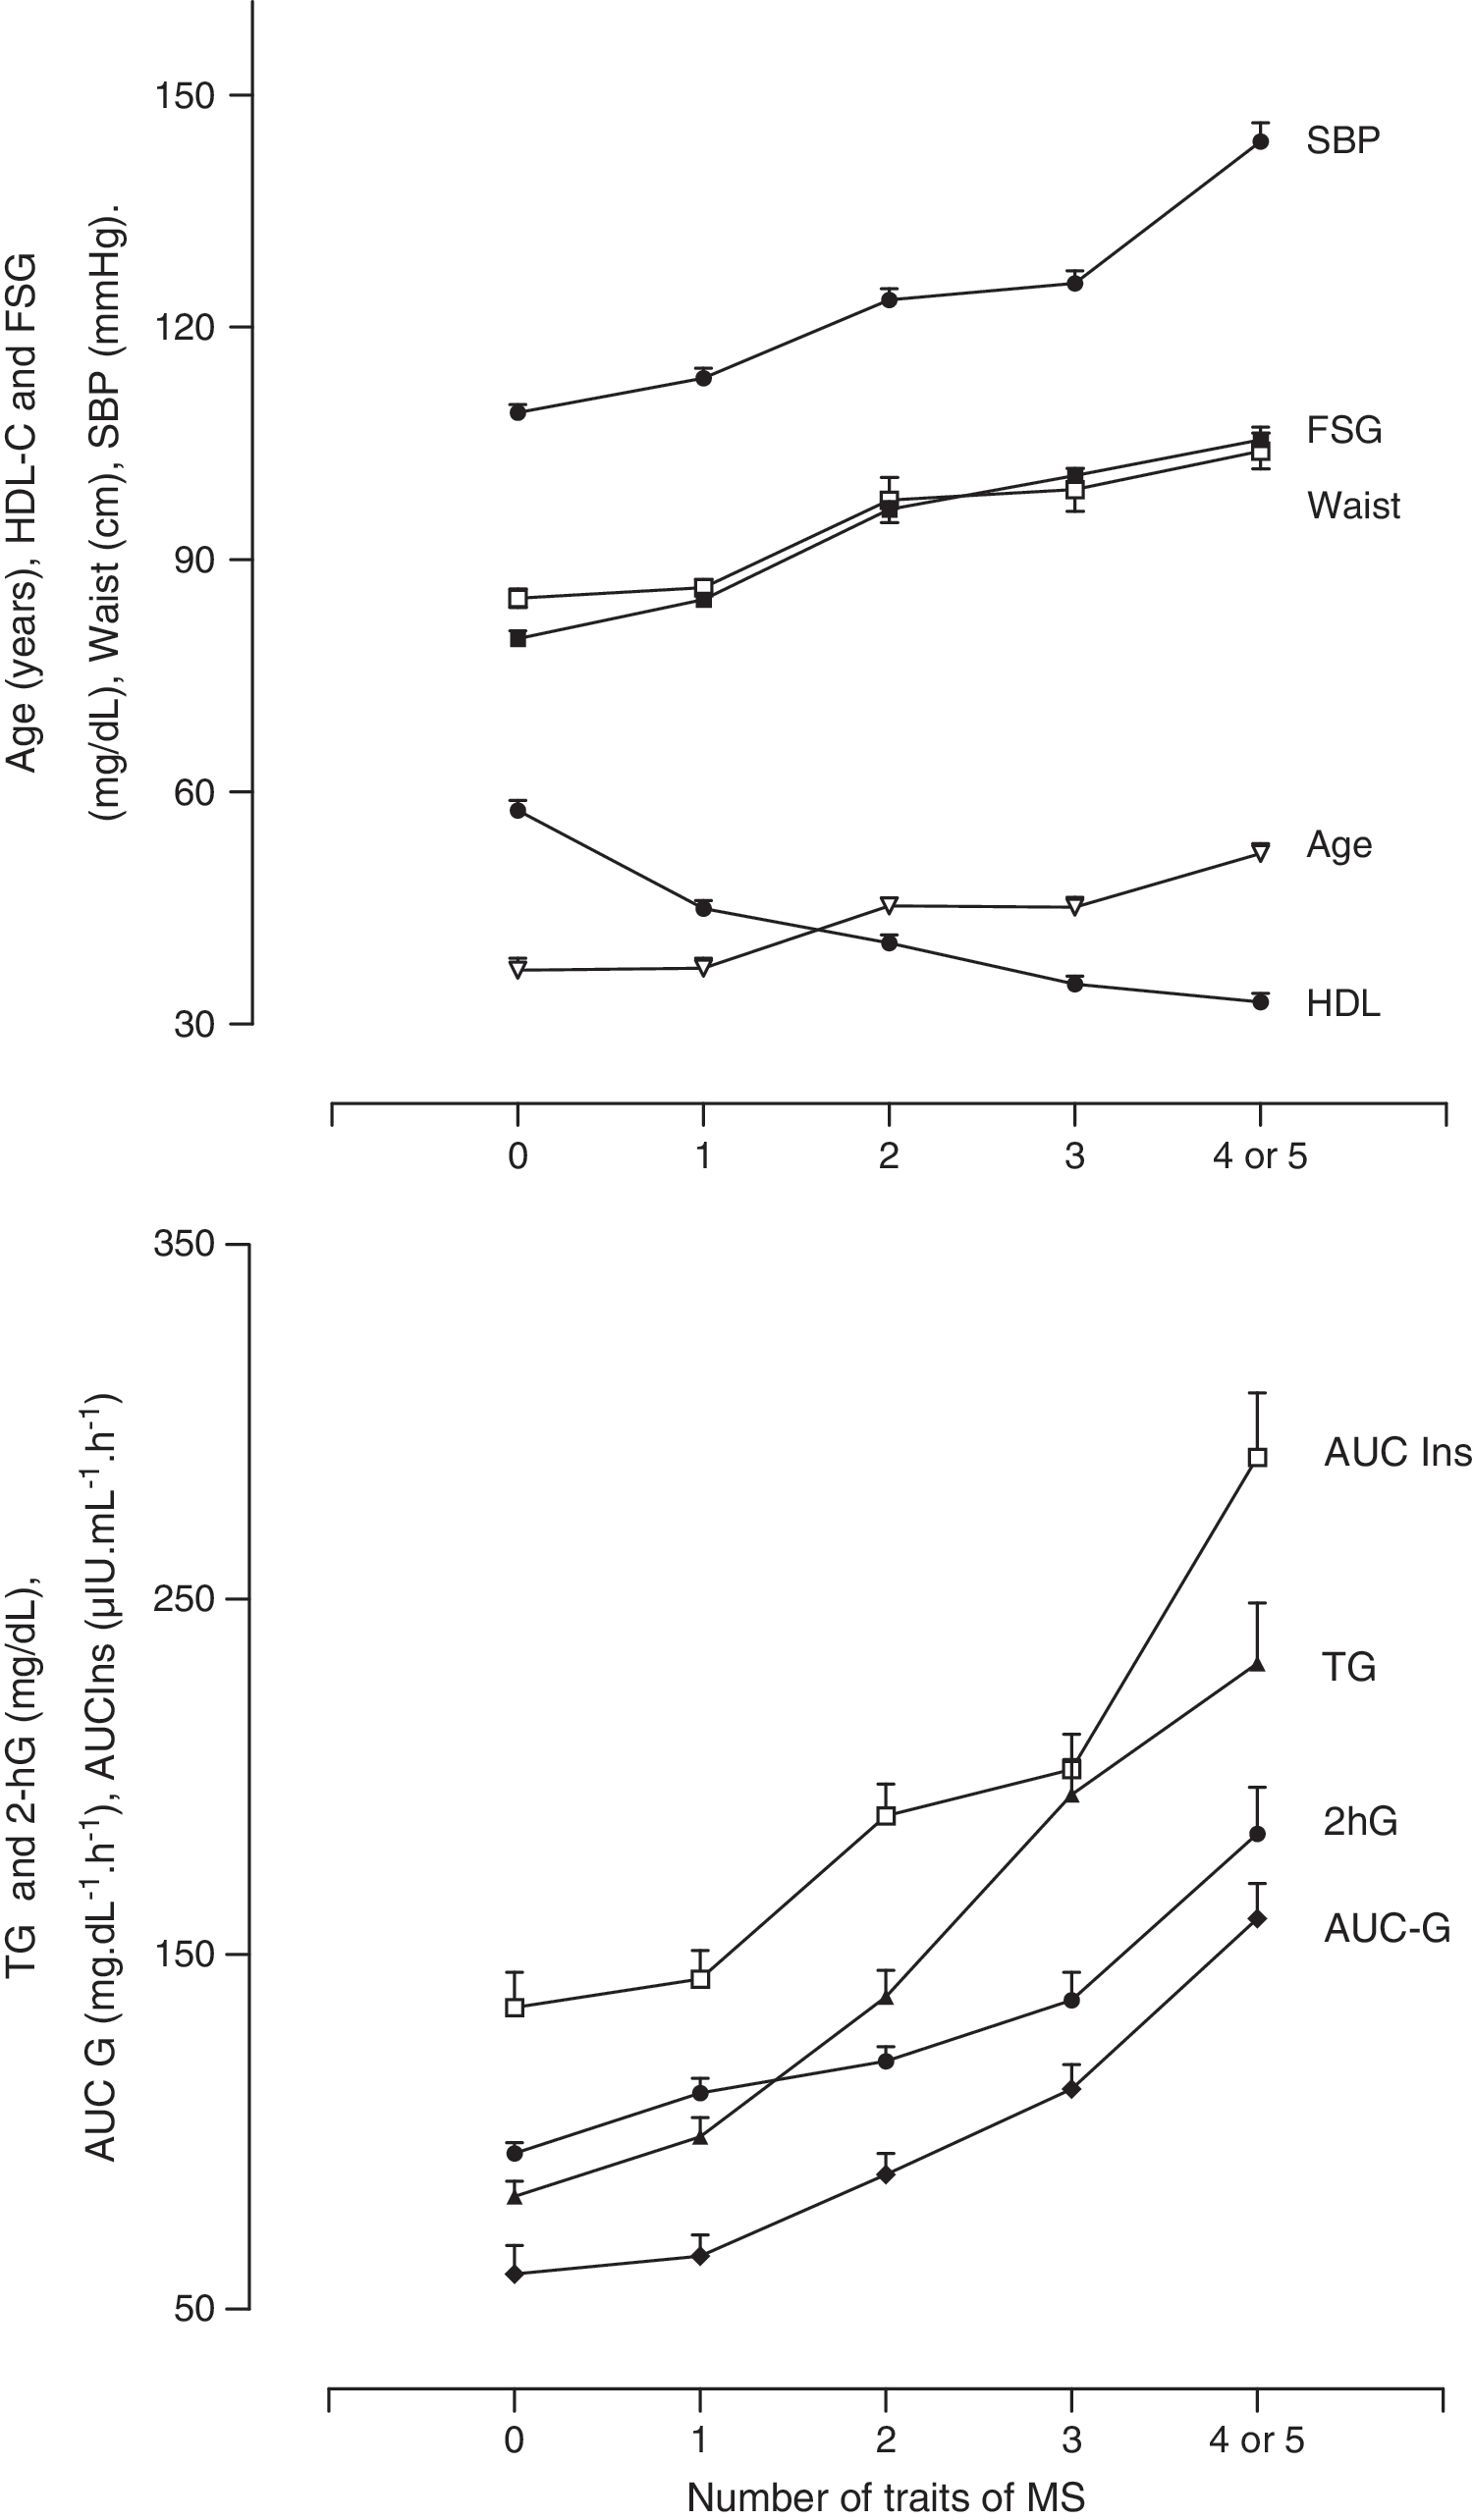
Traits of the metabolic syndrome: A continuum of risk. Age, years; waist, cm; HDL, high-density lipoprotein cholesterol; FSG, fasting serum glucose; SBP, systolic blood pressure; MS, metabolic syndrome; TG, triglyceride; G, glucose; AUC, area under the curve; AUC Ins, AUC insulin; AUC-G, AUC glucose; 2hG, glucose levels 2h after oral glucose.
Shown are mean values±standard error of the mean (SEM) for each of the variables. Trend for each variable with number of traits was assessed by ordinal logistic regression analysis.
P values adjusted by age.
BMI, body mass index; SBP, systolic blood pressure; DBP, diastolic blood pressure.
Age was another variable that increased in proportion with the number and severity of traits of metabolic syndrome (Table 1 and Fig. 1); however, the significant association encountered between number and severity of traits of metabolic syndrome was present even after correcting for by age (Table 1). Interestingly, waist was the variable most strongly associated with number of traits (R 2 =0.810; P<0.0001) when adjusting for the other traits of metabolic syndrome (i.e., age, SBP, triglyceride, HDL-C, and serum glucose).
Fasting plasma glucose and insulin levels, as well as levels at 30, 60, 120, and 180 min after an oral glucose load gradually increased with the number of traits present in an individual (Figs. 1 and 2). The increases above basal plasma glucose and insulin levels induced by oral glucose were expressed as the incremental AUC for both substances. Both glucose and insulin AUC increased in direct proportion with the number of traits present (Figs. 1 and 2). Subjects with 4 or 5 traits had higher postload hyperglycemia (AUC-G, 160±10 vs. 112±7 mg·dL−1·h−1; P<0.01) and hyperinsulinemia (AUC-I, 290±14 vs. 202±10 μIU·ml−1·h−1; P<0.01) than those with three traits. Similarly, the grade of postload hyperinsulinemia and hyperglycemia gradually increased from 0 to 4–5 traits of metabolic syndrome (Figs. 1 and 2).
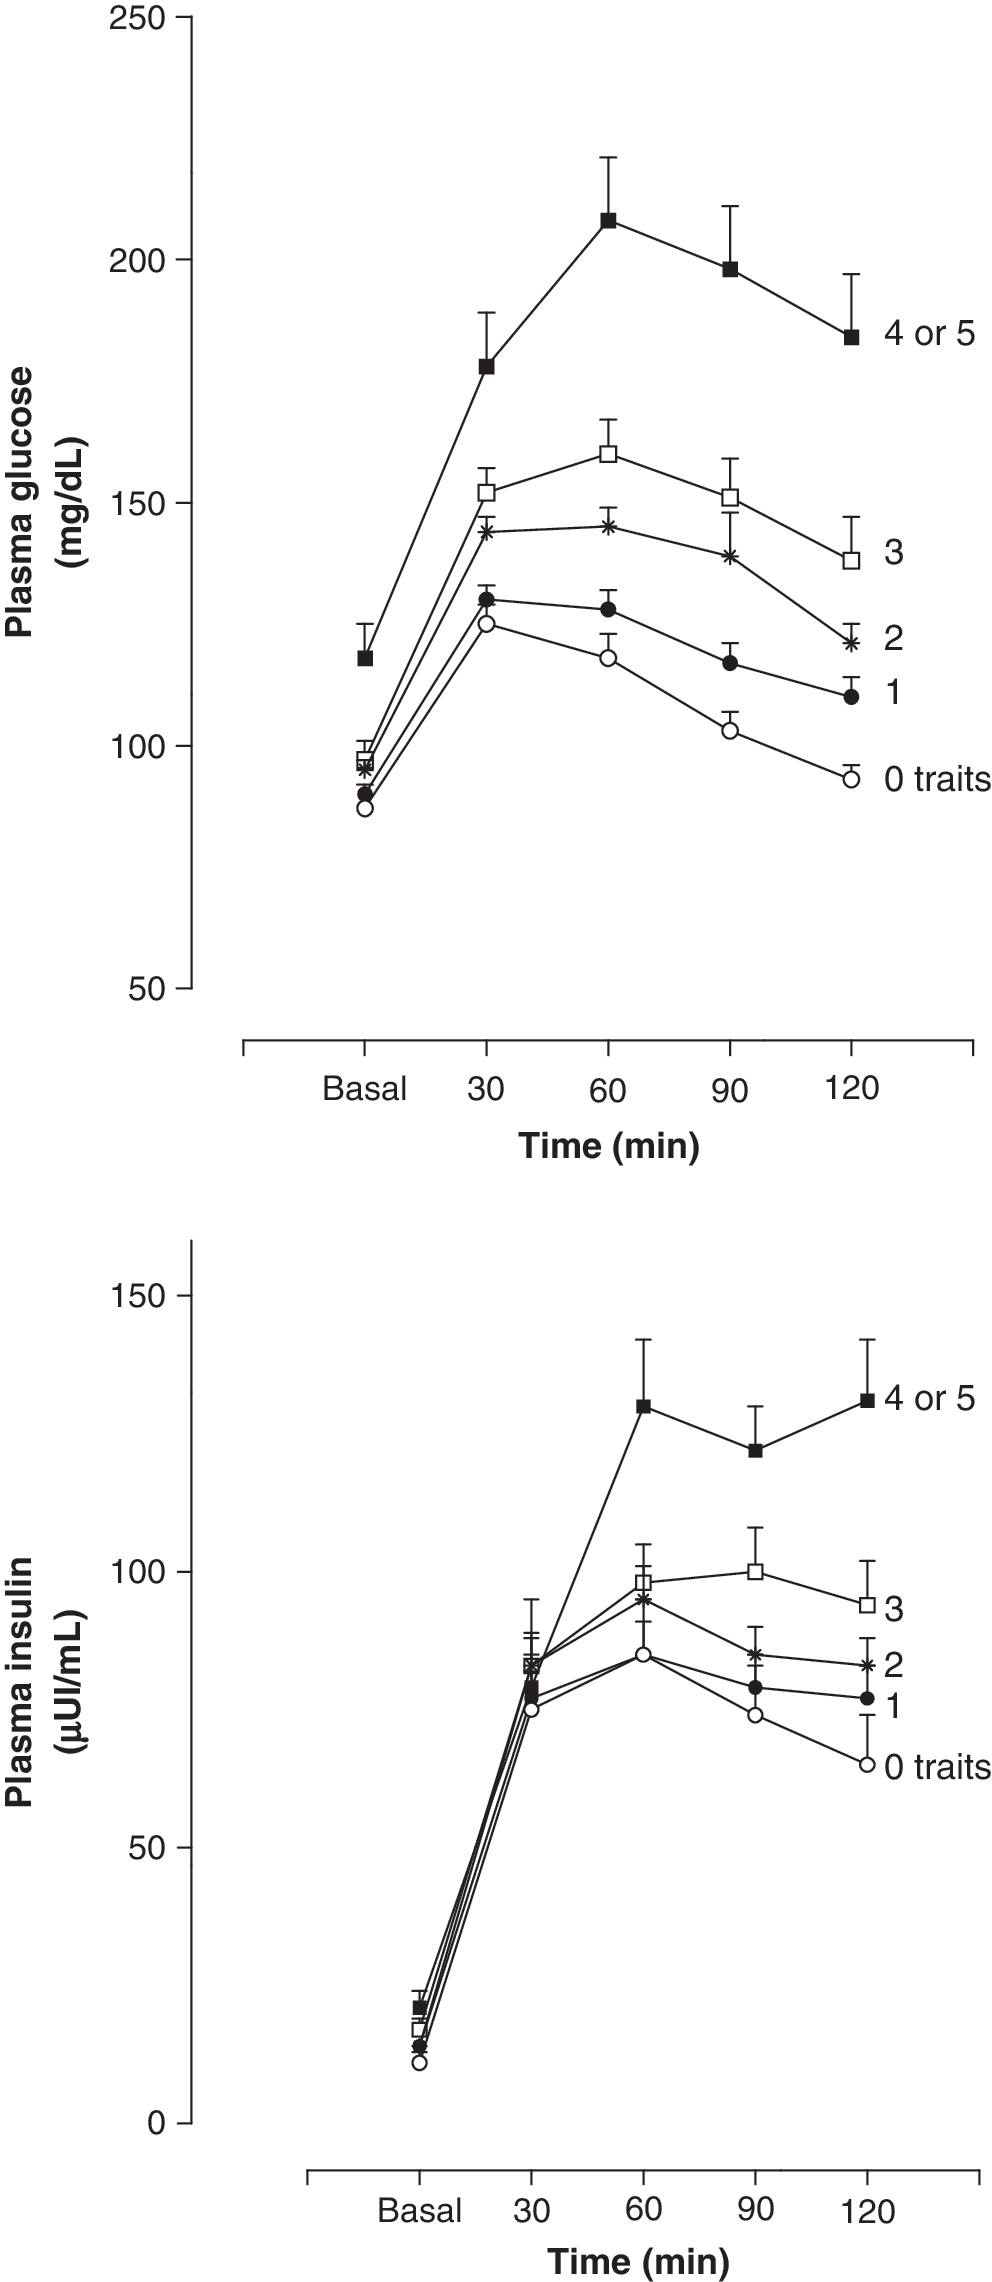
Plasma glucose and insulin concentrations during an oral glucose tolerance test (OGTT) in subjects with different number of traits of metabolic syndrome. Shown are mean values±standard error of the mean (SEM) for the plasma concentrations of glucose (mg/dL) and insulin (μUI/mL) during an OGGT, in subjects with either no traits, 1, 2, 3, or 4–5 traits of the metabolic syndrome. Samples were obtained at baseline (fasting) and at 30, 60, 90, and 120 min after the ingestion of 75 g of glucose.
Discussion
Our results revealed that presence of more traits of the metabolic syndrome in an individual is associated with an increased severity of each of the traits. Subjects with increased number of traits had also higher values for weight, girth, triglycerides, and BP, as well as greater glucose and insulin abnormalities, and lower HDL-C levels, than those with fewer traits. A gradual progression of trait severity was observed as the number of traits increased from no traits through 4 or 5 traits. The well-known association between increased cardiovascular risk with the number of traits 8,9,14 –16 may result not only to clustering of risk factors but also to the greater severity of each risk factor (present study). It is important to indicate that the study was conducted in Latin-American individuals, and that caution should be exerted when extrapolating the results to other populations.
Our findings indicate that diagnosis of metabolic syndrome does not imply an equal risk load for the subjects. In fact, higher BP, fasting and postload hyperglycemia and hyperinsulinemia, greater obesity, and worse dyslipidemia were found in subjects with 4–5 traits than in those with 3 traits, even though both groups of patients were diagnosed with metabolic syndrome. Consequently, practitioners should be aware that subjects with metabolic syndrome may be at quite different risk loads, and that treatment should be individualized based on of type and severity of each trait.
Although age is not considered as a risk factor (trait) in the definition of metabolic syndrome, age was found to increase in parallel with the number and severity of risk factors. In fact, older subjects had more and more severe traits than younger subjects. Subjects with 4–5 traits were on average 12, 9, 5, and 3 years older than those with no traits, 1, 2, and 3 traits, respectively. Similarly, subjects with metabolic syndrome were older than those not meeting criteria (0, 1, or 2 traits). Despite the limitation imposed by the cross-sectional design, it may inferred that several years of abdominal obesity are required to induce vascular and metabolic abnormalities leading to dyslipidemia, BP increases, and glucose–insulin abnormalities. 17 It is noteworthy that abdominal obesity, based on waist measurements, was the variable best associated with clustering of traits, when adjusting for other traits of metabolic syndrome.
In conclusion, we demonstrated that subjects with more traits of metabolic syndrome also had more severe traits. The association between number and severity of traits starts from one trait and continues throughout the fully blown metabolic syndrome. Our findings indicate that diagnosis of metabolic syndrome does not imply a fixed risk load, because subjects with 4 and 5 risk factors had more advanced metabolic and cardiovascular abnormalities than those with 3 traits.
Footnotes
Author Disclosure Statement
The authors have no relevant conflict of interest to disclose.