
Abstract
Background:
Adiponectin and leptin, adipokines associated with metabolic syndrome, type 2 diabetes, and cardiovascular disease, have not been well characterized in extreme pediatric obesity. Therefore, levels were compared in youth that were extremely obese (EO) to normal weight (NW), overweight (OW), and obese (OB) youth.
Methods:
Leptin, adiponectin, body mass index (BMI), blood pressure, fasting glucose, insulin, and lipids were obtained in 277 children and adolescents (age 13.4±2.6 years; 152 boys). Participants were classified into four BMI groups (NW, OW, OB, EO). Variables were compared across groups using analysis of covariance (ANCOVA) adjusted for gender, age, and race.
Results:
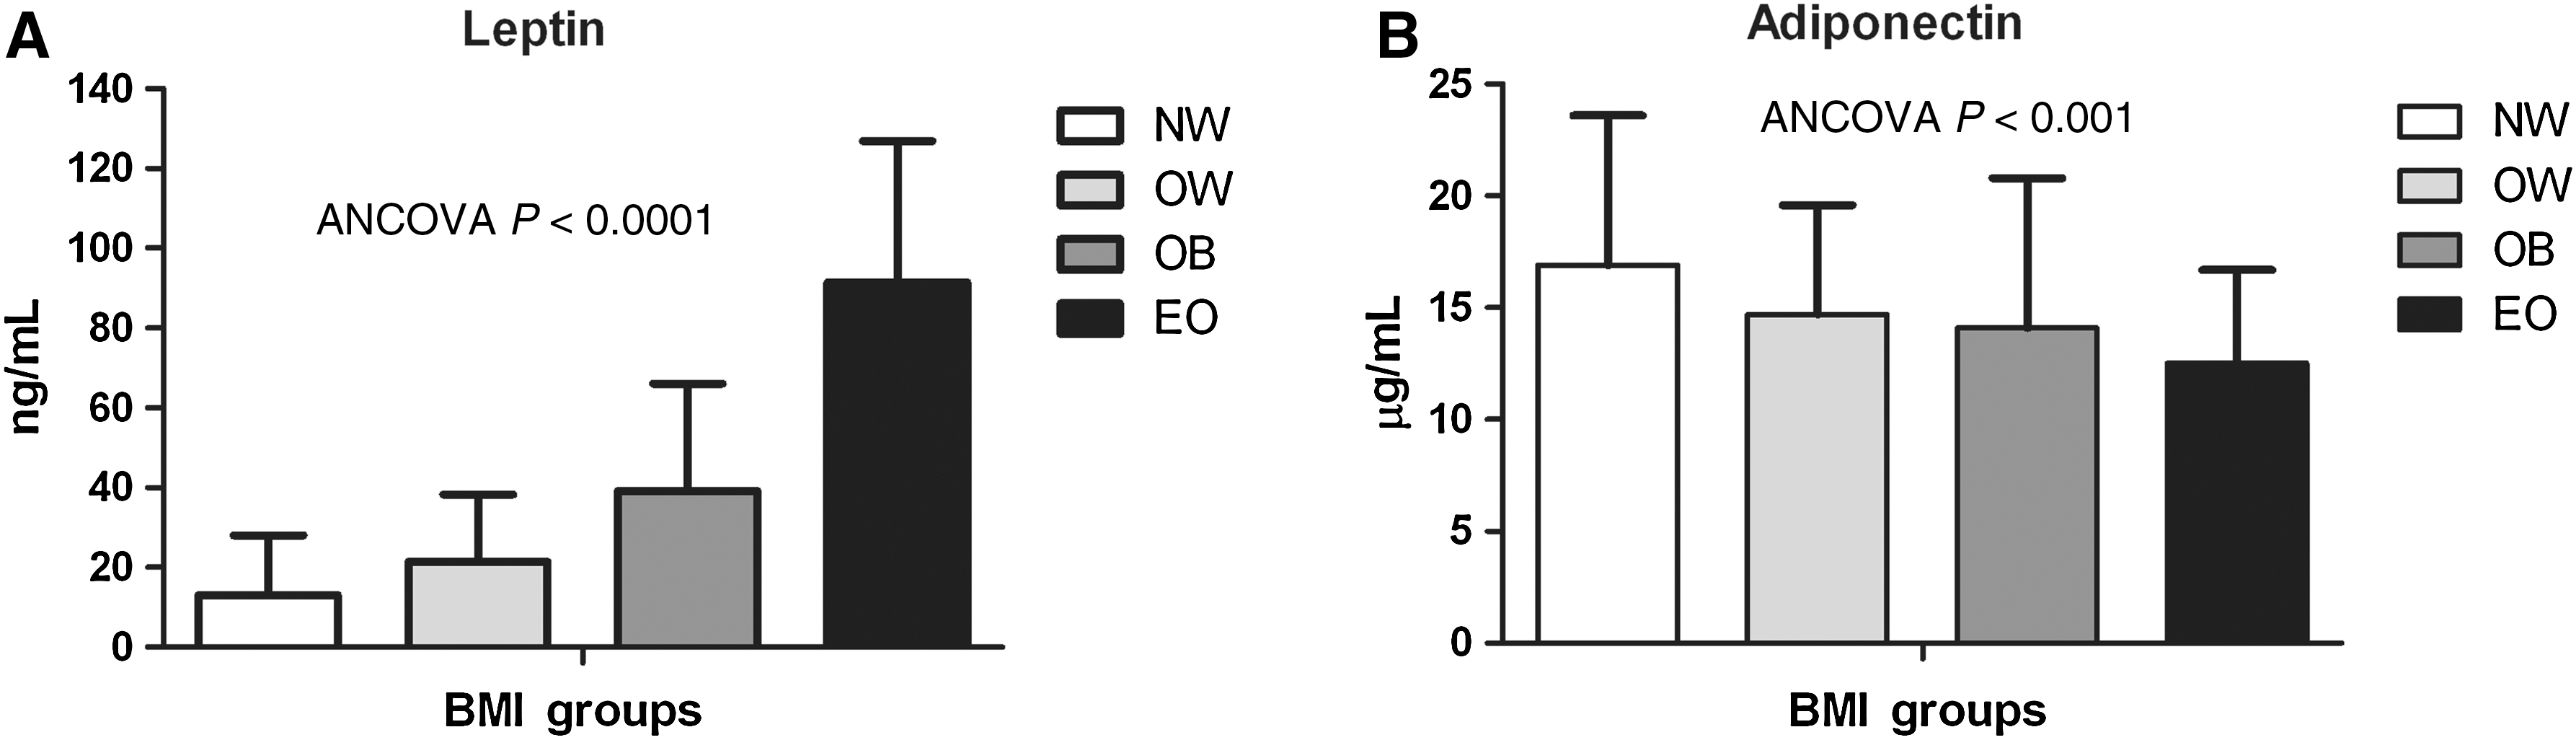
Risk factors generally worsened across BMI groups. EO had significantly higher levels of leptin than OB (P<0.0001), OW (P<0.0001), and NW (P<0.0001). Leptin was higher in OB compared to OW (P<0.005) and NW (P<0.0001) and higher in OW compared to NW (P<0.0001). Adiponectin levels in EO did not significantly differ from OB or OW but were significantly lower than NW (P<0.0001). Adiponectin was not significantly different among the OB, OW, and NW groups.
Conclusions:
Leptin was markedly elevated in EO children and adolescents, suggesting that this subset of obese youth may be at particularly high risk of future weight gain and potentially reduced response to weight-loss interventions.
Introduction
To our knowledge, no studies have characterized leptin levels in the context of extreme pediatric obesity, and only one has reported on adiponectin levels. 23 Therefore, we examined levels of these adipokines across a range of BMI categories in children and adolescents. We also studied the relationship of leptin and adiponectin with homeostasis model assessment of insulin resistance (HOMA-IR), a surrogate marker of insulin resistance.
Methods
Study design and participants
This cross-sectional study included 277 children and adolescents (mean age=13.4±2.6 years; 152 boys) who were categorized into four BMI groups based on age and gender-specific BMI percentiles (normal weight (NW), <85th percentile, age range 9–17 years old, n=137; overweight (OW) 85th to <95th percentile, age range 8–17 years old, n=48; obese (OB), 95th to <1.2 times the 95th percentile, age range 6–18 years old, n=40; and extremely obese (EO) ≥1.2 times the 95th percentile or BMI ≥35 kg/m2, age range 8–18 years old, n=52). Participants in this study were drawn from three sources: (1) A healthy sibling control group participating in a cross-sectional study of cardiovascular risk in childhood cancer survivors; (2) a healthy group of children and adolescents participating in a longitudinal study of cardiovascular risk; and (3) patients recruited from the University of Minnesota Amplatz Children's Hospital Pediatric Weight Management Clinic. The protocols were approved by the University of Minnesota Institutional Review Board, and consent/assent was obtained from parents/participants.
Measurement of clinical variables and plasma adipokines
All testing was performed at the University of Minnesota Clinical and Translational Science Institute using the same equipment. Weight and height were measured on a calibrated electronic scale and stadiometer, respectively, with light clothes and without shoes. BMI was calculated as weight in kilograms divided by height in meters squared. Waist and hip circumference were measured to the nearest 0.5 cm, taken in duplicate, and the mean values were used in the analyses. Seated blood pressure was obtained after 5 min of quiet rest on the right arm using an automatic sphygmomanometer. Fasting blood samples were collected for lipids, glucose, and insulin; assays were conducted with standard procedures at the Fairview Diagnostic Laboratories, Fairview-University Medical Center (Minneapolis, MN), a Centers for Disease Control and Prevention–certified laboratory. HOMA-IR was calculated as described by Matthews et al. 24 Blood plasma was stored frozen at −70°C until leptin and adiponectin assays were performed using multiplex (R & D Systems, Inc., Minneapolis, MN) at the University of Minnesota Cytokine Reference Laboratory (Clinical Laboratory Improvement Amendments [CLIA] licensed).
Statistical analysis
Descriptive statistics, including means and standard deviations, were performed for all variables across the four BMI groups. Leptin was not normally distributed so values were log-transformed for analysis. Analysis of covariance (ANCOVA) (adjusted for age, gender, and race) was performed to assess differences in cardiovascular risk factors, leptin, and adiponectin across BMI groups. Tukey post hoc tests were conducted to determine which groups differed for leptin and adiponectin. Linear regression analyses, adjusted for age, gender, and race, were performed to examine the relationships of leptin and adiponectin to HOMA-IR (as a surrogate of insulin resistance) in the entire sample and within each BMI group. Statistical significance was considered P<0.05. Data are presented as mean±standard deviation.
Results
Clinical characteristics and adipokines, by BMI group, are shown in Table 1. There were no significant differences among groups for age, gender, and race. By design, BMI (P<0.0001), BMI z-score (P<0.0001), and waist circumference (P<0.0001) differed among BMI groups. Systolic blood pressure (SBP), diastolic blood pressure (DBP), lipid profile [total cholesterol, low-density lipoprotein cholesterol (LDL-C), high-density lipoprotein cholesterol (HDL-C), and triglycerides] and insulin significantly differed among BMI groups (all ANCOVA P<0.0001). Leptin was significantly different (ANCOVA P<0.0001; Fig. 1, panel A) among BMI groups with EO having significantly higher levels than OB (P<0.0001), OW (P<0.0001), and NW (P<0.0001). Leptin was higher in OB compared to OW (P<0.005) and NW (P<0.0001) and higher in OW compared to NW (P<0.0001). Adiponectin was significantly different (ANCOVA P<0.001; Fig. 1, panel B) among BMI groups. Adiponectin levels in the EO group did not significantly differ from OB (P=0.61) or OW (P=0.28) but were significantly lower than NW (P<0.0001). Adiponectin was not significantly different among the OB, OW, and NW groups.
Leptin
Data are shown as mean±standard deviation.
NW, normal weight; OW, overweight; OB, obese; EO, extremely obese; ANCOVA, analysis of covariance; BMI, body mass index; SBP, systolic blood pressure; DBP, diastolic blood pressure; LDL-C, low-density lipoprotein cholesterol; HDL-C, high-density lipoprotein cholesterol.
Separate analyses were conducted by gender. The percentages of boys/girls and age breakdown by BMI group were as follows: NW (boys 50%, age 13.3±2.7; girls 50%, age 13.7±2.2); OW (boys 65%, age 13.9±2.7; girls 35%, age 13.7±2.3); OB (boys 70%, age 12.9±3.0; girls 30%, age 12.7±2.4); and EO (boys 48%, age 13.2±2.7; girls 52%, age 12.5±2.6). When the same leptin and adiponectin analyses were conducted separately for boys and girls by BMI group, the results were identical for the boys (the magnitudes of P values differed, but significant differences by BMI group were the same as when the genders were combined as presented above). Results for the girls were identical for adiponectin but slightly differed for leptin. Leptin in the girls was significantly different (ANCOVA P<0.0001) among BMI groups, with EO having significantly higher levels than NW (P<0.0001) and OW (P<0.0001) but not OB (P=0.325). Leptin was higher in OB compared to NW (P<0.0001) but not OW (P=0.231). Leptin was higher in OW compared to NW (P<0.001).
In the entire sample (n=277), leptin (r=0.47, P<0.0001) and adiponectin (r=−0.26, P<0.0001) were significantly associated with HOMA-IR. Within the NW group, leptin was significantly associated with HOMA-IR (r=0.33, P<0.0001). Adiponectin was not associated with HOMA-IR within the NW group. Within the OW group, leptin was significantly associated with HOMA-IR (r=0.42, P<0.005). Adiponectin was not associated with HOMA-IR in this group. Within the OB group, neither leptin nor adiponectin was associated with HOMA-IR. In the EO group, leptin was not associated with HOMA-IR; however, there was a significant association between adiponectin and HOMA-IR (r=−0.45, P<0.002).
Discussion
The principal finding of this study is that EO children and adolescents, compared to OB, OW, and NW youth, have adverse levels of adipokines, which are known to be associated with metabolic syndrome, type 2 diabetes mellitus, and cardiovascular disease. The lower adiponectin levels in the EO group are consistent with findings of Weiss et al. 23 Our findings extend these observations in context of extreme pediatric obesity by demonstrating that EO children and adolescents have markedly elevated levels of leptin, an adipokine associated with fundamental metabolic and vascular derangements. 10,12,14,16 –18 The observation that adiponectin and HOMA-IR, a marker of insulin resistance, were only correlated in the EO group suggests that adiponectin may play a more prominent metabolic role in extreme pediatric obesity.
Abnormal levels of leptin and adiponectin may signal increased risk for type 2 diabetes mellitus and cardiovascular disease. Recombinant leptin administration has been shown to promote atherosclerosis in mice and endogenous leptin levels have been associated with arterial stiffness, 16 insulin resistance, 12 inflammation, 18 and metabolic syndrome-associated cardiometabolic risk factors 12,14,17 –19 in children. Similarly, low levels of adiponectin are mechanistically linked to increased clearance rate of HDL-C (i.e., reduced numbers of this lipoprotein) 25 and are associated with increased progression of coronary artery calcium in adults 11 and increased carotid intima media thickness in children. 15 Moreover, hypoadiponectinemia is associated with visceral adiposity, insulin resistance, β-cell dysfunction, component factors of the metabolic syndrome, and inflammation in children and adolescents. 9,13,14,18,19,23 Together, these data suggest that leptin and adiponectin may play prominent roles in the early disease processes of type 2 diabetes mellitus and cardiovascular disease and abnormal levels of these adipokines in childhood may reflect increased risk for developing these chronic diseases.
Although the relationship between adiponectin and adiposity was generally linear throughout all BMI categories, this did not seem to be true for leptin, which appeared to be nonlinearly elevated in the EO group. This particular finding is important because leptin is an independent predictor of increasing BMI, 21,22 and is associated with reduced weight loss efficacy, in youth. 26,27 Our finding of exceedingly high levels of leptin in EO children is congruent with a previous report by Freedman et al. 5 demonstrating very strong tracking of adiposity from childhood to adulthood in EO youth. Therefore, in addition to the immediate metabolic and vascular consequences of hyperleptinemia in extreme pediatric obesity, the exceedingly high leptin levels in this group portend an increased risk of weight gain over time and potentially reduced efficacy of weight loss interventions in this subset of obese youth and suggest that standard approaches to weight management may be less effective in these children. Thus, the current findings suggest the potential need for aggressive weight management approaches in EO children and adolescents to minimize, or potentially eliminate, weight gain and development of metabolic syndrome components over time.
Strengths of the study include the relatively large sample size and the wide range of BMI values. Despite the heterogeneous population (sample derived from multiple studies), data collection was standardized [performed with identical methods and in the same location] and occurred over the same period of time. Tanner staging was not performed on most of the participants; therefore, we were not able to adjust our analyses for pubertal status. However, age was not different across groups. Physical activity and dietary patterns, which likely differed among the BMI groups, were not determined.
Accumulating data suggest that extreme pediatric obesity is a condition associated with high risk of developing type 2 diabetes mellitus and cardiovascular disease, even compared to less severe forms of adiposity such as overweight and obesity. Results from the current study add to this growing body of evidence by demonstrating that extreme pediatric obesity is associated with an adverse adipokine profile. Extreme pediatric obesity is an urgent public health concern given that this condition afflicts up to 7% of the U.S. pediatric population and that the prevalence is increasing at a rapid rate. Aggressive management of body weight and risk factors early in life may be required to prevent metabolic syndrome, type 2 diabetes, and cardiovascular disease in these youth.
Footnotes
Acknowledgments
Funding for this study was provided by the University of Minnesota Vikings Children's Fund (A.S.K.), Minnesota Medical Foundation (A.S.K.), National Institutes of Health—1RO1DK072124-01A3 (J.S.) and 1RO1CA113930-01A1 (J.S.), and GCRC: M01-RR00400, General Clinical Research Center Program, National Center for Research Resources (NCRR)/NIH.
Author Disclosure Statement
The authors have no relevant disclosures.