
Abstract
Background:
Preserving fat-free mass (FFM) during weight loss is important in older adults. The purpose was to examine a low-fat diet (LFD) versus a carbohydrate-restricted diet (CRD) with and without progressive resistance exercise (PRE) on preservation of FFM in older men with metabolic syndrome.
Methods:
A total of 42 men (59±7 years) were matched [body mass index (BMI)] and randomized to LFD, LFD&PRE, CRD, and CRD&PRE. PRE groups performed supervised strength training three times per week. Body weight, composition, metabolic syndrome criteria, and strength were measured at baseline and week 12. A 3-day diet record was kept at baseline and at weeks 1, 6, and 12.
Results:
Attrition (24%) was similar between groups. Depicted as % carbohydrate:fat:protein, the intervention diet was: LFD=55:24:18, LFD&PRE=57:20:20, CRD=16:54:28, and CRD&PRE=12:56:31. Weight (lb) decreased similarly in all groups (LFD, −18.0±7.4; LFD&PRE, −19.8±12.8; CRD, −20.2±8.0; CRD&PRE, −22.7±6.0; P<0.001), and number of participants with metabolic syndrome decreased in all groups (−3, −6, −3, −4, respectively). Percent of weight loss from appendicular FFM was 27.5%, 15.9%, 15.7%, and 17.3% respectively. A trend was found when comparing LFD and LFD&PRE (P=0.068), and when comparing LFD&CRD (P=0.072). Triglycerides improved more for the LFD&PRE, CRD, and CRD&PRE groups compared to the LFD group (P<0.05). Improvements in high-density lipoprotein-cholesterol were better in the CRD&PRE group (4.1±5.1 mg/dL) versus the LFD group (−5.0±5.9 mg/dL; P<0.01).
Conclusions:
LFD&PRE, CRD, and CRD&PRE preserve FFM similarly. PRE is an important component of a LFD during weight loss in this population.
Introduction
Although the traditional dietary therapy for weight loss and metabolic health has been a LFD, a considerable body of recent evidence supports the use of carbohydrate-restricted diets (CRD) in the treatment of metabolic syndrome. 5 However, concern exists that CRD may increase muscle catabolism, 6 leading to exacerbated FFM loss during weight loss. Furthermore, the existing literature examining dietary treatment of metabolic syndrome largely focuses on younger and middle-aged adults, and very few of those have employed resistance training as a part of the intervention. As such, the primary purpose of this study was to examine the effects of a 12-week LFD versus CRD with and without PRE on preservation of FFM in older men with metabolic syndrome. A secondary purpose of the study was to examine the effects of these treatments on the diagnostic criteria for metabolic syndrome.
Methods
Subjects
Men aged 50–75 with metabolic syndrome were recruited to participate in this study. The revised NCEP ATP III diagnostic criteria 7 were used to determine the presence of metabolic syndrome. Exclusion criteria were: Weight loss of ≥5 lb in the previous 6 months, adherence to either a LFD or CRD in the previous 6 months, presence of cardiovascular disease, thyroid disease, diabetes mellitus or cancer, history of gout, or presence of a musculoskeletal pathology that would limit participation in a PRE program. Participants taking lipid-lowering medications were allowed to participate as long as their dosage had not changed in the previous 6 months. A total of 138 men responded to local advertising; 45 qualified and 42 enrolled in the study. All participants provided written informed consent to participate, and all study procedures were approved by the Institutional Review Board at Springfield College.
Experimental design
This 12-week weight loss study followed a randomized, parallel-arm design. Participants were matched according to body mass index (BMI) then randomly assigned to one of the following groups: (1) LFD (n=11), LFD&PRE (n=10), CRD (n=11), and CRD&PRE (n=10). Data were collected at baseline and week 12.
Diet Intervention
Approximately 10 days prior to baseline data collection, all participants partook in an educational session to learn about their assigned diet. Both verbal and written instructions were provided, including information about reading and interpreting food labels as pertinent to their assigned diet. Also at this session, all participants were provided with a standard multivitamin that was consumed every other day throughout the study. During the educational session, participants were instructed about how to complete a diet record. A 3-day diet record (2 week days and 1 weekend day) was completed at baseline (habitual diet), week 1, week 6, and week 12.
Participants assigned to the LFD were instructed to consume a diet comprised of <30% of energy from fat, with <10% from saturated fat, and were instructed to consume <300 mg/day of dietary cholesterol. Participants were encouraged to meet these goals by consuming three to four servings of both fruits and vegetables per day, six to eight servings of grains per day with at least half coming from whole-grain sources, two to three servings of low-fat or fat-free dairy products per day, 3–6 ounces of lean meats per day, and low-fat or fat-free versions of condiments. Participants were given an energy intake goal of 1800 kcal/day.
Participants assigned to the CRD were instructed to consume a diet with <50 grams of carbohydrate per day, with no specific restrictions provided with respect to total or saturated fat consumption or dietary cholesterol consumption. Participants were encouraged to meet these goals by consuming unlimited amounts of beef, poultry, fish, and eggs; moderate amounts of hard cheeses, low-carbohydrate vegetables, and salad dressings; and small amounts of nuts and seeds. Participants were specifically instructed to completely avoid fruit and fruit juices, pasta, rice, cereals, breads, and desserts. After 4 weeks on the diet, one serving per day of fresh berries was allowed. Energy consumption in this group was ad libitum. To assess compliance to the CRD, participants assigned to this diet were provided with Ketostix reagent strips (Bayer, Elkhart, IN) and instructed to measure ketonuria at the same time nightly and to keep a record of the results throughout the study.
Progressive Resistance Exercise
Participants assigned to the LFD&PRE group and the CRD&PRE group completed a strength-training program three times per week for 12 weeks, with every session completed under the supervision of a personal trainer. For the first 6 weeks, each training session consisted of a standard warm-up, followed by one set of 10–15 repetitions of the following exercises: Bent-knee sit up, hyperextensions, leg press, chest press, hamstring curl, lat pull down, calf raises, shoulder press, seated row, tricep press, and bicep curl, followed by static stretching. During weeks 7–12, two sets of 8–12 repetitions of the same exercises were performed. Personal trainers supervised the training carefully, and once participants could successfully complete the maximum number of repetitions assigned, resistance was increased by approximately 5%. Participants maintained their baseline levels of physical activity outside of the study throughout the 12 weeks. Participants in the diet-only groups did not participate in strength training during the intervention, and maintained baseline levels of physical activity.
Data collection
To assess the efficacy of the strength training program and to examine the effects of the intervention on muscle quality, maximal upper and lower body strength were assessed by completing a three- to five-repetition maximum (RM) on a leg press (Precore Angled Leg Press 601; Woodinville, WA) and chest press (Precore Chest Press; Woodinville, WA) machine at baseline and week 12. Using the weight and the number of repetitions completed, a standard equation was used to estimate a 1RM for leg press and chest press. 8
On a separate subsequent day, participants arrived at the Human Performance Laboratory after an overnight fast of at least 10 h. Participants were first seated for 5 min, and a resting blood pressure was measured by a trained technician. Waist circumference was measured at the mid-point between the lowest rib and the iliac crest. Body composition was assessed using the Tanita BC-418 Segmental Body Composition Analyzer/Scale (Tanita Inc. Tyoko, Japan), which has been shown to correlate strongly (r≥0.95, P<0.001) with both whole-body and regional composition values obtained using the gold standard for body composition analysis, dual-energy X-ray absorptiometry (DEXA). 9 Finally, blood was collected via antecubital venipuncture into serum separator tubes and tubes with ETDA to yield serum and plasma. After clotting and centrifugation, one serum tube was sent to a certified medical laboratory (Quest Diagnostics, Springfield, MA) for a comprehensive metabolic screening profile, which included serum glucose, albumin, minerals, renal, and liver function. The next meal consumed was the first meal on the assigned diet, and participants remained on this diet for the next 12 weeks. At week 12, identical data collection procedures were completed. All participants were weighed on the same day weekly throughout the study and recent diet records were checked to enhance compliance.
Laboratory analyses
Plasma total cholesterol, high-density lipoprotein cholesterol (HDL-C), and triacylglycerol (TAG) concentrations were determined using methods described previously, 10 and low-density lipoprotein cholesterol (LDL-C) was determined according to the method of Friedewald. 11 Muscle quality was determined by dividing the leg press–predicted 1-RM value (lb) by the FFM in the legs (lb), similar to the method proposed by Goodpaster et al. 12
Dietary analyses
Three-day food records were input and analyzed using ESHA Food Processor® SQL Software, version 10.7. Values for nutrients from each 3-day period were averaged to obtain values for each time period (baseline, and weeks 1, 6, and 12).
Statistical analyses
For dietary analyses, data from diet records from weeks 1, 6, and 12 were pooled to depict the intervention diet. A one-way analysis of variance was used to check for group differences at baseline in age, BMI, waist circumference, blood pressure, glucose, and lipids. A 2×4 factorial analysis of variance with repeated measures was used to determine group and time effects on the dependent variables. In the event that a significant main effect was found, Fisher LSD post hoc tests were performed. All analyses were conducted using the SPSS, version 17.0. Significance was set at P<0.05.
Results
A total of 32 participants (LFD n=8; LFD&PRE n=9; CRD n=8; CRD&PRE n=7) 59±7 years old completed the 12-week intervention, yielding an attrition rate of 24%. A total of 6 participants discontinued participation due to dissatisfaction with the diet (LFD=1; LFD&PRE=2; CRD=2; CRD&PRE=1), 3 participants dropped out of the study due to unrelated medical issues, and 1 was lost to follow-up. Only data from participants who completed the study were included in analyses. Baseline characteristics for each group can be found in Table 1. No significant differences existed between groups for any of these variables. Dietary intake is summarized in Table 2. Compliance to the diet was excellent as assessed by dietary records and ketonuria (not reported). Energy intake (kcal) was reduced in all groups to a similar degree, yet macronutrient distribution during the intervention was substantially different for those consuming the LFD versus those who consumed the CRD, regardless of PRE. When depicted as carbohydrate:fat:protein, the macronutrient distribution of the intervention diet was: LFD=55:24:18, LFD&PRE=57:20:20, CRD=16:54:28, and CRD&PRE=12:56:31.
Data are presented for participants who completed the intervention as mean (standard deviation).
No significant differences were detected between groups for any of the above variables.
LFD, low-fat diet; PRE, progressive resistance exercise; CRD, carbohydrate-restricted diet; n, number of participants who completed the intervention; BMI, body mass index; HDL-C, high-density lipoprotein cholesterol; LDL-C, low-density lipoprotein cholesterol.
Data presented are for participants who completed the 12-week study.
Indicates significant time effect; differing superscripted letters indicate significant time×group interaction.
SD, standard deviation; LFD, low-fat diet; PRE, progressive resistance exercise; CRD, carbohydrate-restricted diet; CHO, carbohydrate; PTN, protein.
Anthropometrics and strength are summarized in Table 3. Compliance to the PRE program was excellent, as assessed by attendance (mean 94%) and by changes in strength. Weight loss was significant from baseline to week 12 in all groups, with no differences between groups (LFD, −18.0±7.4 lb; LFD&PRE, −19.8±12.8 lb; CRD, −20.2±8.0 lb; CRD&PRE, −22.7±6.0 lb). Although changes in FFM from baseline to week 12 were not different between groups (LFD, 6.1±2.8 lb; LFD&PRE, 5.6±5.2 lb; CRD: 4.7±5.4 lb; CRD&PRE, 5.1±4.3 lb), as depicted in Fig. 1, a trend was found between the LFD and the LFD&PRE groups as well as between the LFD and CRD groups for percentage of weight loss from appendicular FFM (the sum of FFM in both arms and both legs). Muscle quality at baseline and week 12 are depicted in Fig. 2. Muscle quality improved significantly only in the LFD&PRE and CRD&PRE groups (P<0.05).
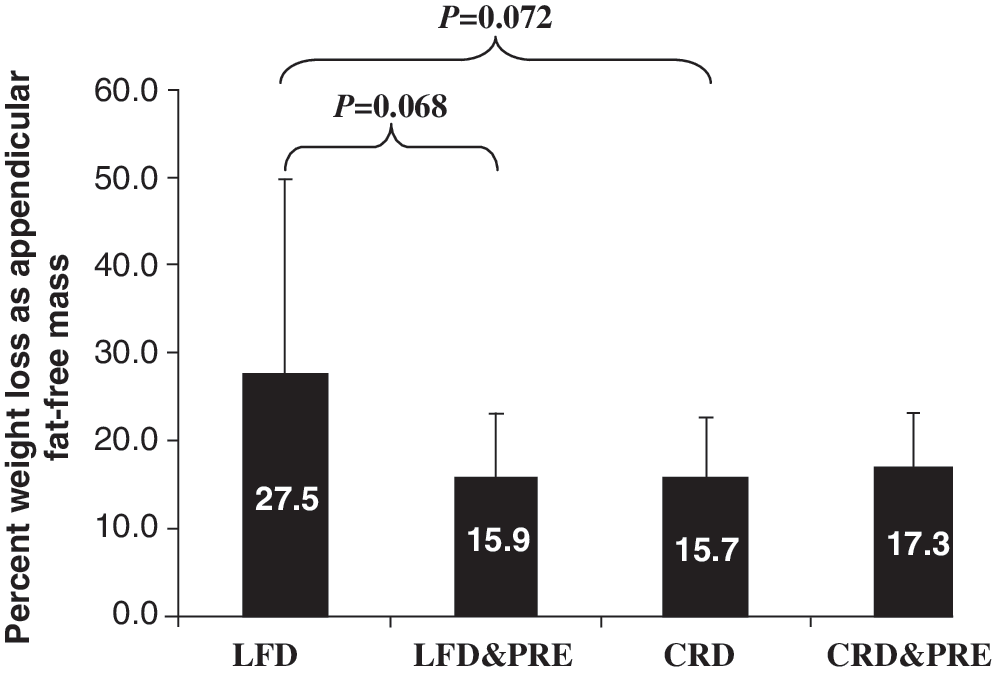
Percent of weight loss from appendicular fat-free mass from baseline to week 12. LFD, low-fat diet; PRE, progressive resistance exercise; CRD, carbohydrate-restricted diet.
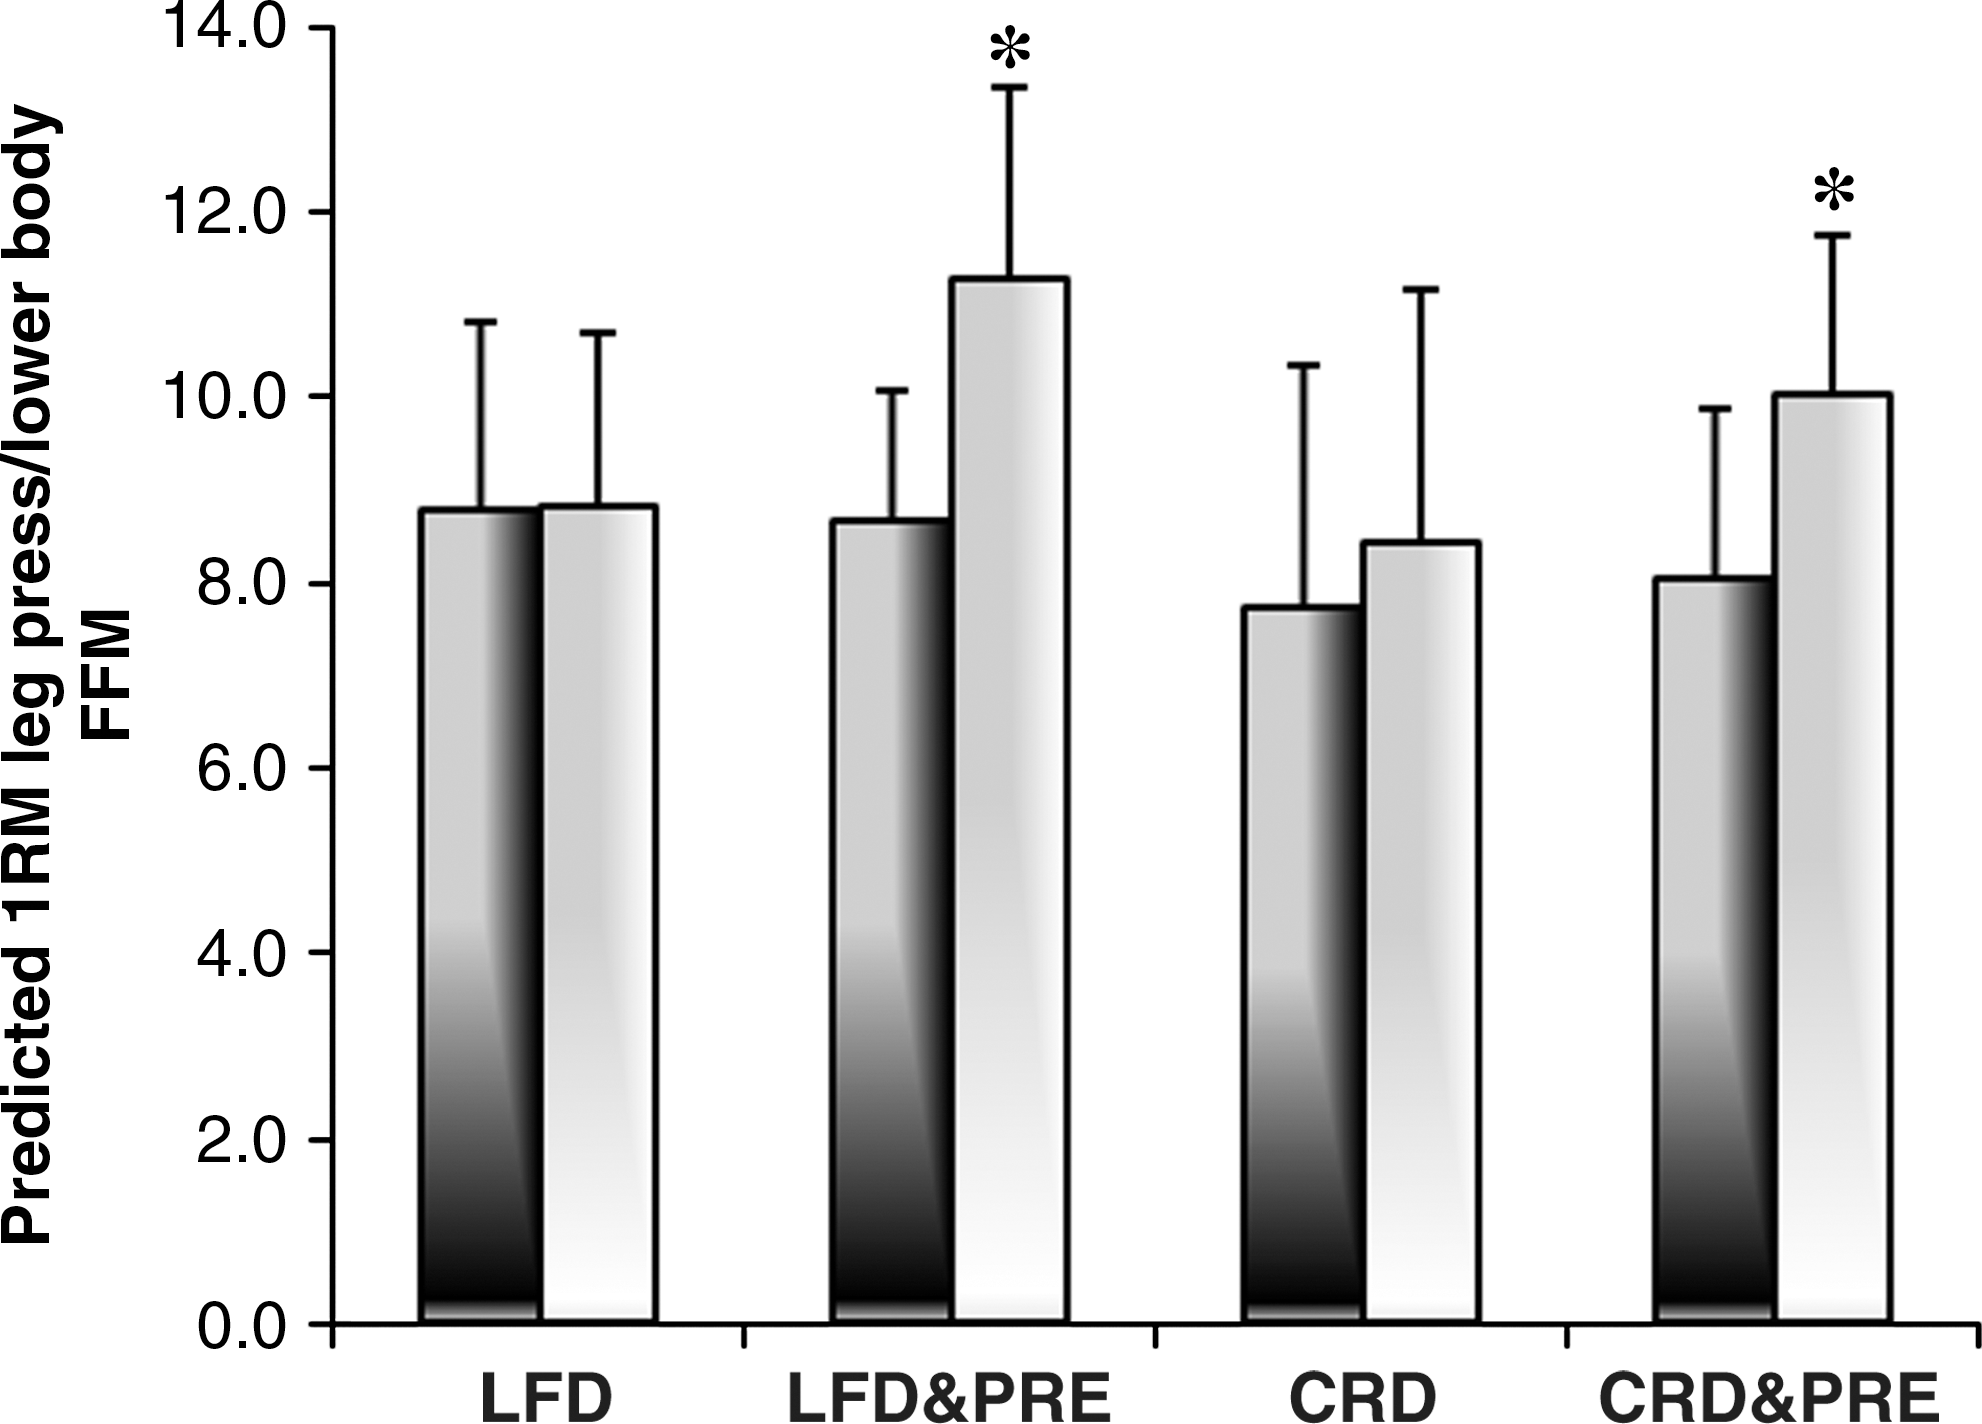
Muscle quality at baseline (dark gray) and week 12 (light gray). 1RM, 1 repetition maximum; FFM, fat-free mass; LFD, low-fat diet; PRE, progressive resistance exercise; CRD, carbohydrate-restricted diet.
Data are presented for participants who completed the intervention as mean (standard deviation).
Strength is the predicted one-repetition maximum for chest press (upper body) and leg press (lower body).
Significant main effect for time (P<0.01); differing superscripts within the same row indicate a significant×group interaction (P<0.05).
LFD, low-fat diet; PRE, progressive resistance exercise; CRD, carbohydrate-restricted diet; n, number of participants who completed intervention.
Systolic blood pressure (SBP) and diastolic blood pressure (DBP) decreased significantly in all groups, with no differences between groups. Fasting serum glucose was reduced significantly in all groups (LFD, −11.8±7.6 mg/dL; LFD&PRE, −3±11.0 mg/dL; CRD, −7.9±6.9; CRD&PRE, −8±11.5 mg/dL) with no differences between groups. Reduction in TAG was significantly greater in the LFD&PRE, CRD, and the CRD&PRE groups when compared to the LFD group (LFD, 3.1±31.8%; LFD&PRE, −15.3±21.6%; CRD, −28.0±29.5%; CRD&PRE, −36.6±18%). Figure 3 depicts the individual data for percent change in triglycerides from baseline to week 12 according to group. For HDL-C, a significant time×group interaction was found between the LFD group (−5.0±5.9 mg/dL) and the CRD&PRE (4.1±5.1 mg/dL) group (P<0.01), and a trend was found between the LFD group and the LFD&PRE group (0.3±7.5 mg/dL; P=0.082) and between the LFD group and the CRD group (0.9±5.1 mg/dL; P=0.062). At week 12, a total of 3, 6, 3, and 4 participants in the LFD, LFD&PRE, CRD, and CRD&PRE groups no longer met the diagnostic criteria for metabolic syndrome.
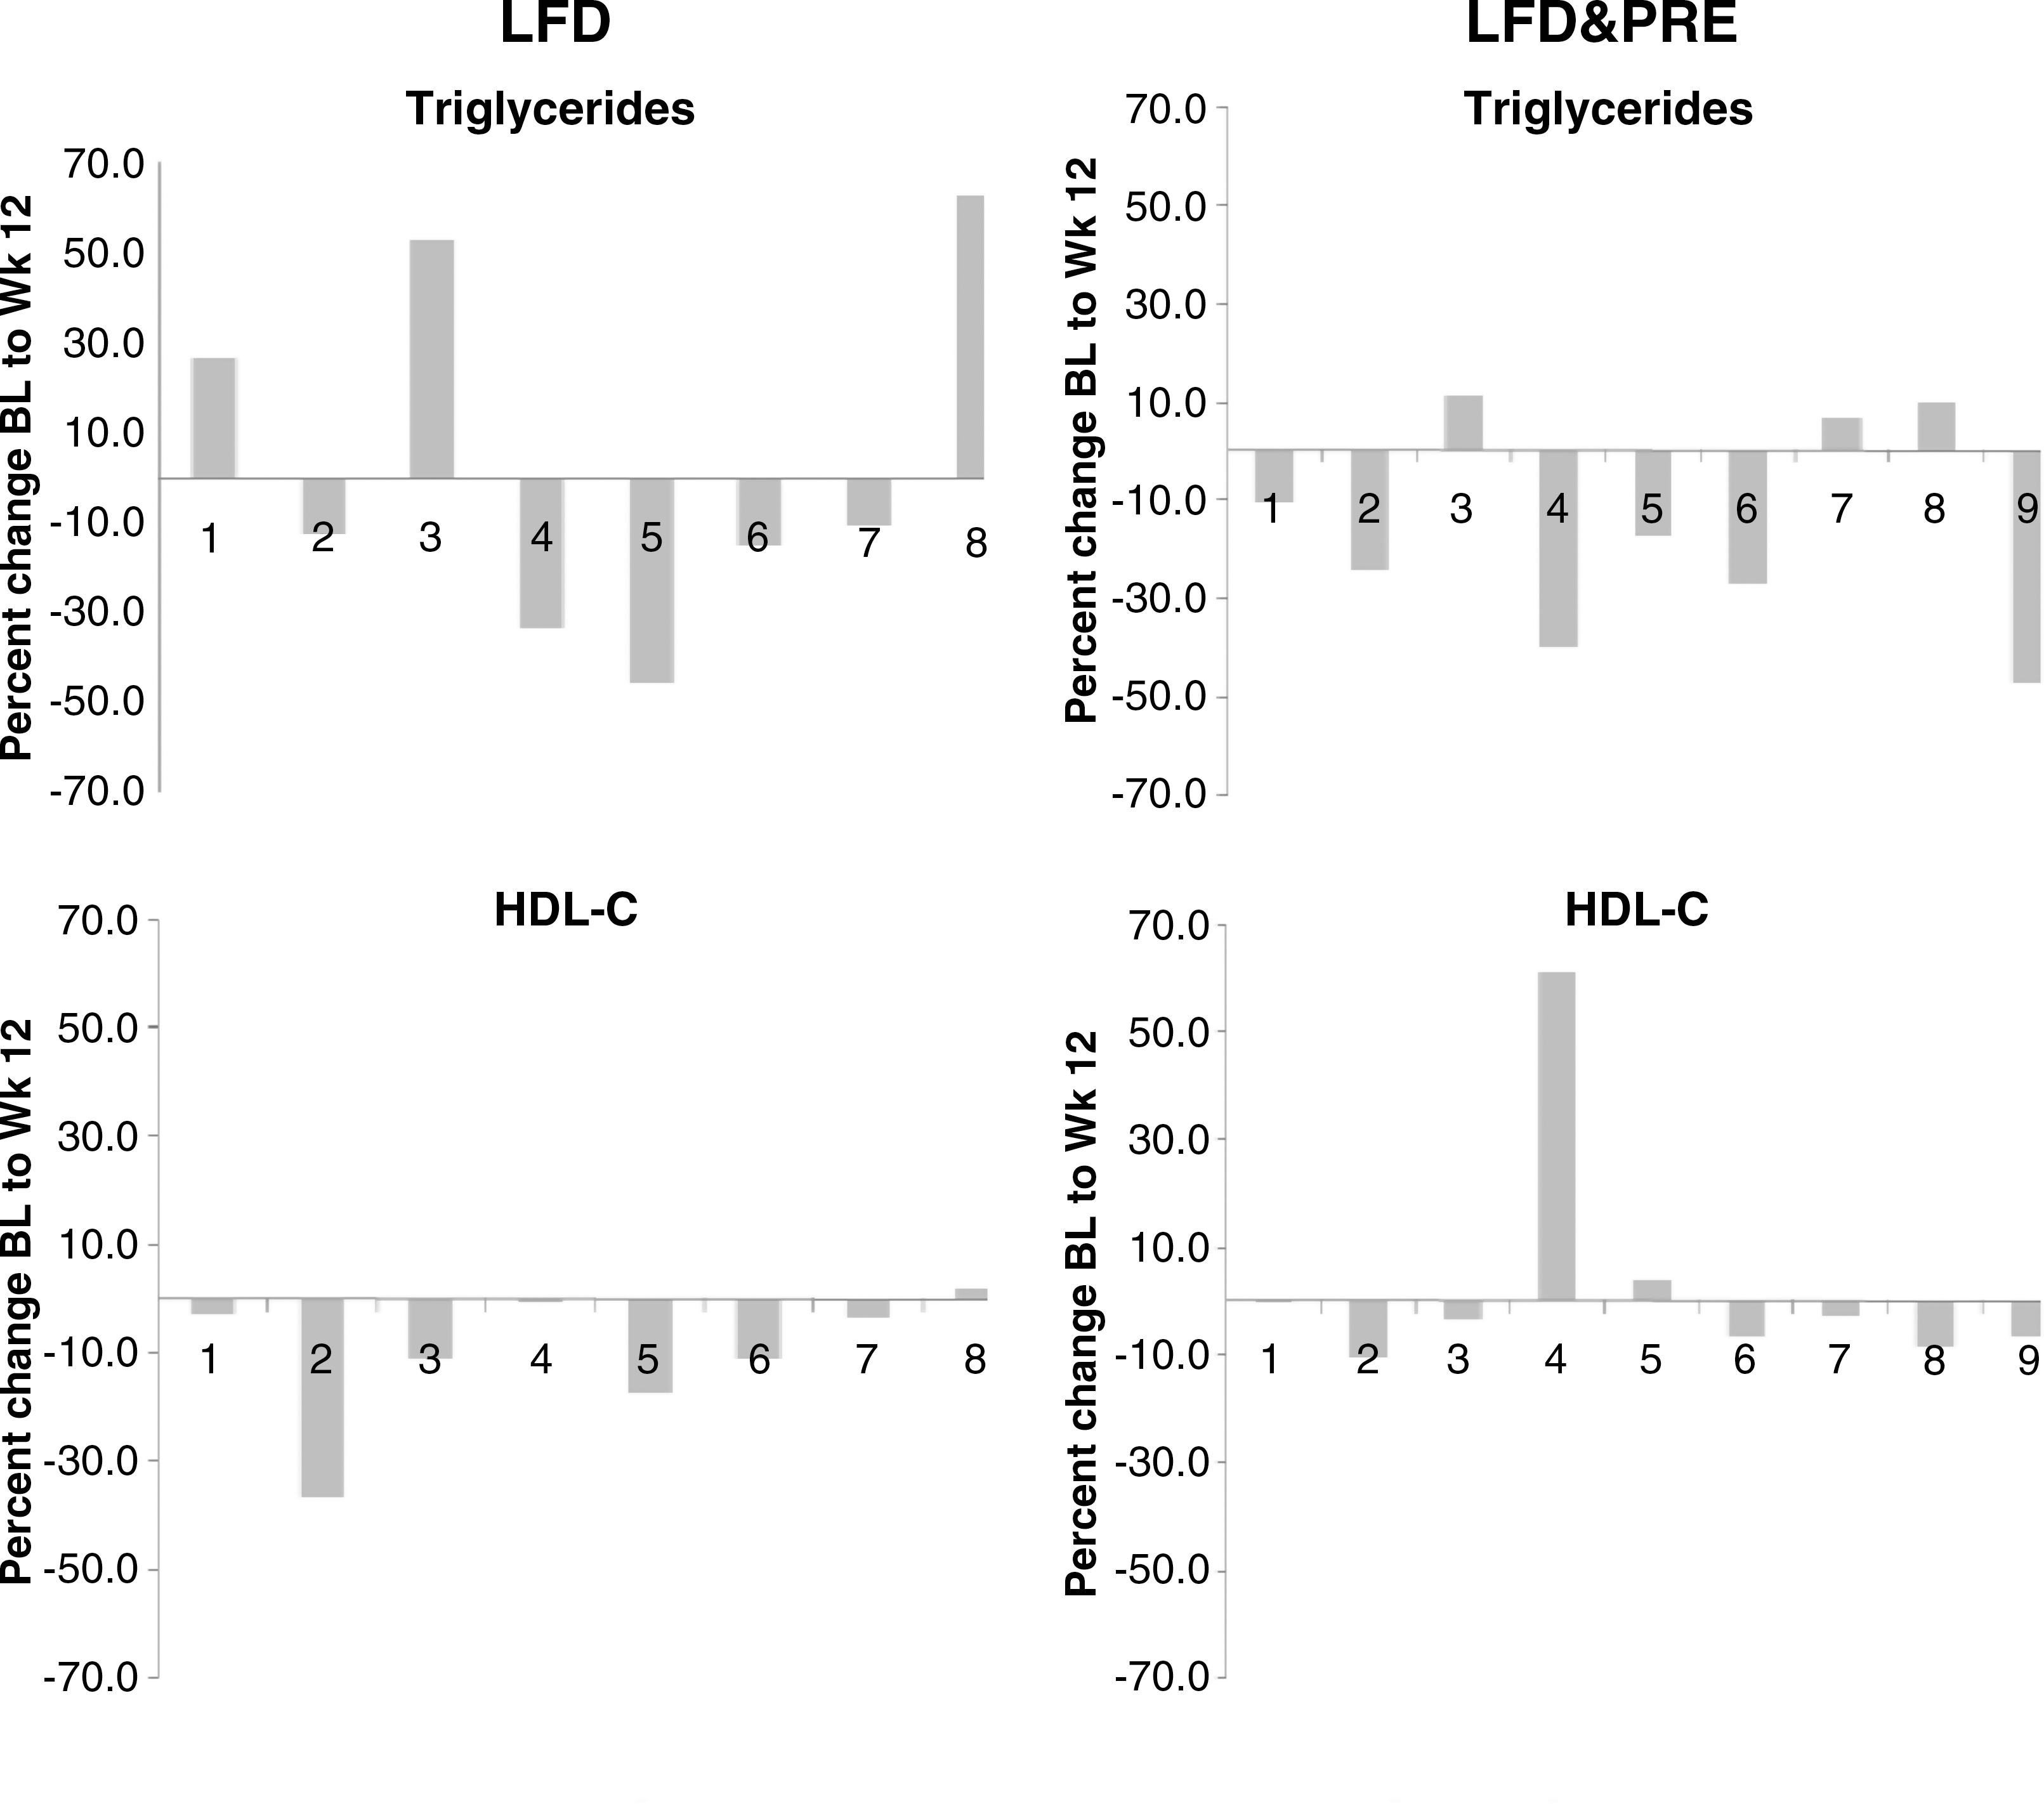
Individual data showing percent change in triglycerides and high-density lipoprotein cholesterol (HDL-C) from baseline to week 12. BL, baseline; LFD, low-fat diet; PRE, progressive resistance exercise; CRD, carbohydrate-restricted diet.

Discussion
The primary purpose of this study was to examine the effects of a 12-week LFD versus CRD with and without PRE on preservation of FFM in older men with the metabolic syndrome. Compliance to the diet and exercise program was excellent, as indicated by our dietary analyses and performance on strength testing. The macronutrient distribution of the intervention diets and changes in strength indicate that the prescribed diet and exercise programs were followed closely and as intended. The primary finding was that FFM was preserved to a similar degree in all groups; however, when examining the percent of weight loss that comes from appendicular FFM, trends indicate that the LFD may have a less favorable response when compared to the LFD&PRE and when compared to the CRD.
Approximately 32% of people 65 and older are considered obese, 13 and prevalence of metabolic syndrome increases with age, 1 prompting the recommendation for weight loss. However, skeletal muscle mass decreases approximately 33% between the ages of 50 and 80, even when weight remains stable. 14 As such, the preservation of FFM during weight loss is particularly important in the older population. FFM decreased in all groups in the current study, and, to a degree, similarly to what has been reported previously. Garrow and Summerbell 15 conducted a meta-analysis and determined that approximately 29% of diet-induced weight loss is from FFM, and that including exercise with a weight loss diet only 17% of weight loss would be expected to come from FFM. However, many of the studies included in the meta-analysis were conducted using younger adults. Frimel et al. 4 assigned older adults to either a weight loss diet, or a weight loss diet and multicomponent exercise, which resulted in 33% and 16%, respectively, of weight loss from FFM. Our exercise intervention included only PRE (no aerobic component), indicating that FFM can be preserved to at least a similar degree as with a weight loss diet that includes an aerobic exercise component.
Both the meta-analysis by Garrow and Summerbell and the intervention by Frimel et al. employed conventional weight loss diets; i.e., restriction of dietary fat and kcal. To our knowledge, ours is the first intervention to include a CRD in older men with metabolic syndrome. Given that the groups following a CRD lost a similar amount of FFM to the groups following a LFD, our findings do not support concerns that a CRD disproportionately affects FFM. 6 Furthermore, our findings indicate that a CRD alone preserves FFM similarly to a CRD&PRE and to a LFD&PRE, and a trend exists to indicate that a CRD may preserve appendicular FFM better than a LFD. That the CRD alone preserves FFM similarly to an intervention employing PRE 3 days per week is also interesting and bears future examination. Although establishing that a mechanism is not possible from the current intervention, it is possible that the ketosis experienced by the CRD may have preserved FFM, 16,17 and that the strength training performed by the LFD&PRE group was an alternative and sufficient stimulus to similarly preserve FFM. Another possibility is that, because protein intake was somewhat higher in the groups who consumed the CRD (although no statistical differences were detected), the dietary protein may have acted as a sufficient energy source under the hypocaloric situation to prevent scavenging of FFM.
Muscular strength is widely recognized as an important factor in maintaining independence in older age. Muscle weakness has been repeatedly shown as an independent risk factor for high mortality in older adults. 18,19 Visser et al. 20 found that reduced muscle attenuation (assessed via computed tomography; indicator of fat infiltration into the muscle) was associated with poorer lower extremity performance independent of muscle area. Age-related fatty infiltration of skeletal muscle is also associated with the incidence of mobility disability 20 and insulin resistance. 21,22 In the present study, lower body strength increased by 23% and 19% in the LFD&PRE group and the CRD&PRE group, respectively. Muscle quality also significantly increased in these groups, by 26 and 28% in the LFD&PRE and CRD&PRE groups, respectively. Modest, nonsignificant changes occurred in the LFD group and the CRD group.
Our findings are similar to previous reports in a similar population. Villareal et al. 23 examined the effects of weight loss and exercise therapy on physical function and body composition in obese (BMI ≥30) community-dwelling adults 65 years and older. Participants were randomly assigned to either a control group or an intervention group for 26 weeks. Participants in the intervention group were instructed to consume a hypocaloric LFD and participated in a multicomponent exercise program three times per week for 90 min per session. Weight loss in this group was approximately 8.4% of total body weight, with approximately 15% of weight loss coming from FFM. Lower body strength increased by approximately 48%, indicating improved muscle quality.
The careful adherence to the prescribed diets is a key component in the present study; several studies have assigned participants to either a LFD or CRD, yet dietary analyses revealed that the intended macronutrient distribution was not achieved, 24,25 making the results more applicable to dietary effectiveness than about dietary efficacy. Interestingly, participants in the CRD and the CRD&PRE groups spontaneously reduced energy intake despite ad libitum conditions, which has been shown previously 26,27 and was first described by LaRosa in 1980. 28 Reductions in energy intake for these groups was similar to what was prescribed and achieved in the LFD group and the LFD&PRE group. Also of interest was that absolute fat intake was unchanged between habitual diet and the intervention diet for the groups following the CRD. The dramatic changes in body weight and lipids in these groups without any significant change in fat intake questions the conventional emphasis placed on dietary fat restriction for weight management and improvement in the diagnostic criteria for metabolic syndrome.
A secondary purpose of the study was to examine the effects of these treatments on the diagnostic criteria for the metabolic syndrome. Waist circumference, blood pressure, and glucose were significantly improved in all groups, with no differences between groups, as has been previously reported. As such, with respect to these three diagnostic criteria, it appears that both dietary interventions, with or without PRE, are efficacious. We did find that the groups following a CRD had significantly better improvements in TAG as compared to the group following the LFD, which is similar to previous reports. 5 However, the LFD&PRE group experienced similar improvements in TAG as the two groups who followed the CRD, indicating a potential role for PRE to enhance the efficacy of a LFD. Similarly, the LFD group experienced a significant reduction in HDL-C, whereas the LFD&PRE, CRD, and CRD&PRE groups experienced slight increases in HDL-C. These findings are suggestive of a similar stimulus for improved circulating lipids from dietary carbohydrate restriction and resistance exercise training that is perhaps in response to repetitive remodeling of skeletal muscle glycogen stores. Several intracellular signaling molecules involve in glucose transport and metabolism, including 5′-adenosine monophosphate–activated protein kinase (AMPK) and interleukin-6 (IL-6), are sensitive to depletion and saturation of glycogen stores. 29,30 Skeletal muscle is a major peripheral depository for insulin-stimulated glucose disposal after a meal. 31 Thus, it is possible that favorable adaptations in skeletal muscle carbohydrate metabolism could facilitate a diversion of dietary carbohydrate to muscular glycogen synthesis and limit substrate availability for hepatic TAG synthesis. This theory is supported by reports of greater muscle glycogen synthesis and reduced hepatic TAG synthesis after a mixed meal in insulin-sensitive individuals when compared to insulin-resistant individuals. 32
Although carefully controlled, this study is limited by its somewhat short duration and small sample size. We also acknowledge that the PRE program may have provided unique stimuli that would compliment weight maintenance differently from weight loss, and that specific, unique effects of PRE cannot be elucidated from the study as designed. Future studies should employ methods to determine the mechanisms responsible for FFM preservation during weight loss.
In conclusion, our study provides evidence that, when performing PRE during weight loss, LFD and CRD preserve FFM equally well. Furthermore, our results suggest that a CRD alone may preserve appedicular FFM similarly to a diet accompanied by PRE. Our findings also suggest that PRE is an important component of a LFD during weight loss, perhaps enhancing the effects of the diet alone on the preservation of FFM and the diagnostic criteria for the metabolic syndrome.
Footnotes
Acknowledgment
This study was funded by the Springfield College Faculty Research Fund, Buxton Professor of Physical Education, Springfield College.
Author Disclosure Statement
No competing financial interests exist.