
Abstract
Background:
Whether hyperuricemia and microalbuminuria are separately associated with prehypertension among Chinese Han women is controversial.
Methods:
Information was collected from physical examinations, personal interviews, and blood and urine samples. Associations of hyperuricemia and microalbuminuria with hypertension and prehypertension were analyzed by using multivariate nonconditional logistic regression models in 1,773 women aged ≥30 years.
Results:
Both average systolic and diastolic blood pressure increased with uric acid and urinary albumin-to-creatinine ratio levels (all trend P values<0.001). When subjects with microalbuminuria or using antihypertensive medication were excluded, individuals with a uric acid level in the 2nd, 3rd, and 4th quartiles of uric acid were more likely to have prehypertension than those with a uric acid level in the lowest quartile [odds ratio (OR)=1.50, 95% confidence interval (CI) 1.02–2.19; OR=1.69, 95% CI 1.12–2.56; OR=2.67, 95% CI 1.57–4.53). After exclusion of subjects with diabetes or hyperuricemia or using antihypertensive medication, compared with normotensives, individuals with high blood pressure status of prehypertension were more likely to have microalbuminuria (OR=1.83, 95% CI 1.12–2.99). Additionally, microalbuminuria was positively associated with blood pressure levels (trend P value<0.001).
Conclusions:
Hyperuricemia and microalbuminuria are separately and independently associated with prehypertension among Chinese Han women.
Introduction
In this study, we examine the possible associations of hyperuricemia and microalbumunria with prehypertension in a representative sample among Chinese Han women residing in Suzhou, China.
Materials and Methods
Subjects
We conducted a cross-sectional study in a traditional but economically developed district of the city of Suzhou, Jiangsu Province, China, from January to May, 2010. Residents in this area maintain a traditional diet style (dominated by sweets) and have a relatively higher standard of living. Four urban communities and four rural villages in the district were selected via multiphase cluster random sampling to function as research fields. The admission criteria were all of the following: (1) Age, ≥30 years; (2) ethnicity, Han; (3) gender, female; (4) no clinical evidence of end-organ damage 14 at the screening visit; (5) no chronic renal disease or tumors. The exclusion criteria were as follows: (1) Clinical suspicion of urinary tract infection; (2) having used UA-lowering medication within the last 2 weeks; (3) received treatment of albuminuria within the last 2 weeks; (4) in menstrual period. In total, 2,338 persons met the selection criteria. However, only 1,896 women (81% of participation rate) participated in the study. After exclusion of 123 individuals for various reasons, including lack of urine samples (95), lack of blood samples (8), lack of both urine and blood samples (5), and subjects with macroalbuminuria (15), 1,773 subjects were finally eligible for inclusion in the current analysis. This study was approved by the Soochow University Ethic Committee. Written informed consent was obtained for all study participants.
Methods
Data on demographic information, lifestyle risk factors, family history of hypertension, and personal medical history were obtained using a standard questionnaire administered by trained staff. Body weight and height were measured by using a regularly calibrated stadiometer and balance-beam scale with participants wearing light clothing and no shoes. Body mass index (BMI) was calculated as weight in kilograms divided by the square of the height in meters. Waist circumference (WC) was measured at the level of 1 cm above the umbilicus. Three sitting consecutive blood pressure measurements (3 min between each) were taken by trained staff using a standard mercury sphygmomanometer according to a standard protocol, after the subjects had been resting for 30 min. 14 The first and fifth Korotkoff sounds were recorded as systolic blood pressure (SBP) and diastolic blood pressure (DBP), respectively. The mean of the three readings was used in analysis.
Blood samples were obtained in the morning by venipuncture after a requested overnight fast (at least 8 h). All plasma and serum samples were frozen at −80°C until laboratory testing. Total cholesterol (TC), triglycerides (TG), high-density lipoprotein cholesterol (HDL-C), low-density lipoprotein cholesterol (LDL-C), fasting plasma glucose (FPG), and UA were measured for all subjects. All of the biochemical indexes were analyzed enzymatically on a Hitachi 7020 Automatic Biochemical Analyzer using commercial reagents. Hyperuricemia was most commonly defined as UA>357 umol/L in women. 15 Diabetes was defined as FPG≥7.0 mmol/L and/or use of hypoglycemic medication in the last 2 weeks. 16 Three discontinuous 5-mL midstream urine specimens were obtained from the first-morning void urine for every subject in a week. Urine creatinine and albumin in fresh urine samples were determined within 24 h after collection in the laboratory of Center for Disease Prevention and Control of Jinchang District. Urine albumin was assessed using a nephelometric procedure with a specific anti-albumin monoclonal antibody, and urine creatinine was assessed using the Jaffe method. The urinary albumin-to-creatinine ratio (ACR) was calculated as follows: ACR (mg/g)=urine albumin (mg/dL)/urine creatinine (g/dL). The National Kidney Foundation 17 has recommended that females with an ACR of 25–355 mg/g should be diagnosed as having microalbuminuria. In our study, only those with all the three ACR values of 25–355 mg/g were categorized as having microalbuminuria.
Statistical analysis
All subjects were divided into three groups: Normotensive, prehypertensive, and hypertensive subjects. For continuous variables with a normal distribution, means and standard deviations were calculated for each of the three groups individually. Comparisons in means among the three groups and between each two groups were performed by using variance analysis and Student–Newman–Keuls, respectively. For continuous variables with a skewed distribution, medians (interquartile range) were calculated. Comparisons in medians among the three groups and between each two groups were performed by using the Wilcoxon rank sum test. Rates for categorical variables were calculated and compared among the three groups and between each two groups by using the chi-squared test and chi-squared partitioning. Consequently, participants were divided into quartiles of UA values. Odds ratio (OR) and 95% confidence interval (CI) for prehypertension and hypertension, compared with normotension, were calculated for upper quartiles of UA with the lowest quartile as a reference, using two multivariable nonconditional logistic regression models. In model 1, total subjects were included; in model 2, subjects with microalbuminuria or use of antihypertensive medication were excluded. In the two models, age, family history of hypertension, cigarette smoking, alcohol intake, high-salt diet, high-fat diet, WC, TC, TG, HDL-C, and FPG were adjusted. The presence of linear associations between UA and ORs of hypertension and prehypertension were tested using the median of UA in each quartile as a continuous variable in the multivariate logistic models. Blood pressures were further categorized into four levels: Normotension, low blood pressure status of prehypertension (SBP/DBP of 120–129/80–84 mmHg), high blood pressure status of prehypertension (SBP/DBP of 130–139/85–89 mmHg), and hypertension. 18 ORs and 95% CI values of microalbuminuria were calculated for the remaining categories, with normotension as a reference. We then performed three multivariable nonconditional logistic regression models. In the first model, total subjects were included; in the second model, subjects with diabetes were excluded; in the third model, subjects with hyperuricemia or diabetes or use of antihypertensive medication were excluded. The linear association between blood pressure status and microalbuminuria was evaluated using the blood pressure categories as a continuous variable in the multivariate logistic regression models. The level of significance was defined as P<0.05. Statistical analyses were conducted using SAS statistical software (version 9.1; SAS Institute Inc, Cary, NC).
Results
Baseline characteristics of participants
Among 1,773 subjects (54.00±10.39 years) included in current analysis, 721 (40.67%) individuals were found to have hypertension and 771 (43.49%) had prehypertension. As shown in Table 1, the characteristics of the study subjects, such as means of age, BMI, WC, UA, TC, TG, LDL-C, HDL-C, FPG, and ACR, differed significantly among the three groups. Subjects with prehypertension were more likely to be older, have higher BMI, WC, UA, TC, TG, LDL-C, FPG, and ACR values, and have lower HDL-C values compared with those with normotension. Similarly, subjects with hypertension were more likely to be older, have higher BMI, WC, UA, TC, TG, LDL-C, FPG, and ACR values, and have lower HDL-C compared with subjects with prehypertension. Microalbuminuria and hyperuricemia were more common in hypertensives than in prehypertensives, and in prehypertensives than in normotensives. No significant differences in rates of smoking, drinking, high-salt diet, high-fat diet, and family history of hypertension were found among the three groups.
All values are expressed with median (interquartile range) unless otherwise noted.
Current cigarette smoking was defined as having smoked at least one cigarette per day for 1 year or more. Current drinking was defined as consuming one or more alcoholic drinks per week during the last 3 years. High-fat diet was defined as self-reported consuming meat dish at least once per day. High-salt diet was defined as consuming at least 12 g sodium chloride per day.
Hypertension was defined as SBP≥140 mmHg and/or DBP≥90 mmHg and/or use of antihypertensive medication within the last 2 weeks; prehypertension was defined as 120≤SBP≤139 mmHg and/or 80≤DBP≤89 mmHg and no use of antihypertensive medication within the last 2 weeks; and normotension was defined as SBP<120 mmHg and DBP<80 mmHg and no use of antihypertensive medication within the last 2 weeks. 19
Compared with normotension, P<0.05.
Compared with prehypertension, P<0.05.
FHH, family history of hypertension; BMI, body mass index; WC, waist circumference; UA, serum uric acid; TC, total cholesterol; TG, triglyceride; HDL-C, high-density lipoprotein cholesterol; LDL-C, low-density lipoprotein cholesterol; FPG, fasting plasma glucose; ACR, urinary albumin-to-creatinine ratio.
Uric acid and prehypertension/hypertension
Participants were subsequently divided into quartiles of UA values. ORs of prehypertension and hypertension for each quartile were calculated, with normotension as the dependent variable, as shown in Table 2. After adjusting for important covariates, such as age, smoking, alcohol drinking, family history of hypertension, high-fat diet, high-salt diet, WC, TC, TG HDL-C, and FPG, ORs of prehypertension for upper quartiles of UA were all significant compared with the lowest quartile. There was a dose–response relationship between UA and ORs of prehypertension. Similarly, ORs of hypertension significantly increased with UA levels, although the OR for hypertension for the 2nd quartile was not significantly higher than the lowest quartile. Subsequently, as shown in Fig. 1, subjects with microalbuminuria or use of antihypertensive medication were excluded, ORs of prehypertension and hypertension for upper quartiles of UA were all still significant, and the dose–response relationships persisted.
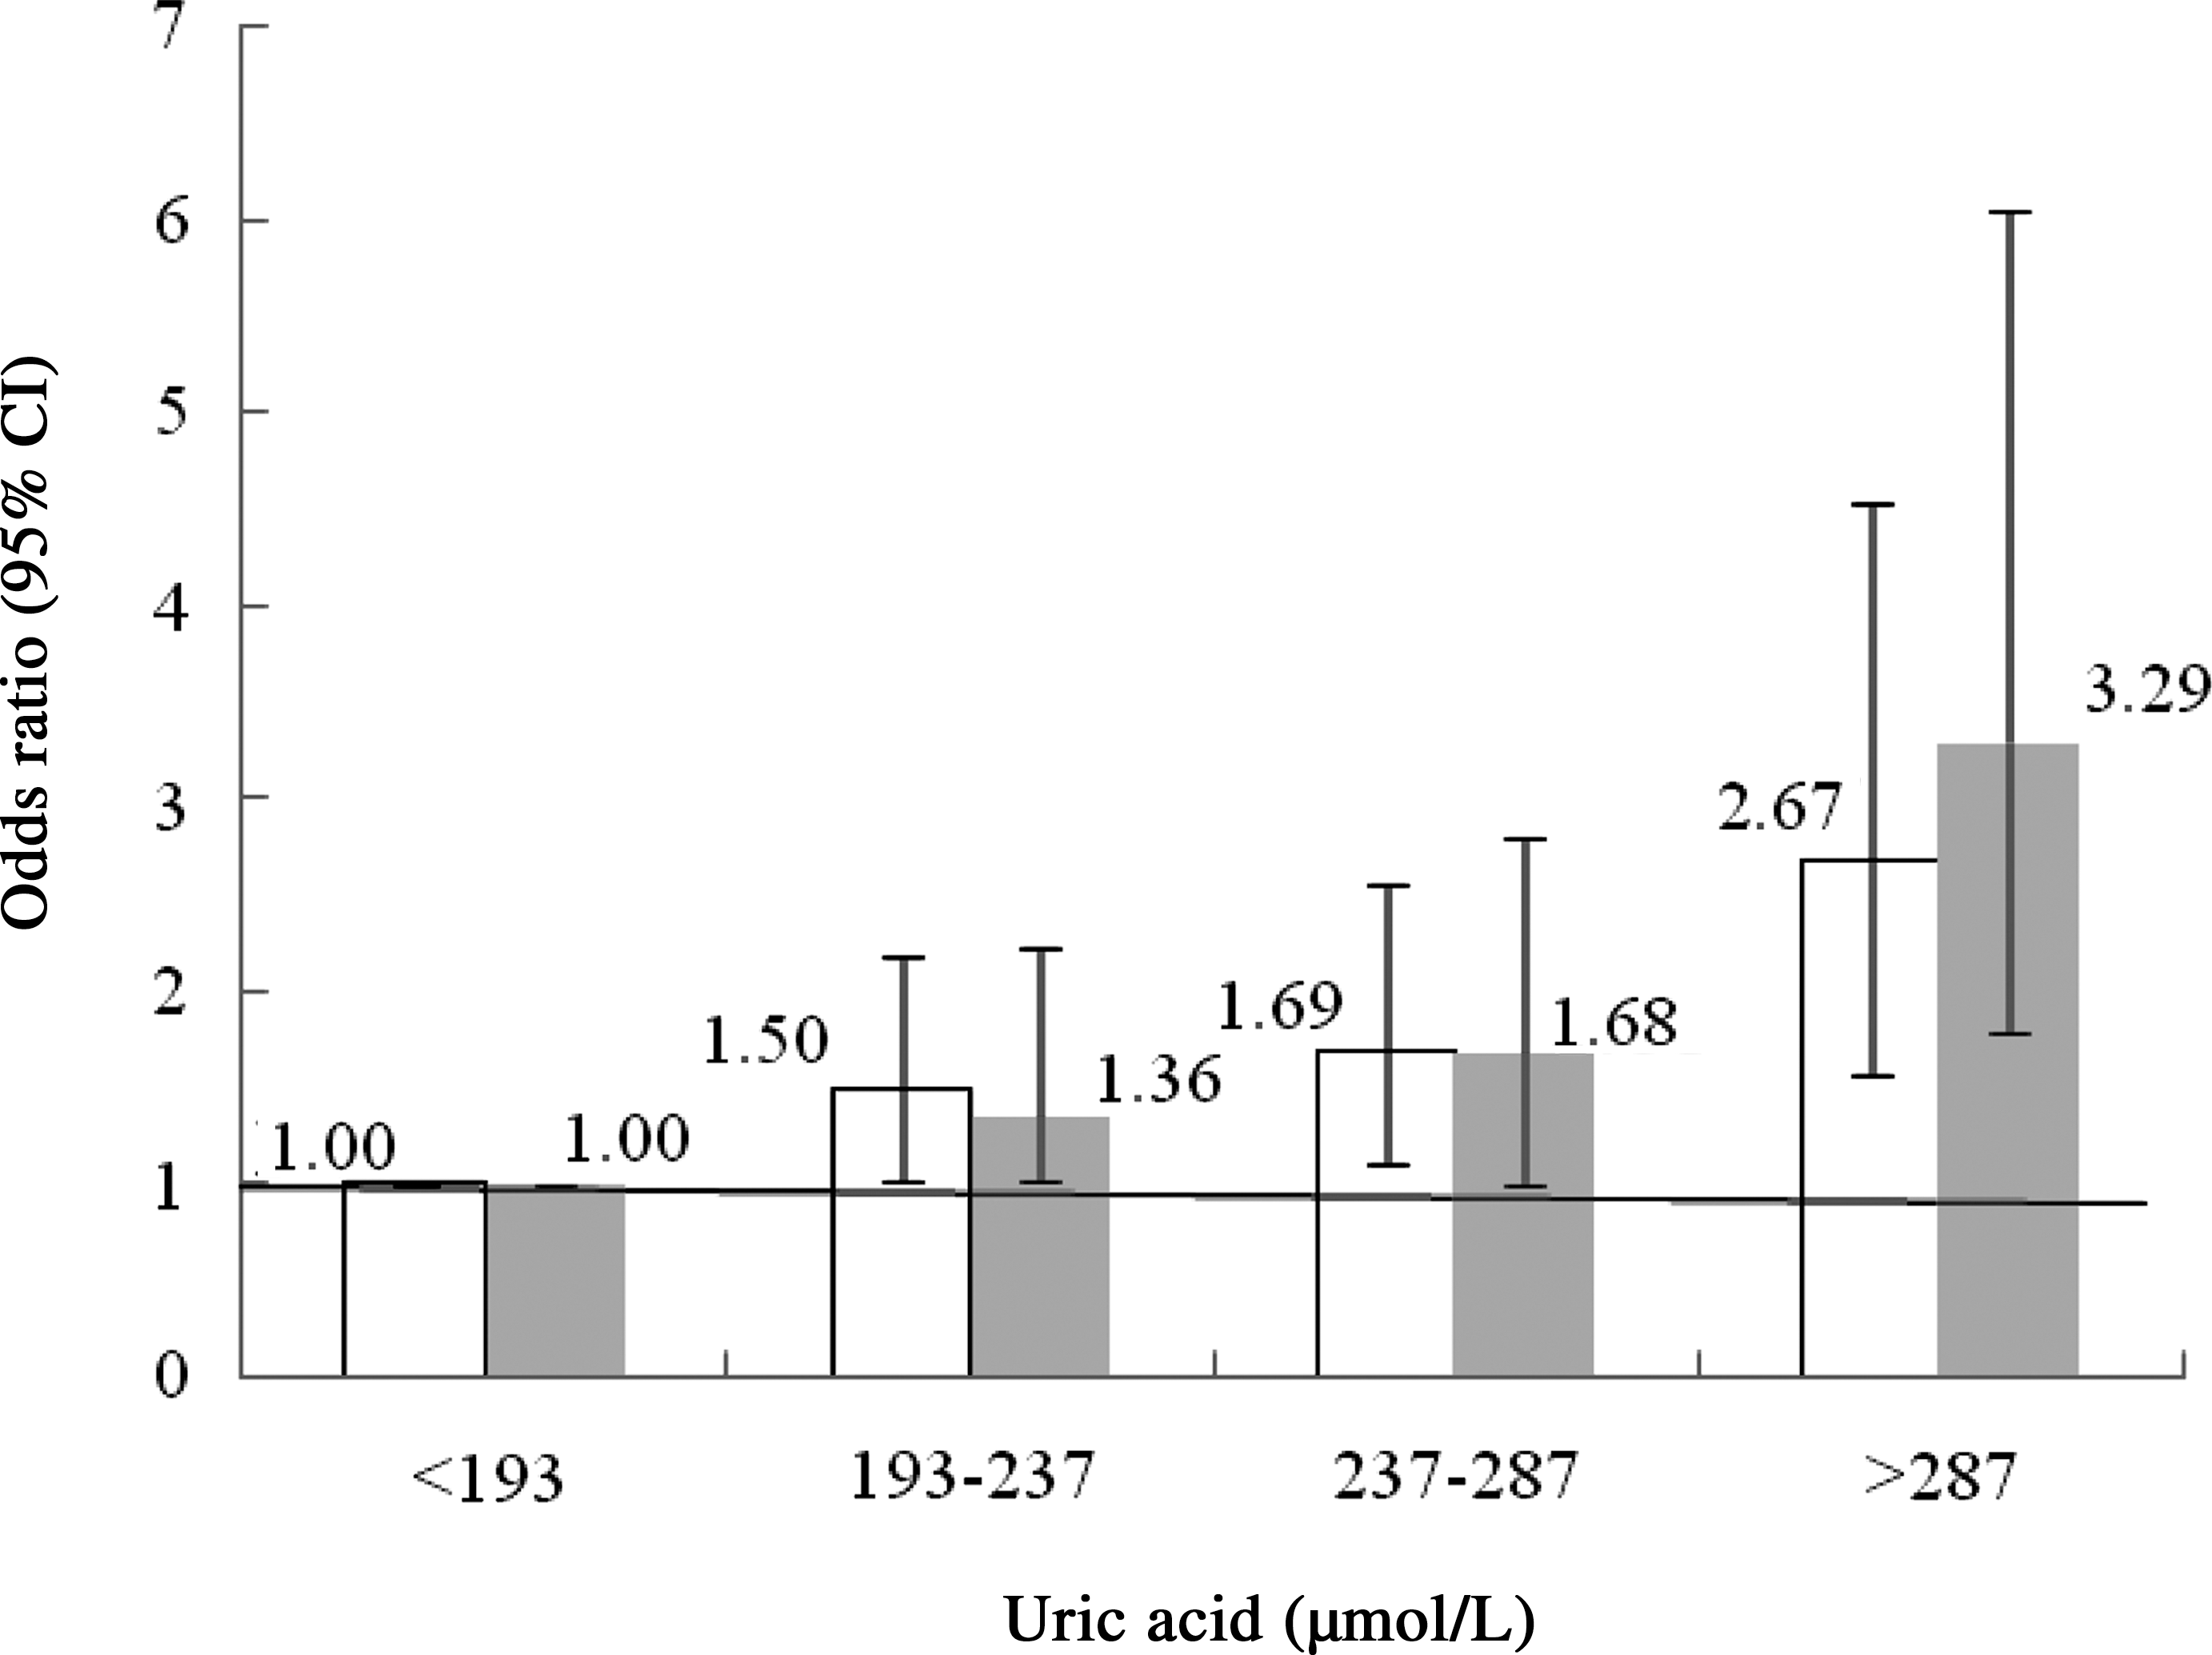
Multivariate adjusted odds ratio [95% confidence interval (CI)] of prehypertension (white bars) and hypertension (gray bars) crossing uric acid quartiles in subjects without microalbuminuria and no use of antihypertensive medication. In this model, subjects with microalbuminuria or use of antihypertensive medication were excluded, and the dependent variable and adjusted values were the same as that shown in Table 2.
Adjusted values included: age, cigarette smoking, alcohol intake, family history of hypertension, high-salt diet, high-fat diet, waist circumference, total cholesterol, triglyceride, high-density lipoprotein cholesterol, and fast plasma glucose.
Subjects with hypertension were excluded whether or not prehypertension was served as the dependent variable.
Subjects with prehypertension were excluded whether or not hypertension was served as the dependent variable.
CI, confidence interval.
Microalbuminuria and prehypertension/hypertension
Participants were further divided into four categories depending on their blood pressure status: Normotension, low blood pressure status of prehypertension, high blood pressure status of prehypertension, and hypertension. ORs of microalbuminuria for each blood pressure category are shown in Table 3. After adjusting for age, cigarette smoking, alcohol intake, family history of hypertension, high-fat diet, high-salt diet, WC, TC, TG, and HDL-C, ORs of microalbuminuria for high blood pressure status and hypertension were significantly higher compared with normotension. A dose–response relationship was observed between ORs of microalbuminuria and blood pressure status, although OR of microalbuminuria for low blood pressure status was not significantly higher than that for normotension. When subjects with diabetes were excluded, the dose–response relationship between microalbuminuria and blood pressure status continued, despite the nonsignificant OR of microalbuminuria for low blood pressure status. And ORs of microalbuminuria for high blood pressure status and hypertension remained significantly higher than that for normotension. Furthermore, as shown in Fig. 2, when subjects with hyperuricemia or use of antihypertensive medication were further excluded, the OR of microalbuminuria for low blood pressure status was not significant either, compared with normotension. On the other hand, ORs of microalbuminuria for high blood pressure status and hypertension were significant and positively increased with increase of blood pressure status.
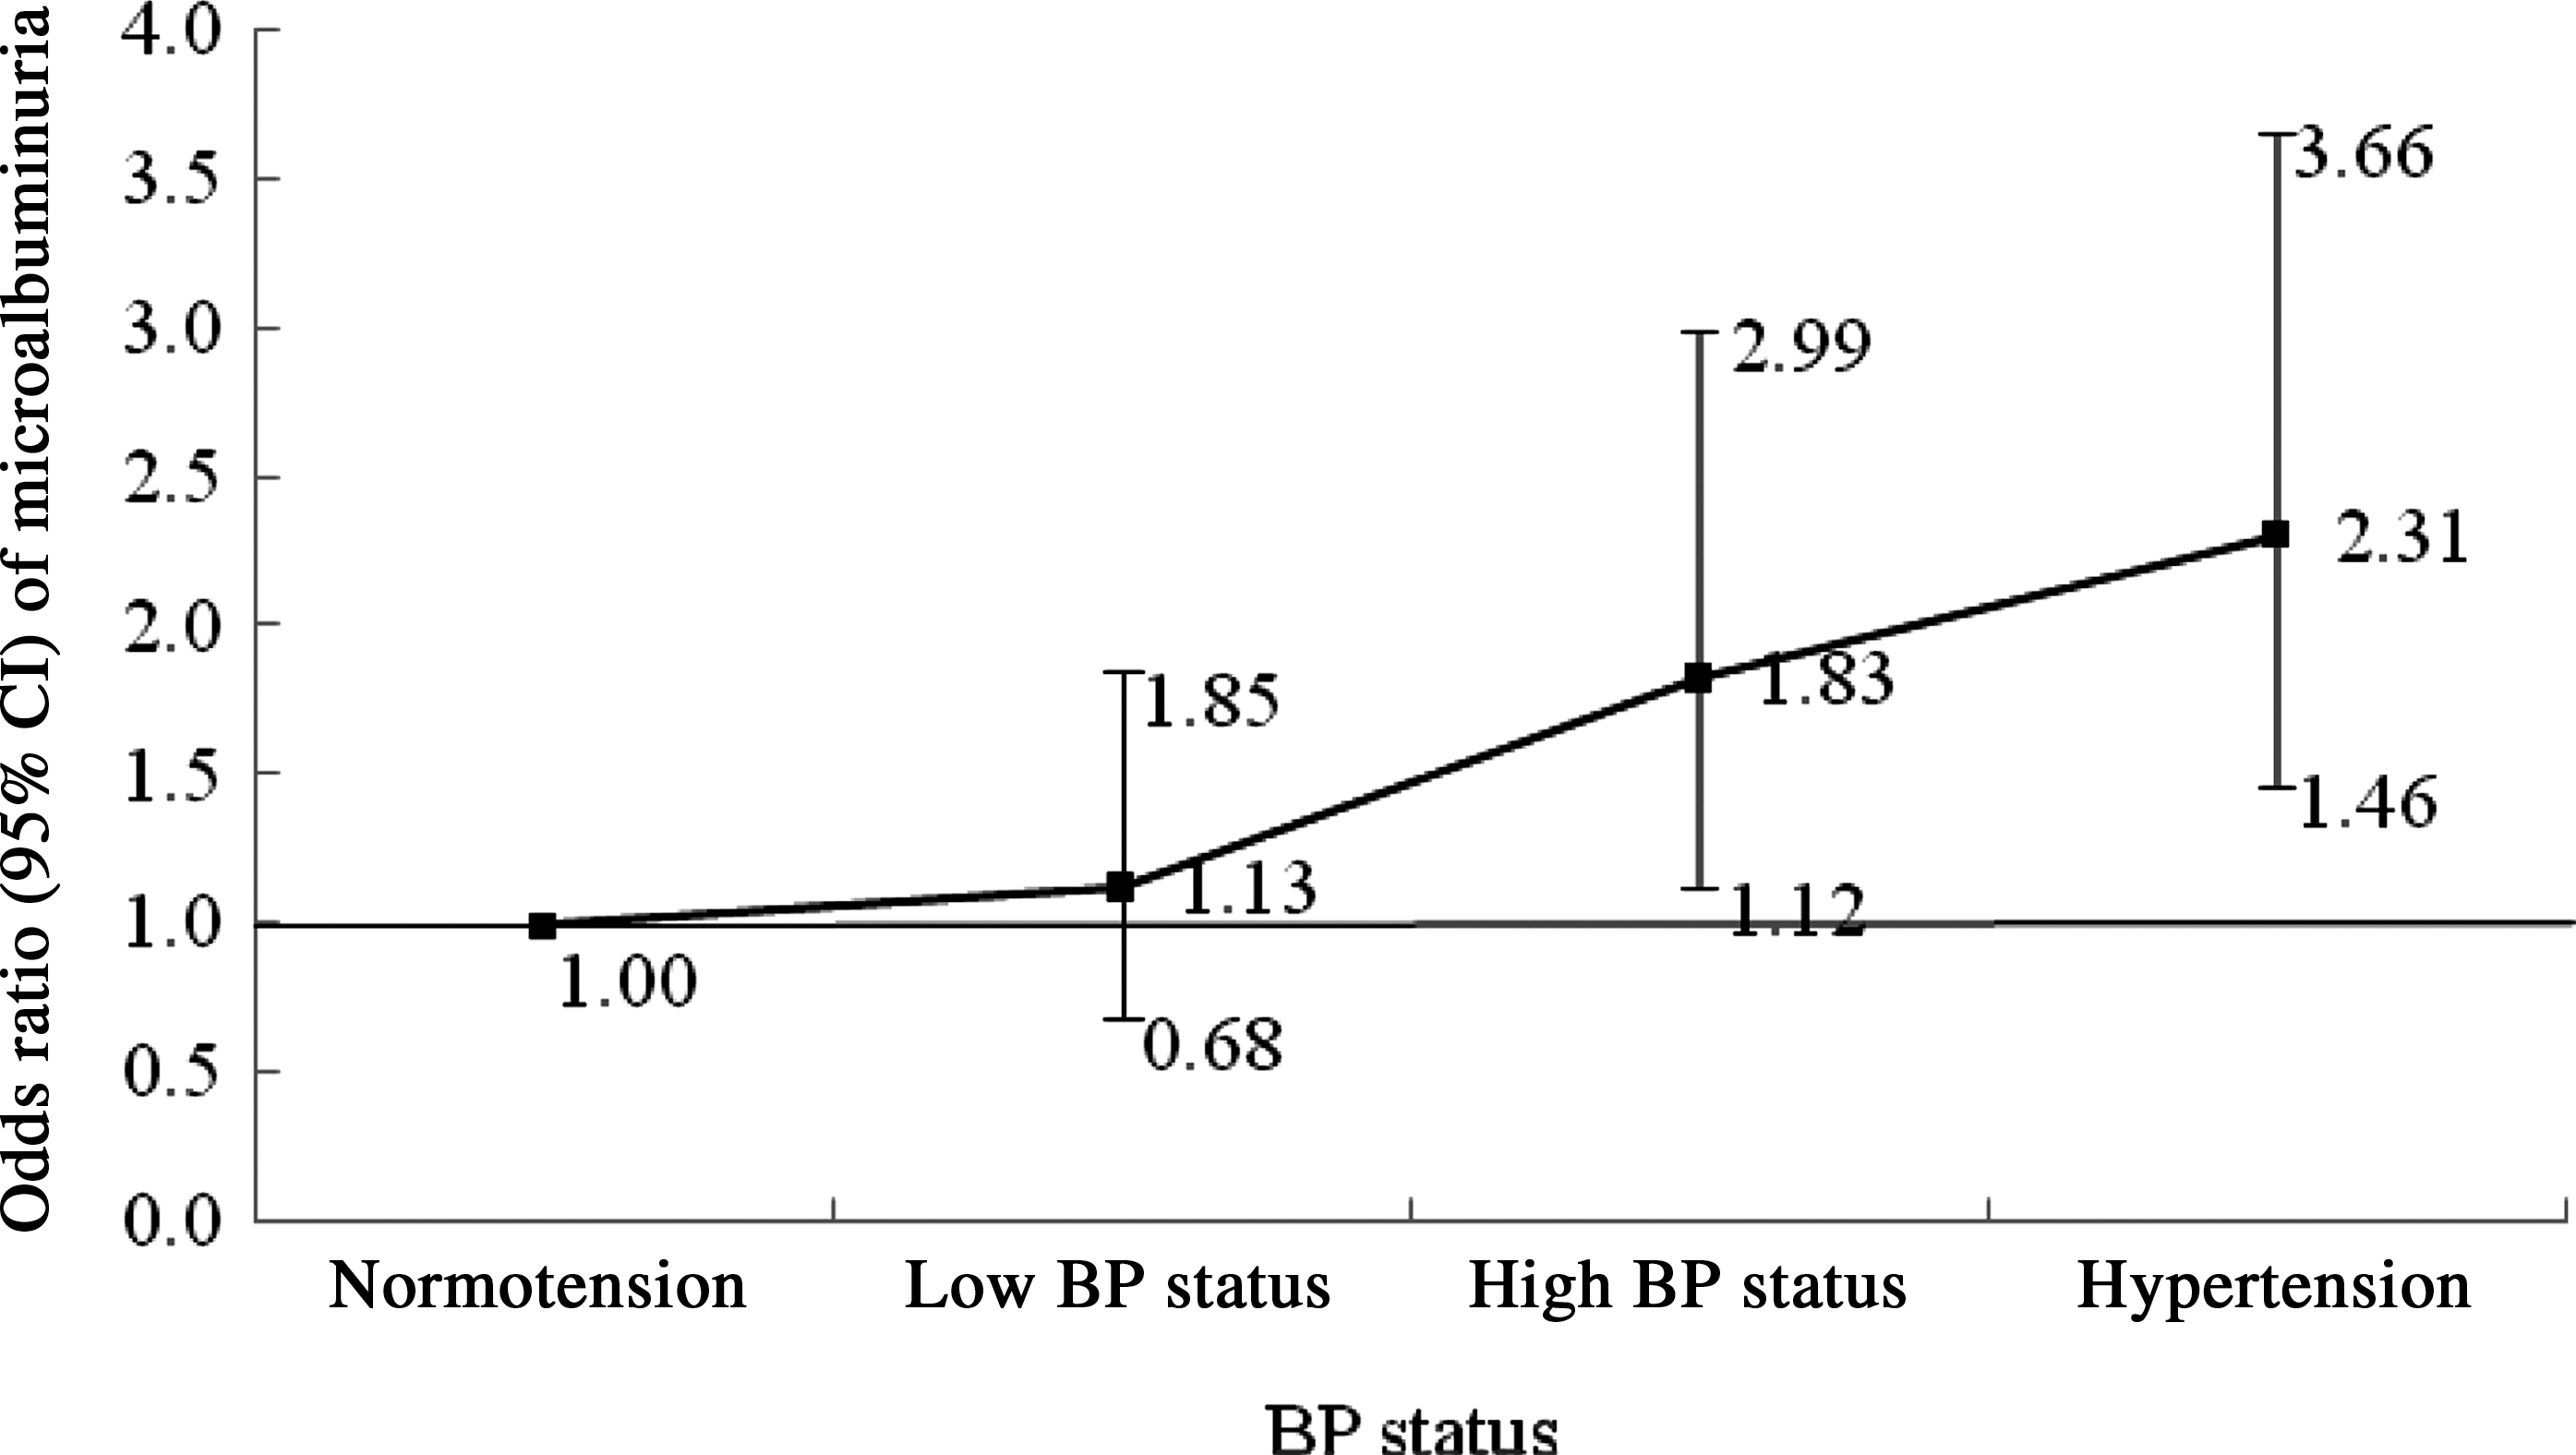
Multivariate adjusted odds ratio and 95% confidence interval (CI) of microalbuminuria by increasing blood pressure (BP) status among subjects without diabetes and hyperuricemia and no use of antihypertensive medication. In this model, subjects with diabetes or hyperuricemia or use of antihypertensive medication were excluded, and the adjusted values were the same as that shown in Table 3.
Adjusted values included: age, cigarette smoking, alcohol intake, family history of hypertension, high-salt diet, high-fat diet, waist circumference, total cholesterol, triglyceride, and high-density lipoprotein cholesterol.
Subjects with diabetes were excluded.
Discussion
The findings of our present study indicated that hyperuricemia and microalbuminuria were separately and independently associated with prehypertension in a representative sample among Chinese Han women aged ≥30 years, residing in the city of Suzhou, Jiangsu Province, China. In this study, we analyzed associations between UA levels and prehypertension. We found that ORs of prehypertension increased significantly and positively with UA levels, independently of age and other known confounders. Recently, some studies 8,9 reported that UA was associated with microalbuminuria in prehypertensive subjects. Accordingly, to investigate this association further, we examined associations between UA levels and prehypertension among subjects without microalbuminuria and not using antihypertensive medication. As expected, the association between UA and prehypertension still existed.
Therefore, we confirmed that the association between UA and prehypertension was independent of microalbuminuria and other confounders. Similarly, we observed a significant association between blood pressure status and microalbuminuria independent of age and other confounders, even after diabetic individuals were excluded. It needed to be mentioned that the components of metabolic syndrome may be important potential confounding factors that could have influenced the relationships between hyperuricemia, microalbuminuria, and prehypertension in this study. Some studies have found that elements of the metabolic syndrome were associated with UA 20,21 and ACR. 22 Accordingly, we adjusted for several elements of the metabolic syndrome, including TC, TG, HDL-C, FPG, and WC, in the multivariate models. Associations of hyperuricemia and microalbuminuria with hypertension or increased blood pressure levels appeared to be independent of the metabolic syndrome elements.
In addition to our current study, several other studies have found an independent association between hyperuricemia and prehypertension. For example, a cross-sectional study among 4,817 U.S. adults 23 showed that UA was positively associated with increased risk of prehypertension. Studies performed in a Chinese population 24 and in Japanese men 25 also demonstrated that hyperuricemia was significantly associated with increased risk of prehypertension after adjusting for potential confounding factors. However, none of the studies have considered the possible influence of microalbuminuria.
Our findings were consistent with several other studies, 5,26 which demonstrated an independent association between microalbuminuria and prehypertension. The Coronary Artery Risk Development in Young Adults (CARDIA) study 26 demonstrated that microalbuminuria prevalence increased as blood pressure levels increased after adjustment for age, sex, race, education, and diabetes. When patients with diabetes were excluded, the association between blood pressure level and microalbuminuria among prehypertensive subjects was no longer significant. Additionally, a study conducted by Knight 5 found a significant association between ACR and prehypertension. But all of the studies did not consider the influence of hyperuricemia. Our findings observed the positive associations between microalbuminuria and blood pressure status among Chinese Han women, after individuals with hyperuricemia or diabetes or use of antihypertensive medication were excluded. As a result, we confirmed that the association between microalbuminuria and prehypertension was independent of hyperuricemia.
The mechanisms behind the associations between hyperuricemia or microalbuminuria and prehypertension were complex. Some studies showed that elevated UA might activate the renin–angiotensin system, which can lead to injury of prerenal blood vessels and hypertension. 27 Urinary albumin excretion has been also reported as a predictor of developing hypertension and blood pressure progression. 28 Another condition of concern was experimental hyperuricemia, in which glomerular hypertension occurred even under conditions of mild hypertension. 29 As discussed, recent studies have correlated both of these conditions with the development of structural lesions of the renal arteriole. To further investigate this phenomenon, we examined mutually independent associations of prehypertension with hyperuricemia and microalbuminuria, respectively.
Although our current cross-sectional study cannot explain the causal relationship of microalbuminuria or hyperuricemia to hypertension, we tried to extend the applicability of this study further by additionally examining carefully the associations between microalbuminuria or hyperuricemia and prehypertension. In our current study, we analyzed the associations between microalbuminuria or hyperuricemia and hypertension only among females, which maybe affect the extrapolation of the significant associations to male population. Additionally, there was another limitation in our study. Glomerular filtration rate was unavailable to assess renal function for every subject, although all the subjects included did not have chronic kidney disease.
In conclusion, hyperuricemia and microalbuminuria are separately associated with prehypertension among Chinese Han women. Further study is needed to investigate whether ACR is a good predictor for hypertension and other cardiovascular disease.
Footnotes
Acknowledgments
This study was supported by Suzhou Science and Technology Project (Grant No. SS0910) and a Project of the Priority Academic Program Development of Jiangsu Higher Education Institutions. We are deeply appreciative of the participants in this study, and want to thank all staffs for their support and assistance.
Author Disclosure Statement
The authors declare no financial or other conflict of interests.