
Abstract
Background:
Postprandial hypertrygliceridemia is a known factor for cardiovascular disease and is often observed in patients with type 2 diabetes mellitus (T2DM) and visceral adiposity. Adiponectin is a hormone with antiatherogenic and anti-inflammatory effects, which decreases in obesity and T2DM subjects. The weight loss induced by diet or bariatric surgery could be restoring adiponectin levels.
Objective:
The aim of the study was to evaluate the impact of weight loss induced by bariatric surgery, which could restore adiponectin and triglycerides (TG) levels in obese and diabetic patients.
Methods:
Ten patients with T2DM (BMI 39.3+2.44) were evaluated before and at 7 and 90 days after Roux-en-Y gastric bypass (RYGB). A meal test was performed and plasma insulin, glucagon-like peptide-1 (GLP-1), glucose, TG, and adiponectin levels were measured at fasting and at 30, 60, 90, and 120 min postprandial.
Results:
Seven days after surgery, significant reductions in the insulin resistance were observed, while TG and adiponectin levels remained unchanged during the meal test. Ninety days after surgery, TG and glucose levels decreased significantly at fasting, and postprandial, adiponectin, GLP-1, and insulin curves increased significantly after meal ingestion. Both changes in the area under the curve (AUC) of adiponectin correlated with changes in the AUC of TG (R=−0.64, P=0.003) and changes in AUC of adiponectin correlated with changes in total fat mass. No correlation was found between changes in insulin, GLP-1, and TG levels.
Conclusions:
The adiponectin levels may be involved in the mechanism responsible for high TG levels in obese and diabetic patients. These abnormalities can be reversed by RYGB.
Introduction
Adiponectin is a hormone secreted by the adipose tissue that is exclusively expressed in white fat tissue and has been shown to have antiatherogenic, insulin-sensitizing, and anti-inflammatory effects. 5,6 Although adiponectin is produced by the adipose tissue, increases in body fat mass are associated with decreases in plasma adiponectin levels. 7,8 Adiponectin expression is reduced in obesity, insulin resistance, and type 2 diabetes mellitus (T2DM), and plasma concentrations are inversely related to body weight and insulin levels. 9 Previous studies have demonstrated that reduced adiponectin levels in circulation could be reversed (at least partially) after weight loss induced by diet or bariatric surgery, with an improvement in insulin resistance. 10,11 The adiponectin levels are inversely associated with other cardiovascular risk factors, such as total cholesterol, LDL, and TG levels and positively related to HDL. 12
In a study including subjects with different degrees of insulin resistance, Ribeiro-Filho et al. 13 showed that both adiponectin and TG levels increase after an oral lipid overload. It was also observed that in the more insulin-resistant subgroup, compared with the less insulin-resistant subgroup, adiponectin levels were lower and TG levels were higher after the oral lipid overload. In addition, analyzing all patients together, an inverse correlation was observed between TG and adiponectin levels. Considering these results, it was suggested that hypoadiponectinemia, associated with insulin resistance, might be involved in the mechanism that impairs postprandial plasma TG clearance from the circulation.
Bariatric surgery represents the most effective treatment for obesity,
14,15
leading to marked improvements in glycemic and lipids profiles in diabetic patients, and is associated with decreases in insulin resistance and better postprandial insulin secretion.
16,17
Our group observed in another study, 7 days after Roux-en-Y gastric bypass
The aim of this study was to investigate the impact of weight loss, decreases in insulin resistance, and change in glucagon-like peptide-1 (GLP-1) on postprandial adiponectin and TG levels in obese T2DM subjects after RYGB surgery.
Patients and Methods
Patients included in this study were recruited from the Obesity and Hypertension Outpatient Clinic at the Hospital do Rim e Hipertensão, Universidade Federal de São Paulo (UNIFESP). The following criteria were required—diagnosed T2DM, 25–65 years of age, body mass index (BMI) >35 kg/m2, and the use of oral antidiabetic medication, metformin, or/and sulfonylurea. Patients were excluded from the study for the following reasons—the use of dipeptidyl peptidase-4 inhibitors, GLP-1 agonist, peroxisome proliferator-activated receptor-γ (PPARγ) agonists, and insulin therapy; severe psychiatric disease; cancer, renal, cardiac, or hepatic failures; alcohol or drug abuse; or severe pulmonary disease. Patients showing uncontrolled blood pressure (systolic blood pressure ≥160 mmHg) were also excluded. The Ethic Committee at the Universidade Federal de Sao Paulo approved this study, and all participants signed an informed consent agreement.
A complete physical examination with height and weight determinations for BMI calculation and waist circumference measurements were performed before and at 7 and 90 days after surgery. The waist circumference was measured at the midpoint between the last rib and the iliac crest.
After withdrawal of antidiabetic medication for 12 hr, patients fasted for 12 hr overnight and blood samples were collected for total cholesterol (TC), HDL, TG, glucose, insulin, and glycated hemoglobin (HbA1c) determinations. A standard liquid meal of 353 kcal (46.8% carbohydrates, 32.2% proteins, and 12.5% lipids) was then given to all patients. Blood samples were obtained at 0, 30, 60, 90, and 120 min during this meal test for blood plasma glucose, insulin, TG, GLP-1, and adiponectin level measurements. This procedure was performed before and at 7 and 90 days after surgery. Body composition was determined by bioelectrical impedance methodology before and after surgery (Quantump BIA 101Q Akern RJL Systems, Clinton Township, MI). The bioelectrical impedance analysis was performed in the morning, after overnight fasting with an empty bladder. The homeostasis model assessment of insulin resistance (HOMA-IR) index was calculated from fasting glucose and insulin values. The areas under the curves (AUC) of the glucose and insulin values obtained during the meal test were used to calculate another insulin resistance index according to the formula: AUC glucose×AUC insulin/10,000.
18
The Matsuda Index of insulin sensitivity was calculated as follows
19
:
G0 and I0 are premeal values for insulin and glucose and Gm and Im are mean postmeal values during the first 120 min of the meal test.
All diabetes medications were discontinued after surgery.
Surgical technique
The technique used in this study was the RYGB, which combines restrictive and malabsorptive mechanisms for inducing weight loss. A vertical gastric pouch (20–30 mL) was constructed with surgical staples in the lesser curvature of the stomach. Gastrojejunostomy adjustment was performed using a 32-French tube. Reconstruction was performed by RYGB with an alimentary limb measuring 100 cm and a biliopancreatic limb of 50 cm from the ligament of Treitz. All surgical procedures were performed by the same surgeon in the same hospital
Analytical procedure
TC, HDL, and TG were determined by the enzymatic calorimetric method. Glucose levels were determined by the glucose oxidase method, and plasma insulin levels were determined by an automatic immunoassay system (Auto DELFIA insulin kit, PerkinElmer Life and Analytical Sciences, Waltham, MA). HbA1c was determined by high-performance liquid chromatography (HPLC).
Adiponectin was quantified by enzyme-linked immunosorbent assay (ELISA) specific for humans, from Linco Research. Active GLP-1 was measured by ELISA immunoflorescence (Linco Research, specific for humans). The magnitudes of TG and adiponectin response were quantified as the total AUC values of the postprandial plasma levels, these variables being calculated using the trapezoidal rule.
Statistical analysis
All data were analyzed using the software Statistical Package for the Social Sciences (SPSS), version 18.0 (SPSS, Inc, Chicago, IL). The Friedman test and post hoc analysis were used to compare the values of all parameters studied, obtained during the meal test before surgery and at 7 and 90 days after surgery. The Spearman coefficient was used to determine the correlations between the different variables before and after surgery. Data are expressed as mean±standard deviation (SD), and P<0.05 was considered statistically significant.
Results
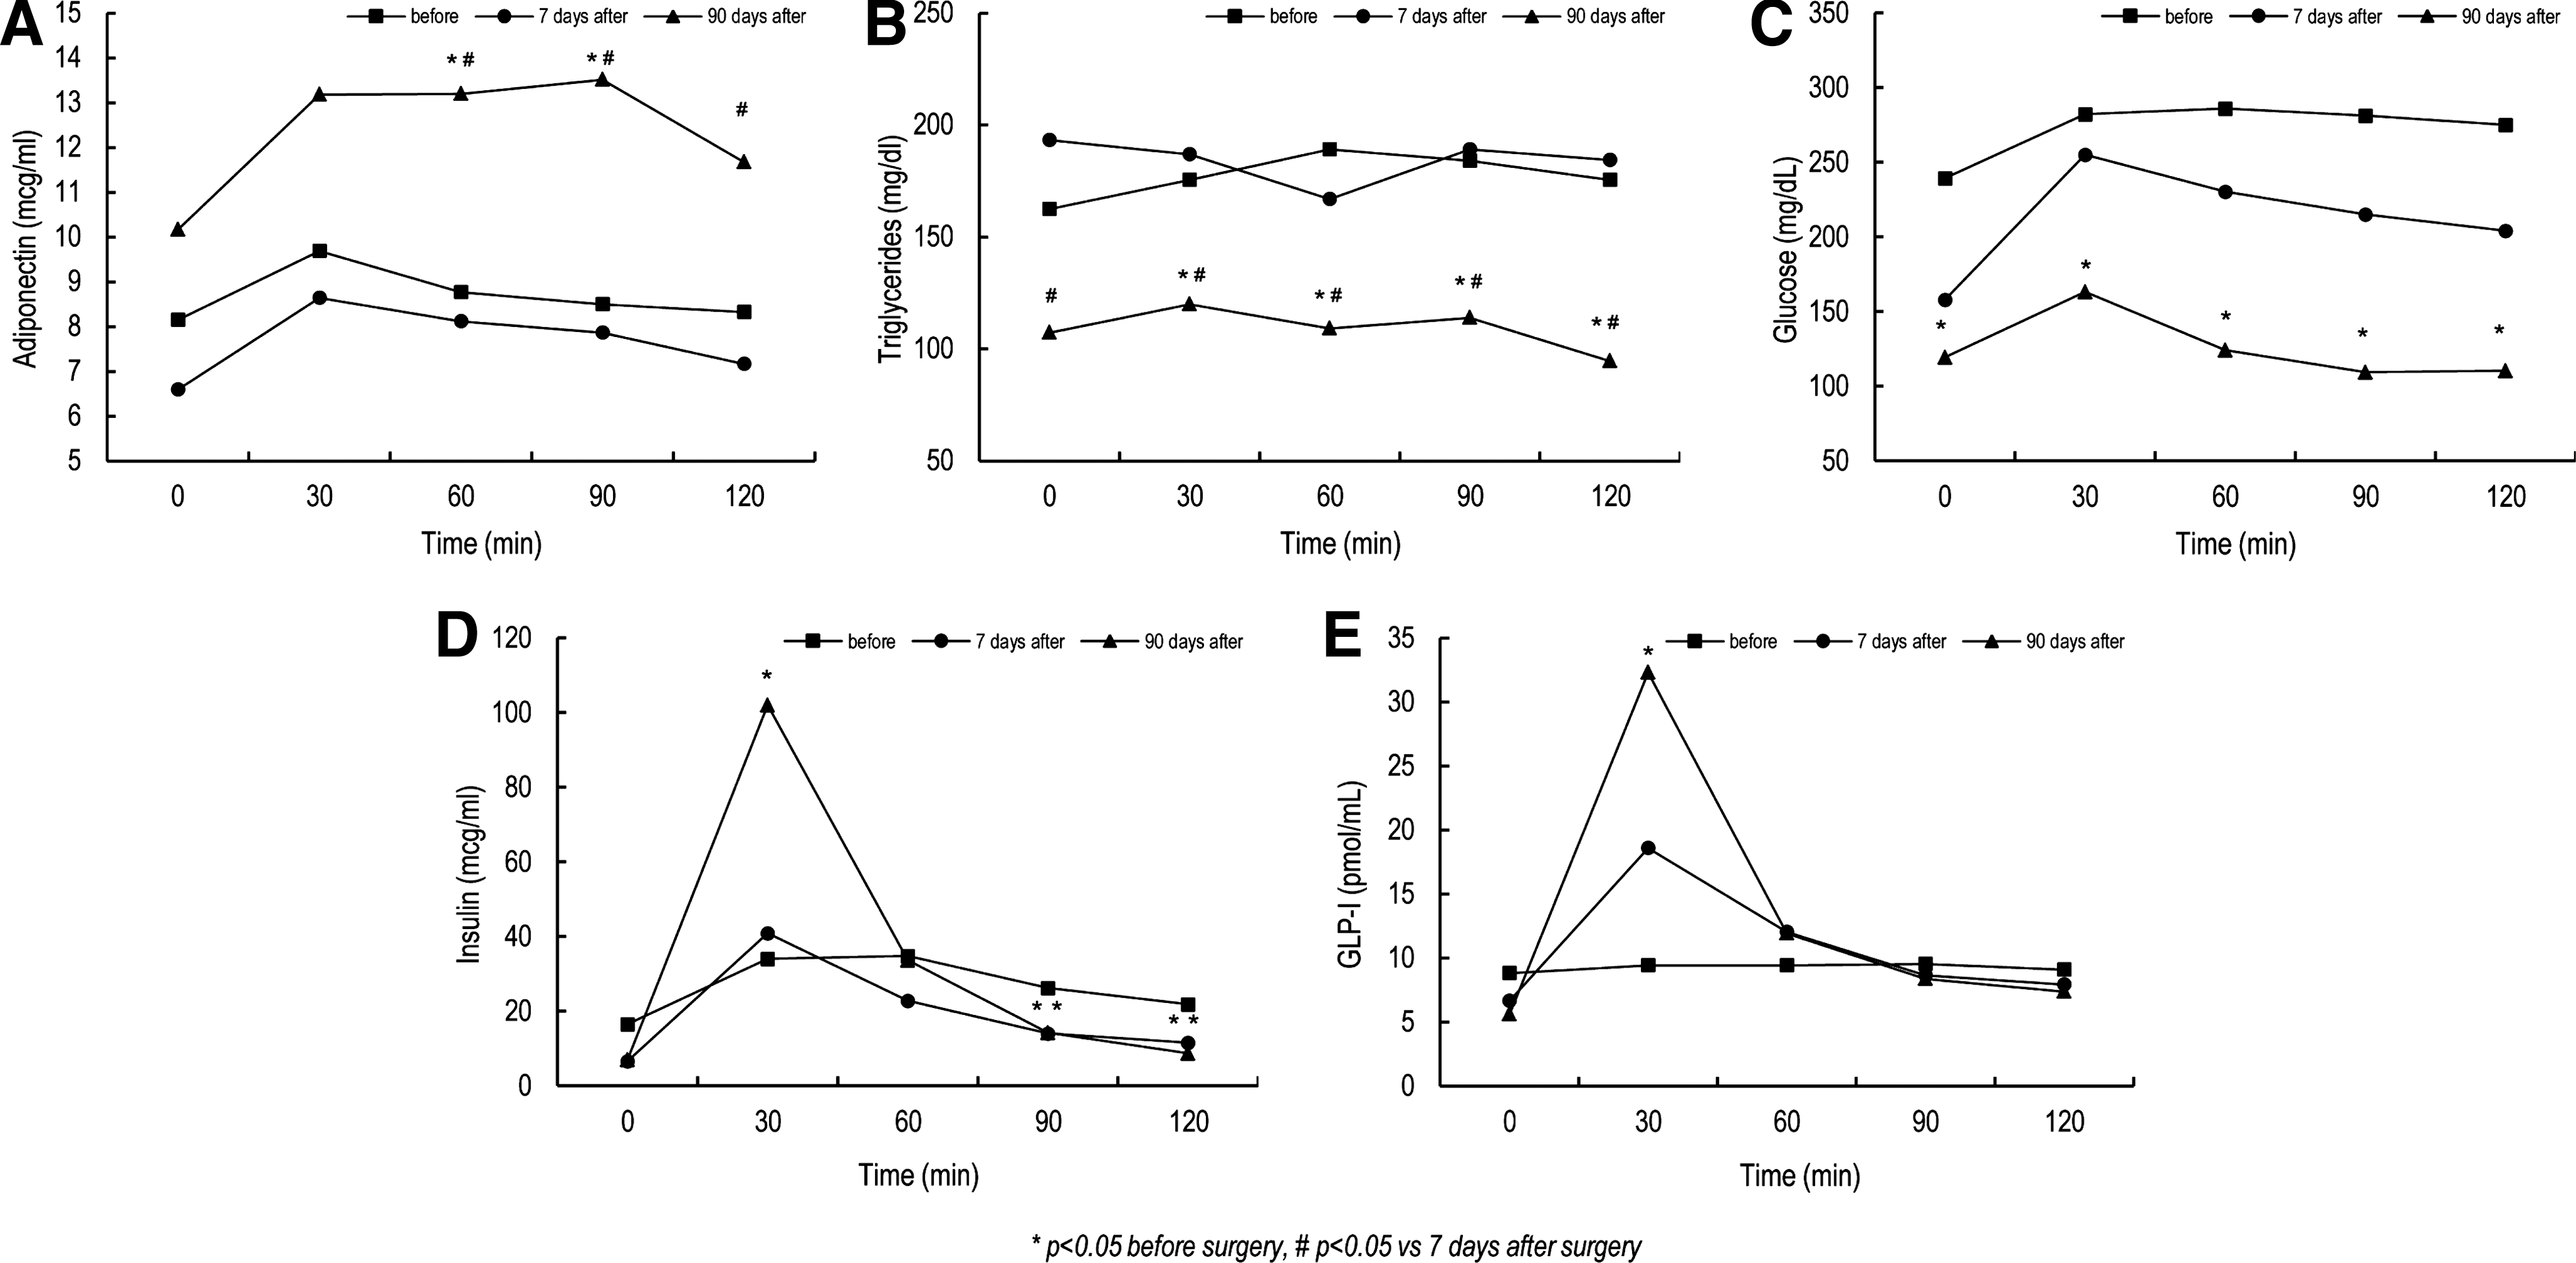
Clinical and laboratory profiles of the 10 patients studied before and at 7 and 90 days after RYGB are shown in Table 1. Before surgery, we observed high blood TG and glucose values both at fasting and after the standard meal test. This was accompanied by no significant increases in postprandial insulin and GLP-1 secretion and adiponectin levels, with these variables describing flat curves (Fig. 1).
Plasma adiponectin
AUC is area under the curve 0–120 min; insulin resistance index is AUC glucose×AUC insulin/10,000.
n=10 (3 male and 7 female).
P<0.05×before surgery.
P<0.05×7 days after surgery.
BMI, body mass index; GLP-1, glucagon-like peptide-1; HDL, high-density lipoprotein; TC, total cholesterol; HbA1c, glycated hemoglobin; HOMA-IR, homeostasis model assessment of insulin resistance.
Seven days after RYGB, blood TG values remained high during the meal test. Fasting blood glucose showed a tendency to decrease, but the postprandial values remained high. Insulin and GLP-1 levels showed lower values in the fasting state, delineating a nonstatistically significant peak at 30 min after meal ingestion and then decreasing thereafter. Changes in insulin and GLP-1 levels, however, did not differ from presurgical values. The HOMA-IR and Matsuda index improved early after 7 days of surgery. The curve of the adiponectin values also remained similar to that observed before surgery (Fig 1). We observed a decrease in HDL concentrations 7 days after surgery (Table 1).
Ninety days after surgery, glucose values significantly decreased at fasting and during the meal test, and change in the shape of the insulin curve was noted. The fasting TG values decreased significantly; however, there were no statistical changes in postprandial values after the meal test than before surgery and 7 and 90 days after surgery. GLP-1 and adiponectin curves were noted. The insulin sensitivity assessed by HOMA-IR and the Matsuda index maintained the same values as those of 7 days. The adiponectin levels adopted a trapezoidal design, and the levels showed significant increases at 60, 90, and 120 min after meal ingestion. The insulin and GLP-1 levels continued to change in the same direction as noted before, showing a dramatic increase at 30 min after the meal test (Fig. 1).
Considering the two observation periods—7 and 90 days after surgery—changes in the AUCs of adiponectin values correlated with the changes observed in total fat mass (r=0.7, P=0.002) and changes in fasting HDL levels (r=0.5, P=0.027). Also, a correlation was found between changes in the AUC of TG and the AUC of adiponectin levels (r=−0.64, P=0.003) (Fig. 2) and in changes in the AUC of TG and fat mass (r=0.65, P=0.001). We found a correlation between fasting TG and Matsuda Index (r=−0.4, P=0.05). However, no correlation was found between changes in postprandial AUC of TG and GLP-1 and insulin levels (Fig. 2), nor in postprandial AUC of adiponectin, GLP-1, and insulin levels (Fig. 2). None of the insulin sensitivity indices correlated with changes in TG and adiponectin profiles. We found a negative correlation between changes in the AUC of TG with changes in fasting HDL levels (r=−0.51, P=0.02).

Spearman correlation between:
Discussion
In this study, we observed high TG and low adiponectin levels after the meal test in obese diabetic patients before bariatric surgery, and these phenomena were accompanied by a flattened and defective curve of GLP-1 and insulin postprandially. Seven days after the surgical procedure, we noted a significant reduction in the insulin resistance, whereas TG and adiponectin levels remained unchanged during the meal test. This was associated with decreases in insulin levels at fasting and no significant increases after meal ingestion. The GLP-1 curve begins to change, but not reach statistical significance.
Ninety days after surgery, postprandial adiponectin levels became higher than before; however, there was no statistical change in postprandial TG values after the meal test (probably due to the low lipid content of the meal) so the AUC of TG after 90 days is lower than the baseline and at 7 days because of fasting TG. This correlates with adiponectin and insulin sensitivity (Matsuda index). The GLP-1 and insulin levels show a significant peak at 30 min after food ingestion. These results clearly demonstrate that the improvements in hepatic and peripheral insulin sensitivity occur earlier than the improvements in both insulin and adiponectin production. We also noted no change in lipid profile at this time. This early reduction in insulin resistance has been attributed to the condition of severe caloric restriction 20 usually observed in the first days after bariatric surgery.
Low levels of plasma adiponectin are also common in individuals with central obesity and T2DM. 21 The reduction in adiponectin secretion in these conditions is believed to be caused by the inhibitory action of inflammatory molecules originating from the hypertrophic adipocytes such as tumor necrosis factor-α (TNF-α) and interleukin-6 (IL-6), on adiponectin gene transcription. 4,22 It has been shown that TNF-α is a potent inhibitor of adipocyte differentiation, by downregulating the expression of γ, which leads to decreases in adiponectin secretion. 23,24 Preadipocytes maintained in an undifferentiated state synthesize more proinflammatory products than differentiated adipocytes, 25 generating a vicious cycle of chronic inflammation, low adiponectin secretion, and also insulin resistance.
The association between decreases in LPL activity and low adiponectin levels has been described recently 26 by Qiao and colleagues 27 in an experimental study in mice; this study found some evidence that adiponectin acts to increase TG clearance from the circulation through LPL activation, thus avoiding high circulating TG levels. von Eynatten et al. 26 also demonstrated an association between decreases in LPL activity and low adiponectin levels. This association was independent of inflammation and insulin resistance. Furthermore, it was observed that adiponectin levels were the strongest factor influencing plasma LPL activity.
Seven days after surgery, a decrease in insulin resistance was not associated with changes in adiponectin, lipid profile, or insulin secretion. Under severe caloric restriction, a reduction in hepatic glucose production is observed. 20 In addition, insulin secretion is less stimulated by food intake, and the process of lipolysis leads to the release of large amounts of free fatty acids in the circulation, with the inhibition of LPL activity. There is regional variation in the lipolytic process, favoring lipid mobilization from visceral fat. In the liver, incoming fatty acids lead to overproduction of very-low-density lipoprotein (VLDL) and TG, 7,21 whereas the lipotoxic effect of free fatty acids in the pancreas may also interfere with insulin secretion in response to food intake. 7 These mechanisms might explain our findings of a reduction of insulin resistance and insulin secretion associated with maintenance of high postprandial TG levels soon after the surgical procedure.
The lipoprotein lipase is a crucial enzyme needed for removal of TG from plasma and insulin and is responsible for its synthesis. 28 Ninety days after surgery, after the peak of insulin and the improvement in insulin sensitivity, this mechanism returned to exercise its functions and may be responsible for the reduced TG at fasting. We noted a marked improvement in insulin secretion after the meal test, a significant reduction in fat mass, and an increase in insulin and adiponectin levels. The significant and negative correlation between changes in TG and adiponectin levels during the meal test may suggest the hypothesis that higher adiponectin values might be involved in the mechanism that increases TG clearance through increases in LPL activity. Our findings confirm previous results showing an inverse correlation between postprandial TG and adiponectin levels in patients showing different degrees of insulin resistance. 13
Considering adiponectin is a molecule with insulin-sensitizing properties, we may speculate that the reduction in fasting TG levels 90 days after surgery might be the result of a facilitator effect of adiponectin on the action of insulin stimulating LPL activity and inhibiting hormone-sensitive lipase. In this study, no correlations were found between the levels of GLP-1 and adiponectin and GLP-1 and TG after a meal test, respectively. We did find a correlation between the improvement in fasting TG levels and decrease insulin resistance using the Matsuda index
The present study had limitations, such as the small number of patients and the lower amounts of fat in the meal test to stimulate the increase of postprandial hypertriglyceridemia. Other limitations were to not measure high-molecular-weight (HMW) adiponectin, which plays a significant role in insulin sensitivity, and the measurement of fat mass by bioelectrical impedance methodology, which has low accuracy.
In summary, the study found a significant lowering of fasting TG levels and an improvement in postprandial adiponectin levels 90 days after RYGB. These changes were correlated to the loss of fat mass. The reduction of fasting TG levels was correlated with the improvement of insulin resistance.
Footnotes
Author Disclosure Statement
No financial or other potential conflicts of interest exist for any of the authors.