
Abstract
Introduction:
Sleep deficits associated with sleep apnea and insomnia increase the risk of vascular inflammation and insulin resistance. This study examined the hypothesis that inflammation markers are higher in those diabetic patients who experience sleep deficits compared with those without any history of a sleep disorder.
Methods:
Fasting blood was obtained after written informed consent, and sleep disorder histories were obtained from type 2 diabetic patients (n=81) attending clinics of the Louisiana State University Health Sciences Center.
Results:
There was a significant correlation between body weight and leptin, and leptin in turn was significantly correlated with 10-kDa interferon-γ–induced protein (IP-10) levels and insulin resistance in type 2 diabetic patients. Fasting blood levels of leptin, IP-10, and insulin resistance were significantly elevated in patients with sleep deficits compared with diabetics with normal sleep patterns. There were no differences in glycosylated hemoglobin (HbA1c) or fasting glucose in patients with sleep deficits compared with those with normal sleep patterns. Sleep deficits increase circulating levels of leptin, IP-10, and insulin resistance compared to levels seen in patients with diabetes who reported no difficulty with sleep. Patients with sleep apnea had significantly lower hydrogen sulfide (H2S) levels compared with patients with normal sleep patterns or patients with insomnia. Low levels of circulating H2S could contribute to higher vascular inflammation in patients with sleep apnea.
Conclusions:
These results suggest that sleep apnea is associated with a decrease in circulating H2S and sleep disorders increase the risk of inflammation and insulin resistance, which can contribute to the increased risk of vascular disease in subjects with type 2 diabetes.
Introduction
Methods
Patient enrollment
Informed written consent was obtained from all patients according to the protocol approved by the Louisiana State University Health Sciences Center (LSUHSC) Institutional Review Board (IRB). All patients included in this study were adults with type 2 diabetes. A history to detect sleep disorders was obtained during the visit to obtain informed consent to participate in the study. One hundred diabetic subjects were enrolled in this study. All patients who gave written informed consent were invited to return to have blood drawn after fasting overnight. Of the 100 subjects who gave informed consent, 81 subjects came to the clinic for the blood draw.
Inclusion/exclusion criteria
Adult type 2 diabetic patients attending the diabetic clinic of the LSUHSC hospital were included in the study. Patients were excluded if they had any history of CVD, sickle cell disease, treatment with insulin, or metabolic disorders, including uncontrolled hypertension, hypothyroidism, or hyperthyroidism. Patients were excluded if they showed signs of significant hepatic dysfunction, defined as any underlying chronic liver disease or liver function tests greater than 1.5 times the upper limit of normal or renal dysfunction, defined as a serum creatinine greater than 1.5 mg/dL. Women with a positive pregnancy test or those nursing infants were also excluded. Subjects who were taking any supplemental vitamins or herbal products were not included in this study.
Blood collection
Blood was drawn from patients after an overnight fast (8 h). Following blood collection, serum tubes for chemistry profile, EDTA tubes for glycosylated hemoglobin (HbA1c), and complete blood counts were promptly delivered to the LSUHSC clinical laboratories. Additional tubes of EDTA-blood were brought to the research laboratory. Clear plasma was separated via centrifugation at 3000 rpm (1500×g) for 15 min. All plasma samples were stored at −80°C for analyses of the biochemical parameters.
Leptin, IP-10, insulin, and insulin resistance and H2S assays
Leptin, IP-10, and insulin levels in the plasma were determined by the sandwich enzyme-linked immunosorbent assay (ELISA) method using commercially available kits from Fisher Thermo Scientific Co. (Rockford, IL). All appropriate controls and standards as specified by the manufacturer's kit were used. In the cytokine assay, control samples were analyzed each time to check the variation from plate to plate on different days of analysis. Insulin resistance was calculated from blood glucose and insulin levels using the homeostasis model assessment of insulin resistance (HOMA-IR) formula. 8 HOMA-IR was calculated with the formula: [plasma insulin (μU/mL)×glucose (mg%)] divided by 405. Plasma H2S was determined as described previously. 9
All chemicals were purchased from Sigma Chemical Co. (St. Louis, MO) unless otherwise mentioned. Data were analyzed using analysis of variance (ANOVA) statistically with Sigma Stat. A P value of less than 0.05 for a statistical test was considered significant.
Results
Table 1 gives the ages, body weights, glucose, HbA1c, and other blood chemistry profiles of diabetic patients without and with a history of insomnia or sleep apnea. There were no differences in the ages, body weights, body mass index (BMI), glucose, HbA1c, calcium, potassium, creatinine, or blood urea nitrogen (BUN)/creatinine levels of patients among the various groups. However, there was an increase in the insulin levels in diabetic patients with insomnia, sleep apnea, or both compared to diabetics reporting normal sleep patterns.
HOMA insulin resistance was calculated with the formula: [plasma insulin (μU/mL)×glucose (mg%)] divided by 405. Values are mean±standard error. Differences in # vs.* are significant (P<0.05).
M/F, male/female; BMI, body mass index; HbA1c, glycosylated hemoglobin; BUN, blood urea nitrogen; HOMA, homeostasis model assessment.
Figure 1 illustrates a significant relationship between body weight and blood levels of leptin (Fig. 1A). Leptin showed a significant relationship with levels of IP-10 (Fig. 1C) and insulin resistance (Fig. 1B) in type 2 diabetic patients. Blood levels of IP-10 and insulin resistance were also positively correlated in type 2 diabetic patients (Fig. 1D).

The relationship between body weight and leptin
Figure 2 shows blood levels of leptin, insulin resistance, IP-10, and H2S type 2 diabetic patients separated into the following groups: Diabetics without history of sleep disorder (D), diabetics with history of both insomnia and sleep apnea (IN+SA), diabetics with a history of insomnia (IN), and diabetics with a history of sleep apnea (SA). Leptin and IP-10 levels were significantly elevated in diabetic patients with a sleep disorder, whether IN, SA, or both compared with diabetics with a history of normal sleep. HOMA-IR was significantly greater in those with both IN and SA compared to D, but not in the subgroups with IN or SA. The small number of subjects in these groups may have contributed to the lack of significance. There were no differences in H2S levels in diabetics without sleep disorders or those with IN or IN+SA. However, there were significantly lower levels of H2S in diabetics with SA compared with diabetic patients with normal sleep history or those only complaining of IN.
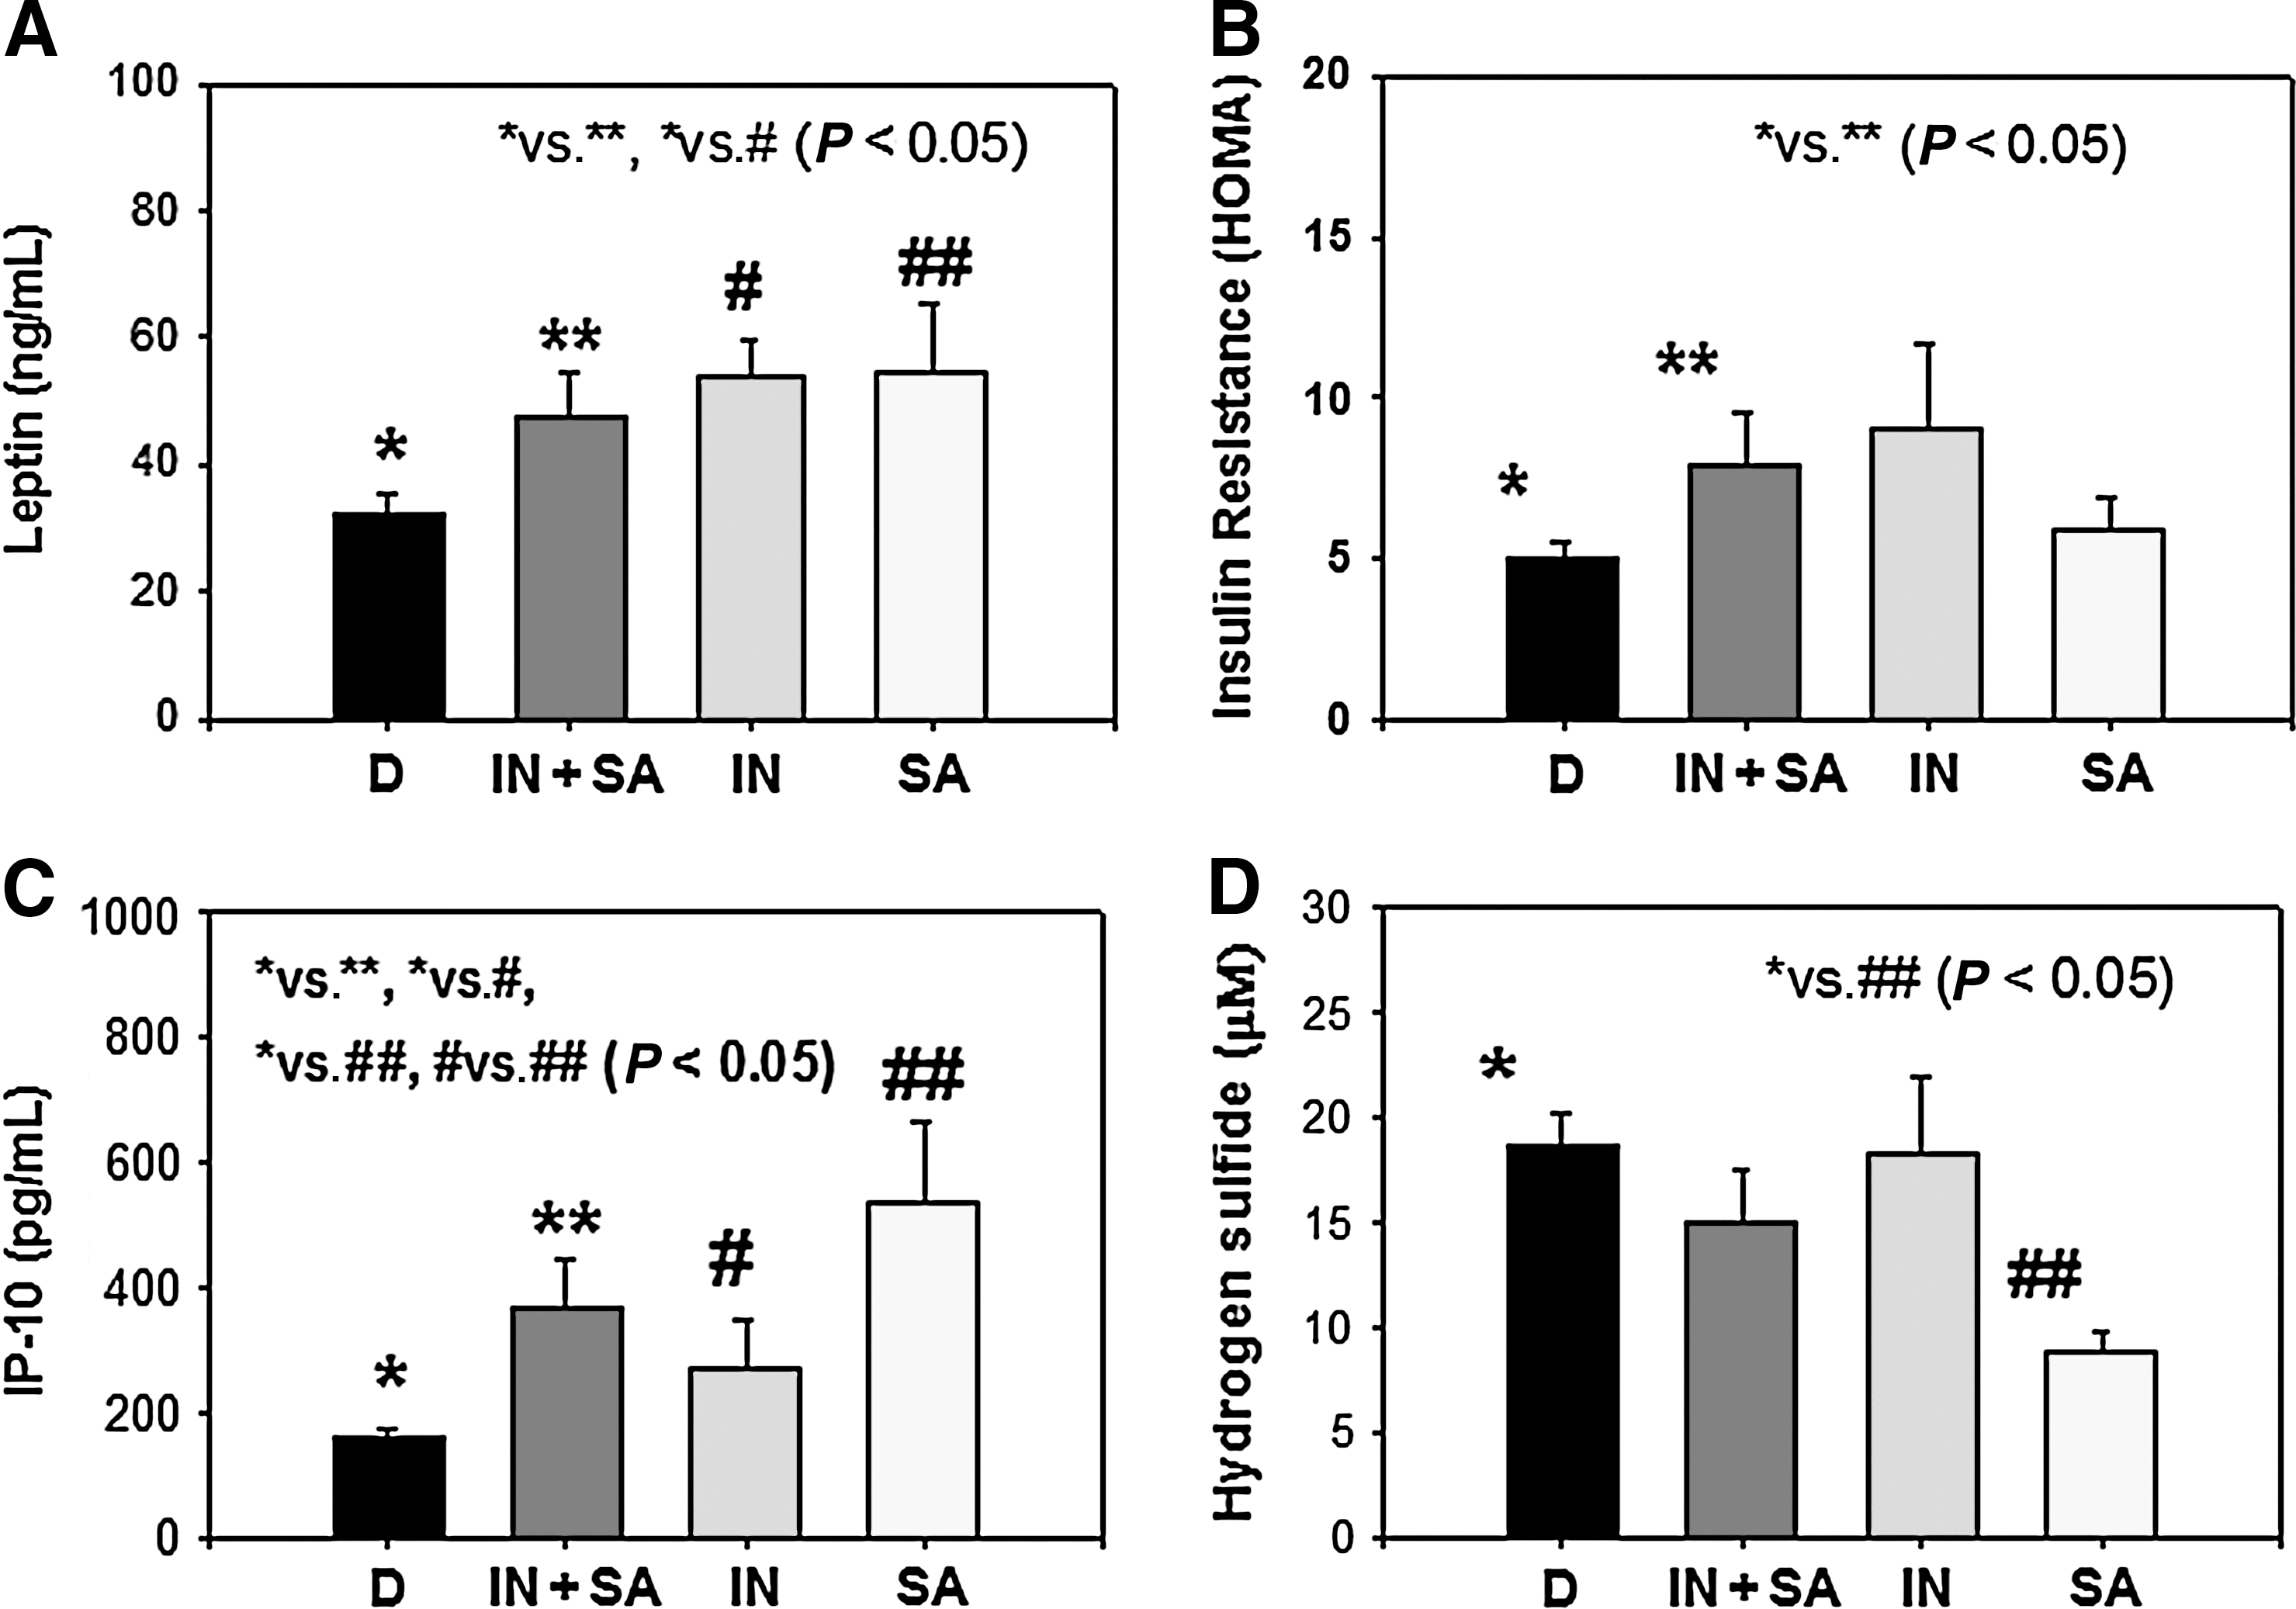
Blood levels of leptin
Discussion
Epidemiological studies suggest that short sleep duration is correlated with an increased risk of developing obesity, metabolic syndrome, and diabetes. 10 –14 Glucose tolerance has been shown to be impaired after 6 days of sleep restricted from 12 h to 4 h per night. 11 Sleep apnea is the most common category of sleep-disordered breathing. The muscle tone of the body ordinarily relaxes during sleep. At the level of the throat, the human airway is composed of collapsible walls of soft tissue that can obstruct breathing during sleep. Chronic sleep apnea requires treatment to prevent low blood oxygen, sleep deprivation, and other complications. Individuals with low muscle tone and soft tissue around the airway (e.g., those with obesity) or those with structural features that give rise to a narrowed airway are at high risk for obstructive sleep apnea (OSA). The elderly are more likely to have OSA than young people, and men are more likely to suffer sleep apnea than women. The risk of OSA rises with increasing body weight and age. Markers of vascular inflammation, leptin, and insulin resistance levels are elevated in the blood of many diabetic patients. Our study suggests a significant increase in leptin with increasing body weight. Leptin, in turn, has a significant relationship with blood levels of IP-10 and insulin resistance in type 2 diabetic patients.
Leptin is produced by adipocytes and is believed to contribute to the central regulation of food intake. 15,16 Its reduction may contribute to the development of obesity. Except for very rare genetic syndromes, obesity is associated with highly elevated serum concentrations of leptin due to leptin resistance. Human studies with normal subjects observed an increase in serum leptin in subjects with sleep restriction but not in controls. 17 The studies in the literature suggest that leptin is a proinflammatory hormone. 18 –21 Evidence from our study suggests that sleep deprivation increases circulating leptin and is an additional risk factor that increases inflammation in type 2 diabetic patients.
The IP-10 chemokine is an interferon-inducible protein-10. 22 The presence of IP-10 in atherosclerotic plaques and its upregulation after balloon injury in the rat carotid artery suggest a direct inflammatory role for IP-10. 23 The proinflammatory effect of IP-10 is mediated predominantly through recruitment of effector T cells at sites of inflammation. IP-10 gene disruption is associated with enhanced expression of antiinflammatory cytokine IL-10 and a decrease in the development of atherosclerotic lesion formation in hypercholesterolemic apolipoprotein E (ApoE) knockout mice. 24 A growing body of evidence suggests that IP-10 is involved in the pathogenesis of atherosclerosis and chronic inflammation of the lungs. 24 There are limited reports regarding the role of IP-10 in sleep disorders. In our study, the significantly higher levels of IP-10 in diabetic patients who also have sleep disorders suggest that lack of sleep is an additional risk factor for the elevated CVD seen in type 2 diabetes. Insulin resistance plays a key role in the regulatory pathway that progresses from hyperglycemia to monocyte and endothelial cell activation in the enhanced vascular inflammation of diabetes. 25 This study indicates that sleep deficits increase the leptin and insulin resistance and IP-10 levels in type 2 diabetic patients. Elevated leptin or leptin resistance, IP-10, and insulin resistance levels may play crucial roles in accelerating the development of CVD in type 2 diabetic patients with a history of sleep deficits.
Our data demonstrate that sleep apnea may cause lower circulating H2S levels. H2S is gaining acceptance as a signaling molecule and has been shown to elicit a variety of biological effects that may mediate protection from CVD.
26,27
H2S is produced in vivo from
In conclusion, sleep deficits increase levels of leptin, IP-10, and insulin resistance and thus can accelerate vascular inflammation in type 2 diabetic patients. Sleep apnea, but not insomnia, is associated with modest but significantly lower blood levels of H2S in diabetic patients. Further studies in a large patient population are needed to establish the role of altered H2S in the pathophysiology of sleep apnea in diabetic patients.
Footnotes
Acknowledgments
The authors are grateful to nurse coordinator John Rowell, R.N., for the outstanding help in conducting this study. S.K.J. is supported by grants from The National Institute of Diabetes and Digestive and Kidney Diseases (NIDDK) and the Office of Dietary Supplements of the National Institutes of Health RO1 DK072433 and the Malcolm Feist Chair in Diabetes. The authors thank Ms. Georgia Morgan for excellent editing of this manuscript.
Author Disclosure Statement
None of the authors have any conflict of interest. No competing financial interests exist.