
Abstract
Background:
The association of the rs738409 polymorphism of patatin-like phospholipase-3 (PNPLA3) with nonalcoholic fatty liver disease (NAFLD) has been suggested in other populations, but not in Asian Indians. We investigated the association of the rs738409 polymorphism of PNPLA3 with clinical, anthropometric, and biochemical profiles in Asian Indians with NAFLD.
Methods:
In this case–control study, 162 cases and 173 controls were recruited. Abdominal ultrasound, clinical, anthropometry, and biochemical profiles were determined. Fasting insulin levels and values for homeostasis model assessment of insulin resistance (HOMA-IR) were determined. Polymerase chain reaction and restriction fragment length polymorphism of the PNPLA3 gene were performed. The associations of this polymorphism with clinical, anthropometric, and biochemical profiles were investigated.
Results:
A higher frequency of C/G and G/G genotypes of the rs738409 polymorphism was obtained in cases as compared to controls (P=0.04), and as a consequence the frequency of the minor allele G was significantly higher in cases (P=0.003). In this study, the G allele was associated with significantly higher fasting insulin (P=0.002), HOMA-IR (P=0.05), alanine transaminase (P=0.003), and aspartate transaminase (P=0.04) values only in cases, but not in the controls. The values of serum triglycerides and total cholesterol were slightly higher in cases with G/C+G/G genotypes but statistically not significant (P>0.05). Using a multivariate logistic regression model after adjusting for age, sex, body mass index, and fasting insulin, subjects with the G/G genotype showed higher risk of NAFLD [odds ratio (OR), 1.98, 95% confidence interval (CI) 1.43–2.73, P=0.04). The relationships of the rs738409 polymorphism with the metabolic parameters were not significant after adjustment for multiple comparisons.
Conclusion:
Asian Indians in north India carrying the allele rs738490 of PNPLA3 is predispose to develop NAFLD.
Introduction
Patatin-like phospholipase domain-containing protein-3 (PNPLA3), also known as adiponutrin, acylglycerol O-acyltransferase, or calcium-independent phospholipase A2-epsilon is an enzyme that in humans is encoded by the PNPLA3 gene. 8 The gene is located on the long arm of chromosome 22 at band 13.31 (22q13.31). Although its function is unknown, adiponutrin is a transmembrane protein with both lipolytic and lipogenic activity in vitro and is highly expressed in liver and adipocytes. 9 A genome-wide survey of over 9000 nonsynonymous single-nucleotide polymorphisms (SNPs) identified rs738409 (I148M) in PNPLA3 as the only variant strongly associated with hepatic fat content in the Dallas Heart Study, which included a multiethnic population sample. 9 Another population-based genome-wide association study of plasma liver enzyme levels in the white caucasians in United Kingdom showed that the PNPLA3 locus is strongly associated with alanine transaminase (ALT) levels. 10 Hotta et al. 11 have shown that the rs738409 polymorphism of PNPLA3 was associated with plasma ALT, aspartate transaminase (AST), and triglycerides (TG) levels in NAFLD and healthy Japanese subjects. Valenti et al. 12 reported that the PNPLA3 rs738409 polymorphism was associated with steatosis severity, hepatocellular ballooning, lobular inflammation, and perivenular fibrosis in pediatric subjects with NAFLD.
Asian Indians are predisposed to develop the metabolic syndrome, NAFLD, and type 2 diabetes mellitus (T2DM). Among other factors, a major factor contributing to metabolic risk is abnormal body composition—higher body fat, more abdominal adipose tissue, and lesser lean body mass, which may result in higher magnitude of insulin resistance as compared to white caucasians. The genetic predisposition to NAFLD in Asian Indians needs more research, and in this context, PNPLA3 gene has not been investigated.
We hypothesized that the PNPLA3 rs738409 polymorphism may have an association with insulin resistance and NAFLD in nondiabetic Asian Indians. In this study, we assessed the association of the PNPLA3 rs738409 polymorphism with NAFLD in Asian Indians in north India.
Methods
Study subjects
We performed an age- and gender-matched case–control study of 335 overweight/obese subjects [body mass index (BMI>23 kg/m2)], 162 with NAFLD (cases), and 173 without NAFLD (controls) at the All India Institute of Medical Sciences and Fortis Hospital, New Delhi, between July, 2009, and April, 2012 (Fig. 1). Institutional ethics committees approved the study, and informed consent was obtained from each subject. Diagnosis of NAFLD was based on the presence of fatty liver on ultrasonography as described below. Those consuming alcohol of over 20 grams/day for males and 10 grams/day for females were excluded. Subjects with known T2DM, cardiovascular disease (CVD), presence of other liver diseases (like alcoholic liver disease, viral hepatitis, autoimmune hepatitis, primary biliary cirrhosis, biliary obstruction, and drug-induced liver damage), severe end organ damage, human immunodeficiency virus (HIV) infection, pregnancy and lactation, and other proinflammatory states were excluded from the study. Weight, height, waist circumference (WC), hip circumference (HC), and blood pressure were evaluated as described previously. 6
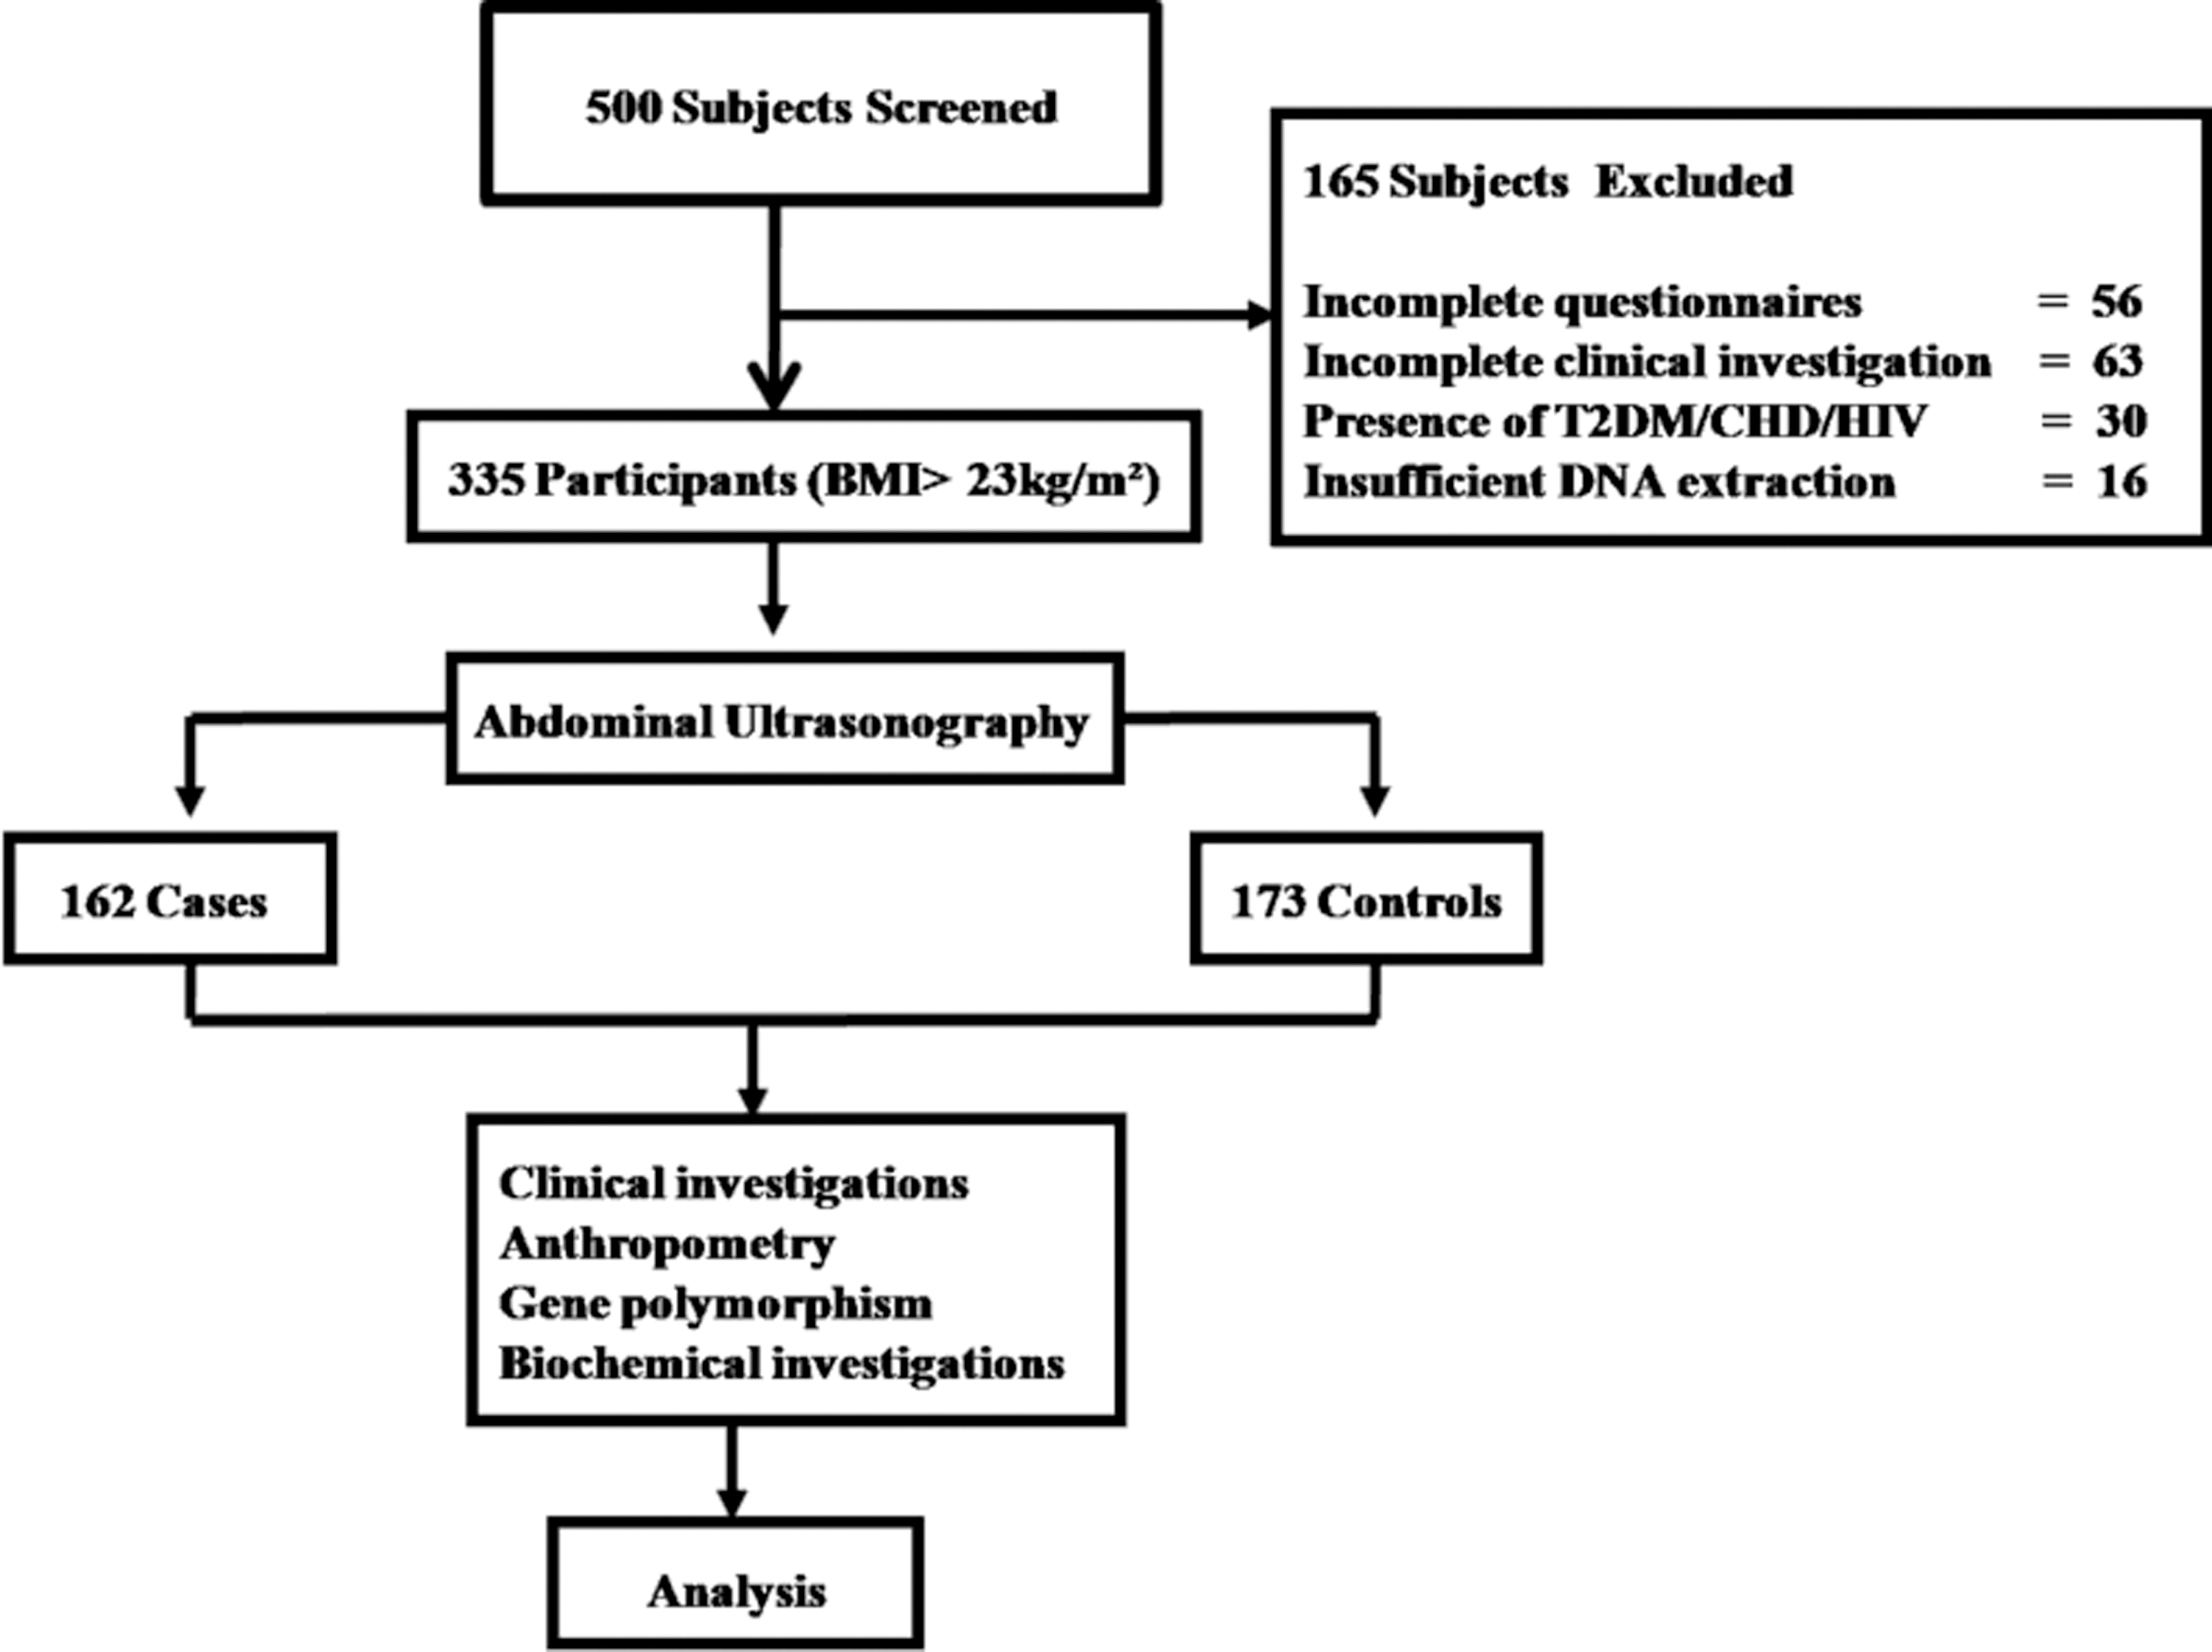
Flow diagram explaining the subject's recruitment selection and reasons for exclusion.
Biochemical analysis
Fasting blood glucose (FBG), total cholesterol (TC), TG, high-density lipoprotein cholesterol (HDL-C), alkaline phosphatase (ALK), AST, ALT, and γ-glutamyl transpeptidase (GGT) levels were analyzed as previously described. 6 Fasting insulin levels were measured using commercially available radioimmunoassay (RIA) kits (Immunotech, France). 13 The intra- and inter-assay percentage coefficient variables were 2.3% and 1.9% for insulin.
Ultrasound imaging
Liver ultrasound was carried out using a 3.5-MHz curvilinear probe (Siemens-G 60 S 2004, Germany) by a trained operator who was blinded to all clinical and laboratory data. A complete examination required both subcostal and intercostal scanning. The definition of fatty liver was based on a comparative assessment of image brightness relative to the kidneys, in line with previously reported diagnostic criteria. 6,14
Genetic analyses
Genomic DNA was extracted from peripheral blood leukocytes by rapid nonenzymatic method. 15 DNA amplification of the PNPLA3 rs738409 polymorphism was performed using the forward and reverse primers 5′-GCCCTGCTCACTTGGAGAAA-3′ and 5′- CCATGCCTCACTGCCTTTCA-3′ (New England Biolabs, USA). PCR was performed in a total volume of 25 μL, containing 2.5 μL of amplification buffer (100 mM Tris-HCl, pH 9.0, 500 mM KCl, 15 mM MgCl2, and 1.0% Triton X-100), 100 μM each nucleotide (dATP, dCTP, dGTP, and dTTP), 0.4 μM each primer, two units of Taq DNA polymerase (Sino-American Biotechnology Co, Luoyang, Henan, China), and 40 ng of genomic DNA. Initial denaturation was at 95°C for 5 min followed by 35 cycles of denaturation at 94°C for 30 sec, annealing at 56°C for 30 sec, extension at 72°C for 60 sec, and final extension at 72°C for 5 min. The 293-bp PCR (10 μL) product was digested with the Afe1 restriction enzyme (0.1 μL) at 37°C overnight. The restriction fragments (178 and 115) were electrophoresed in 2.5% agarose gel, and the bands were visualized by ethidium bromide staining.
Definitions
Overweight and obesity were defined as BMI≥23–24.9 kg/m2 and BMI≥25 kg/m2, respectively. 16 WC cutoffs of ≥90 cm for males and ≥80 cm for females were considered an indicator of abdominal obesity. 16 FBG≥100 mg/dL, serum TG≥150 mg/dL (or on lipid-lowering drugs), blood pressure≥130/85 mmHg (or on antihypertensive therapy), and HDL-C ≤40 mg/dL in males and ≤50 mg/dL in females were defined as abnormal. 16 Insulin resistance was measured by two surrogate measures—fasting hyperinsulinemia and homoeostasis model assessment (HOMA). Hyperinsulinemia was defined as values in the highest quartile as defined previously. 17 The value of HOMA denoting insulin resistance was termed as HOMA-insulin resistance (HOMA-IR) and was calculated as follows: Fasting insulin (μU/mL)×fasting glucose (mmol/L)/22.5. 18 An AST value of up to 50 IU, ALT up to 50 IU, and ALK>80 IU and <240 IU were defined as normal.
Statistical analysis
Data were recorded on a predesigned Excel sheet (Microsoft Corp, USA). The allelic and genotypic frequencies were determined by manual counting. Statistical analysis was performed using STATA Version 9 (Stata Corp, TX). After confirming the normality aspect of quantitative variables, descriptive statistics were computed using mean±standard deviation (SD) and the Student t-test. The difference between proportions was tested using a chi-squared test. The allelic and genotypic frequencies were determined by manual counting. To determine if observed allele frequency was in conformity with the expected frequency (Hardy–Weinberg equilibrium), chi-squared analysis was done. Between-group differences in proportions of alleles or genotypes were compared using a chi-squared test and a two-tailed Fisher exact test. The influence of the genotype on the clinical, biochemical, and anthropometric parameters were estimated by analysis of variance (ANOVA). Univariate and multivariate analyses were carried out to identify the independent predictors of NAFLD considering age, sex, BMI, and fasting insulin. Bonferroni corrections for multiple comparisons were performed. The odds ratio (OR) and 95% confidence interval (CI) were used as a measure of strength for the association between rs738409 genotypic combinations with the disease. A P value<0.05 was considered as significant.
Results
Clinical, anthropometric, and biochemical profiles
The clinical, anthropometric and biochemical profiles are presented in Table 1. Significantly higher systolic blood pressure (P=0.001), diastolic blood pressure (P=0.003), weight (P=0.02), BMI (P=0.006), WC (P=0.001), and HC (P=0.005) were observed in cases than in controls. Furthermore, significantly higher values of FBG (P=0.04), TG (P=0.002), TC (P=0.002), LDL-C (P=0.03), very-low-density lipoprotein (VLDL) (P=0.01), ALT (P=0.05), GGT (P=0.0001), fasting insulin (P=0.0008), and HOMA-IR (P=0.009) were recorded in cases as compared to controls.
Values are given as the mean±standard deviation.
P value<0.05 is statistically significant.
LDL-C, low-density lipoprotein cholesterol; HDL-C, high-density lipoprotein cholesterol; VLDL, very-low-density lipoprotein; ALK, alkaline phosphatase; ALT, alanine transaminase; AST, aspartate transaminase; GGT, γ-glutamyl transpeptidase; HOMA-IR, homoeostasis model assessment of insulin resistance.
Analysis of the PNPLA3 rs738409 genotype
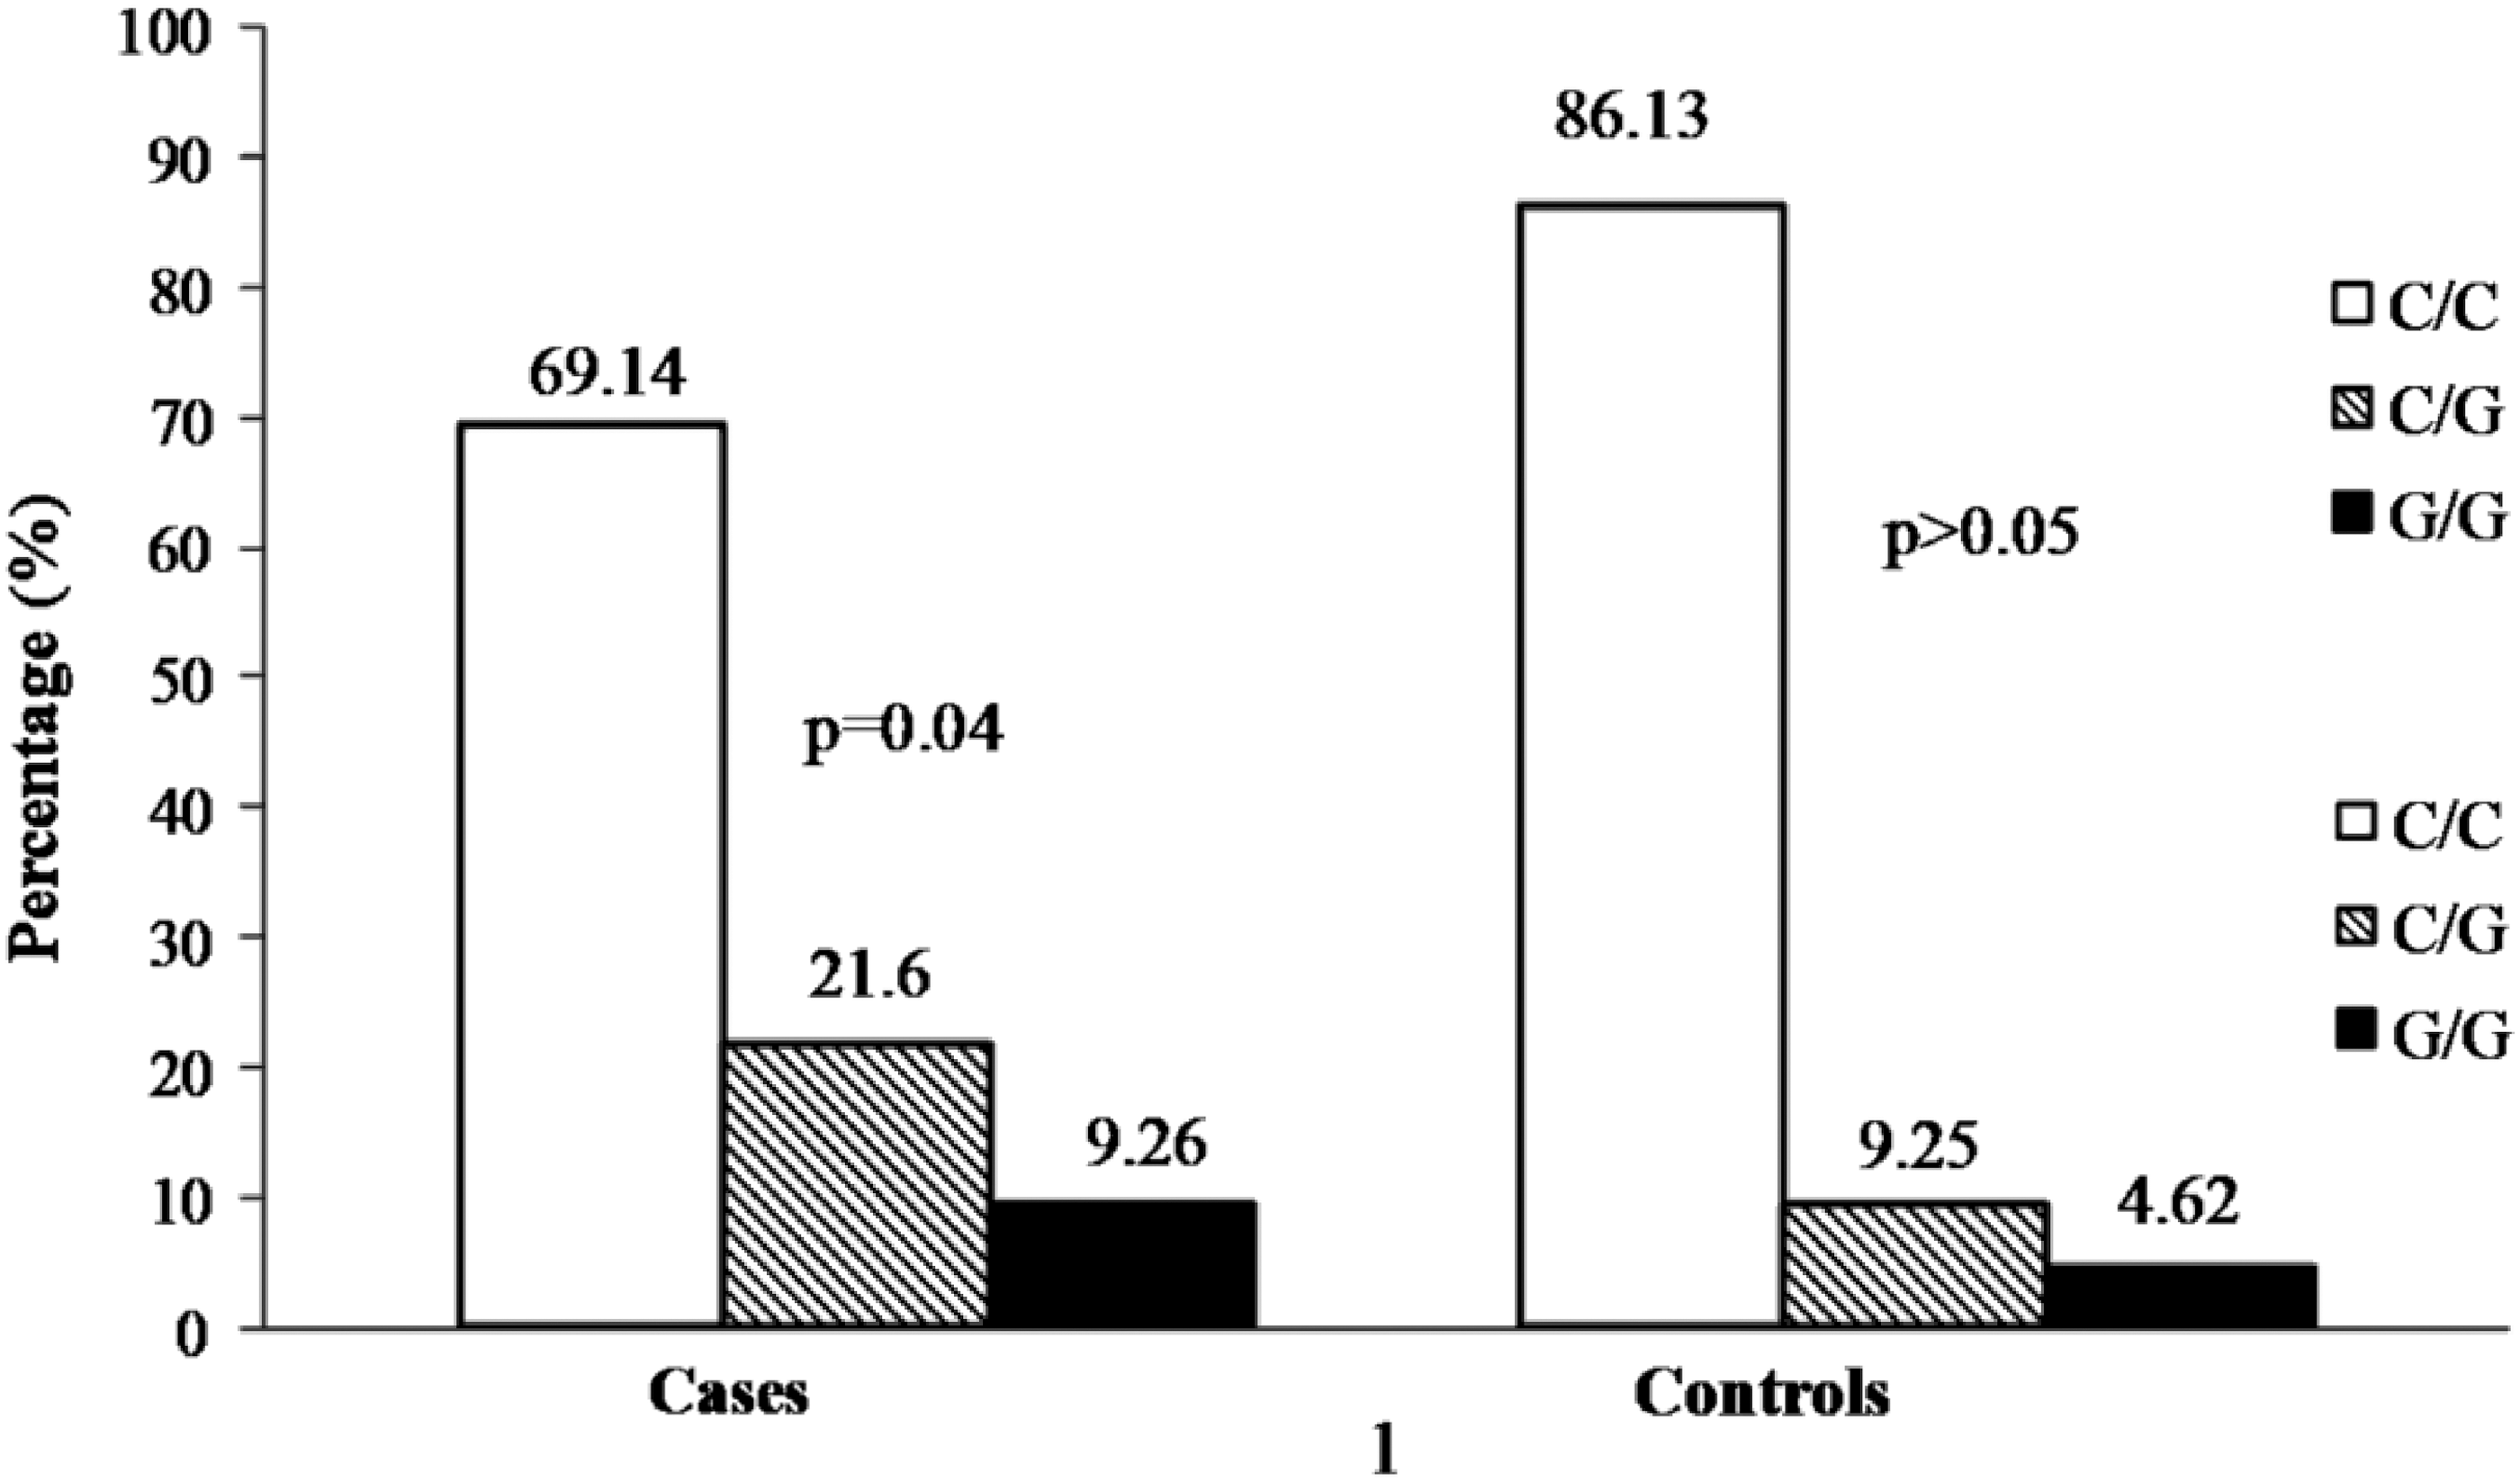
The genotype distribution of rs738409 of PNPLA3 in cases and controls is shown in Table 2. Higher frequencies of C/G and G/G genotypes of PNPLA3 gene were obtained in cases and controls (Fig. 2, P=0.04). The frequency of the minor allele, G of rs738409, was significantly higher in cases as compared to controls (P=0.003). The PNPLA3 genotype frequencies did not follow the Hardy–Weinberg equilibrium. The reproducibility of the genotyping data was checked by replicating the genotyping in 75 randomly selected samples.
The genotype distribution of rs738409 of PNPLA3 in cases and controls.
All values are given as mean±standard deviation; n, number of subjects.
P value<0.05 is statistically significant.
BMI, body mass index; WC, waist cercumference; HC, hip circumference; SBP, systolic blood pressure; DBP, diastolic blood pressure; FBS, fasting blood glucose; PP, postparandial; TG, triglycerides; TC, total cholesterol; LDL-C, low-density lipoprotein cholesterol; HDL-C, high-density lipoprotein cholesterol; VLDL, very-low-density lipoprotein; ALK, alkaline phosphatase; ALT, alanine transaminase; AST, aspartate transaminase; GGT, γ-glutamyl transpeptidase; HOMA-IR, homoeostasis model assessment of insulin resistance.
The association of the rs738409 C/C and C/G+G/G PNPLA3 genotypes encoding for the I148M protein variant, with clinical, anthropometric and biochemical measurements of cases and controls, is shown in Table 2. C/G+G/G genotypes were associated with significantly higher ALT (P=0.003), AST (P=0.04), fasting insulin (P=0.002) and HOMA-IR (P=0.05) in cases as compared to C/C genotype. We did not observe any association of variant with clinical and biochemical parameters in control subjects. The relationships of the rs738409 polymorphism with the metabolic parameters were not significant after adjustment for multiple comparisons.
Logistic regression analysis
On univariate logistic regression analysis, subjects with the PNPLA3 G/G genotype were at 3.4 times higher odds to develop NAFLD (OR, 3.4: 95% CI 1.2–10.3, P=0.02). Using a multivariate logistic regression model after adjusting for age, sex, BMI, and insulin, subjects with the G/G genotype showed 1.98 times higher risk of NAFLD (OR 1.98, 95% CI 1.43–2.73, P=0.04; Table 3).
n, number of subjects.
C/C genotype expressed as representative baseline with class interval (95%).
P value<0.05 is statistically significant.
NAFLD, nonalcoholic fatty liver disease; BMI, body mass index; CI, confidence interval.
Discussion
Our study indicated that the frequency of G allele of the rs738490 polymorphism of PNPLA3 was significantly associated with NAFLD, with a notable finding that subjects with C/G+G/G genotypes showed high risk of NAFLD. Santoro et al. 19 reported that the PNPLA3 conferred susceptibility to hepatic steatosis. The highest frequency of rs738409 (I148M) was found in Hispanics (0.49), who also had a higher prevalence of NAFLD. 9 Conversely, African Americans, who had a lower prevalence of NAFLD, and carried the I148M at a lower frequency (0.17). A study of three independent cohorts (Bruneck, Italy, population-based study) showed a strong association of I148M with age- and gender-adjusted ALT and AST levels. 20 The association of this SNP with the development of NAFLD has been shown in the Argentinian and white caucasian populations. 20 The association of PNPLA3 variant with NAFLD has been shown in early childhood, and is present in obese, nonobese, and diabetes subjects. 12,21,22 Furthermore, rs738409 exerted a strong influence not only on liver fat accumulation but also on the susceptibility to a more aggressive liver disease. 20,21
A review of data shows heterogeneity in effects of PNPLA3 gene polymorphisms on different metabolic parameters—TG, insulin levels, and insulin sensitivity. A number of studies conducted by Speliotes and his colleagues with the PNPLA3 gene showed an association with histological NAFLD; however, no association was evident with serum TG levels, other lipids, and glycemic parameters in white caucasian subjects. 23,24 Another study on 192 Danish twins, the rs738409 variant of the PNPLA3 gene was associated with decreased serum TG and TC levels and did not have any impact on hepatic fat. 25 Furthermore, in 330 German subjects, insulin sensitivity (as estimated by an oral glucose tolerance test and the hyperinsulinemic euglycemic clamp), serum C-reactive protein (CRP), and lipid levels were not associated with PNPLA3 gene polymorphism. 26 On the contrary, Wang et al. 27 studied 156 normoglycemic Taiwanese individuals with NAFLD and 723 controls and found that the rs738409 variant of the PNPLA3 gene showed an association with abdominal obesity, fasting insulin, and HOMA-IR values. Similar to this study in Taiwan, we have also shown that fasting insulin and HOMA-IR values were significantly increased in the presence of G/C+G/G genotypes only in cases, but not in the controls. Specifically, in our study, the values of TG and TC were slightly higher in cases with G/C+G/G genotypes but statistically not significant (P>0.05), similar to data on white Caucasians 24 and Danish subjects. 25
It is important to note that several factors, like nutrition habits, physical activity, alcohol intake, smoking, and ethnicity, may modify association of the PNPLA3 gene with lipids and insulin sensitivity, and hence, carefully designed studies are needed to evaluate these possible confounders. In particular, these issues need further studies in South Asians who are at higher risk of developing insulin resistance, T2DM, dyslipidemia, and other metabolic abnormalities and have culturally modulated and distinct dietary habits and lifestyle practices. 28
Some data of genetic association of NAFLD are available in Asian Indians. Recently, we have shown that the Asian Indians with polymorphisms (Pro12Ala and C161T) of the peroxisome proliferator activated receptor-γ (PPAR-γ) gene are predisposed to develop NAFLD. 29 In another study, we showed that the C allele and the G/C genotype of sterol regulatory element binding protein-2 1784 G→C was associated with increased risk of NAFLD. 30 In an important study, Petresen et al. 31 have shown that the polymorphisms C-482T and T-455C in the apolipoprotein-C3 (APOC3) gene were associated with NAFLD and insulin resistance in both Asian Indian and non-Asian men. NAFLD was present in 38% of APOC3 variant allele carriers and none of the wild-type homozygotes. Finally, Gupta et al. 32 showed association of adiponectin gene function polymorphisms (−11,377G/C and +45T/G) with necroinflammatory grade in liver and hypoadiponectemia.
A limitation of our study is the lack of data on siblings and other ancestral members of the recruited subjects, which could help in determining the effect of population stratification. Although it is not feasible to include a large number of subjects with NAFLD within a limited time period of the study, a larger sample size would further substantiate the findings.
Conclusion
In this study, we showed that Asian Indians with the rs738490G variant of PNPLA3 is predispose to develop NAFLD. Further prospective studies are required to confirm these results in Asian Indians in different geographical locations and other ethnic groups.
Footnotes
Acknowledgments
This study was supported by a grant from the Indian Council of Medical Research (no. 5/9/70/2008-RHM), Government of India.
The authors acknowledge the contribution of Mr. Khalid Mohd and Mr. Kirti Pratap, who performed several of the biochemical investigations. Finally, the cooperation of the subjects who took part in the study is greatly appreciated.
Author Disclosure Statement
The authors declare that they have no competing interests.