
Abstract
Background:
The optimal exercise load/intensity for exercise programs for individuals with metabolic syndrome has not been investigated. One method of determining optimal exercise load is to measure the blood lactate transition threshold (BLTT), referred to as the anaerobic threshold (AT). This study investigated the reproducibility of BLTT testing and the consequent determination of AT via the Mader method and a modified form of the Automatic Data Analysis for Progressive Tests (ADAPT) method in patients with metabolic syndrome.
Methods:
Fifteen, male patients diagnosed with metabolic syndrome and 15 healthy, male subjects each performed BLTT measurements on a treadmill at the same daily times on three different days. Peak oxygen consumption was also determined during testing.
Results:
There was no significant difference in treadmill velocity at AT determined by the Mader method or the modified ADAPT method within both groups (P>0.05). Both methods yielded good coefficients of variation. When combining both groups, the typical error also demonstrated good reproducibility. The mean treadmill velocity at AT was higher in the healthy compared to the metabolic syndrome group using both the Mader and the ADAPT method. Regression analysis and analysis of covariance (ANCOVA) demonstrated that this difference was largely due to a higher oxygen consumption (VO2) peak in the healthy group. The study also found an association between VO2 peak and waist circumference among the metabolic syndrome group.
Conclusions:
This study demonstrated that BLTT tests are reproducible in persons with metabolic syndrome. The modified ADAPT method may be the preferred method of determining treadmill velocity at AT because fewer factors are known to influence its determination.
Introduction
Lifestyle changes, most especially following a controlled exercise program, have been shown to play a major role in the therapeutic management of metabolic syndrome. 6 To maximize the exercise response for any person involved with a training program (including persons with metabolic syndrome), one needs to identify an individual's optimal exercise load (exercise intensity), duration of exercise, and exercise frequency. Standards have been set for the last two, 7 but it is more difficult to determine the first. Blood lactate transition thresholds (BLTT) have been shown to be the best indices for setting exercise intensity. 8 –13 It has been shown that an increase in physical activity is sufficient to elicit a training effect provided that the initial training intensity is at or above the anaerobic threshold (AT). 8 It is speculated that at intensities close to 100% of AT, sympathetic activity increases to a level that results in adaptive changes of regulatory hormones and muscle metabolism. 13,14 This method of exercise intensity determination has not been applied to training programs for individuals with metabolic syndrome. Optimizing exercise results for metabolic syndrome patients may also be important in improving exercise adherence levels, which are low in individuals with this syndrome. 15
Therefore, the main aim of this study was to investigate the most appropriate method of determining BLTT in persons with metabolic syndrome. Most BLTT methods can be broadly classified into two categories: Those using fixed blood lactate concentrations (e.g., the Mader method), and those using individualized lactate and ATs [e.g., the Automatic Data Analysis for Progressive Tests (ADAPT) method].
To use BLTT for determining the appropriate exercise intensity to be used in subjects with metabolic syndrome, it is necessary to determine the best method for measuring BLTT in such subjects, because this has not previously been attempted. In addition, because the BLTT of patients with metabolic syndrome has not been measured in other studies, this investigation aimed to determine the BLTT of such patients.
Methods
The Human Ethics Committee of the University of the Witwatersrand, Gauteng, accepted the study protocol.
Fifteen male patients diagnosed with metabolic syndrome and 15 healthy subjects each performed three BLTT tests. All healthy participants were age-matched with the patient group and had one or no components of metabolic syndrome. Patients were diagnosed with metabolic syndrome by clinicians using the harmonized guidelines. 2 The presence of any three of the five criteria denoted below constituted a diagnosis of metabolic syndrome: Waist circumference (≥94 cm), triglycerides (≥1.7 mmol/L) or drug treatment for high triglycerides, high-density lipoprotein cholesterol (HDL-C) (<1.0 mmol/L) or drug treatment for reduced HDL-C, elevated blood pressure (≥130/85) or on antihypertensive drug treatment, and elevated fasting glucose (≥5.6mmol/L) or drug treatment for glucose intolerance.
All participants underwent an oral glucose tolerance test (OGTT) for the detection of undiagnosed diabetes. Fasting and 2-hr glucose levels were measured using a glucose oxidase method (Roche Diagnostics, Mannheim, Germany) whereas fasting triglyceride, total cholesterol, and HDL-C levels were assayed using enzymatic assay methods (Roche Diagnostics, Mannheim, Germany).
The following were determined on the first day of laboratory testing: Height (measured to the nearest millimeter by a Seca Stadiometer, Hamburg, Germany); weight (measured to the nearest gram by a Charder electronic scale, Taiwan, China); waist circumference (taken as the greatest reading around the girth, midway between lateral lower ribs and the iliac crests); blood pressure (measured by a Honsun sphygmomanometer, Shanghai, China; sitting, average of two readings), and a BLTT test was performed and the time of day was noted.
The BLTT test was repeated at the same time of day a total of three times, with 1 day rest in between tests. As in the study of Heitcamp et al., 16 participants did not vary their usual dietary habits, exercise, or leisure-time activities between the three tests. All participants did not exercise for 12 hr before the testing sessions.
The BLTT test used an initial treadmill speed of 2.5 kph at a 5% gradient with speed increments every 4 min. The treadmill speed was modified depending on the response of a participant to ensure the collection of at least six blood samples for lactate analysis. After signaling impending exhaustion, participants were encouraged to continue to complete the 30-sec period already begun.
Electrocardiographic responses and oxygen consumption (VO2) were measured at the same time (Cortex Biophysik Metalyzer 3b CPX system, Leipzig, Germany). The electrocardiograph (ECG) was used to monitor electrocardiographic responses during testing of the participants. Testing was stopped if any ECG abnormalities were observed. VO2 at exhaustion was recorded as the VO2 peak. No abnormalities in ECG readings were observed. This protocol was designed taking into consideration the low level of physical conditioning of patients with metabolic syndrome.
Lactate concentration was measured from whole-blood samples taken from the fingertip using the Lactate Scout automated analyzer (Lactate Scout, SensLab, Leipzig). Blood samples (collected from finger capillary vessels using a lancet) were taken at the end of each exercise period within 30–40 sec of the participants standing still on the treadmill. The fingertip was first wiped with water to remove the sweat and then it was dried before the blood sample was collected. The participant continued exercising within one minute of standing.
The BLTT that was determined for each participant will be defined in this study, for purposes of terminology, as AT. AT, in this study, will be defined as the workload (treadmill velocity given as km·h−1) marked by a rapid rise in blood lactate denoting the upper limit of equilibrium between lactate production and clearance. 17 The treadmill velocity at AT for each BLTT test was determined using two methods: The Mader method and the ADAPT method, as these are the two most frequently used and recognized methods for assessing AT.
The Mader method determines AT as the workload that corresponds to the fixed blood lactate level of 4 mmol·L−1. 18 This was calculated using Lactate Scout software. The software fits the data with a third-degree polynomial regression curve and then determines the velocity at 4 mmol·L−1 blood lactate
The ADAPT method determines AT from the individual shape of the velocity–blood lactate curve (not from a fixed blood lactate concentration). The ADAPT method is based on the Dmax mod method. 19 It determines AT by calculating the workload corresponding to the greatest perpendicular distance from a regression curve relating workload to blood lactate and a straight line formed by the first and last points of the curve. When using the ADAPT method, the Australian Sports Commission modified the Dmax mod analysis by defining the first point as the workload preceding a 0.4 mmol/L rise in blood lactate above the baseline. 17 However, the use of a particular datapoint on the curve to determine the first point is artificial and arbitrary, and this study redefined this point as the lowest point on the curve. This point was then connected to the last point of the curve that was defined as the lactate concentration measured at VO2 peak (Fig. 1). The modified ADAPT method used in this study allows for a consistent and reproducible first and last point of the curve. A two-phase exponential regression was fitted to the datapoints in our modification of the ADAPT method (GraphPad Prism Version 3.02) (Fig. 1). The regression curves fitted to our data yielded high correlations (R 2=0.9691–0.9995).
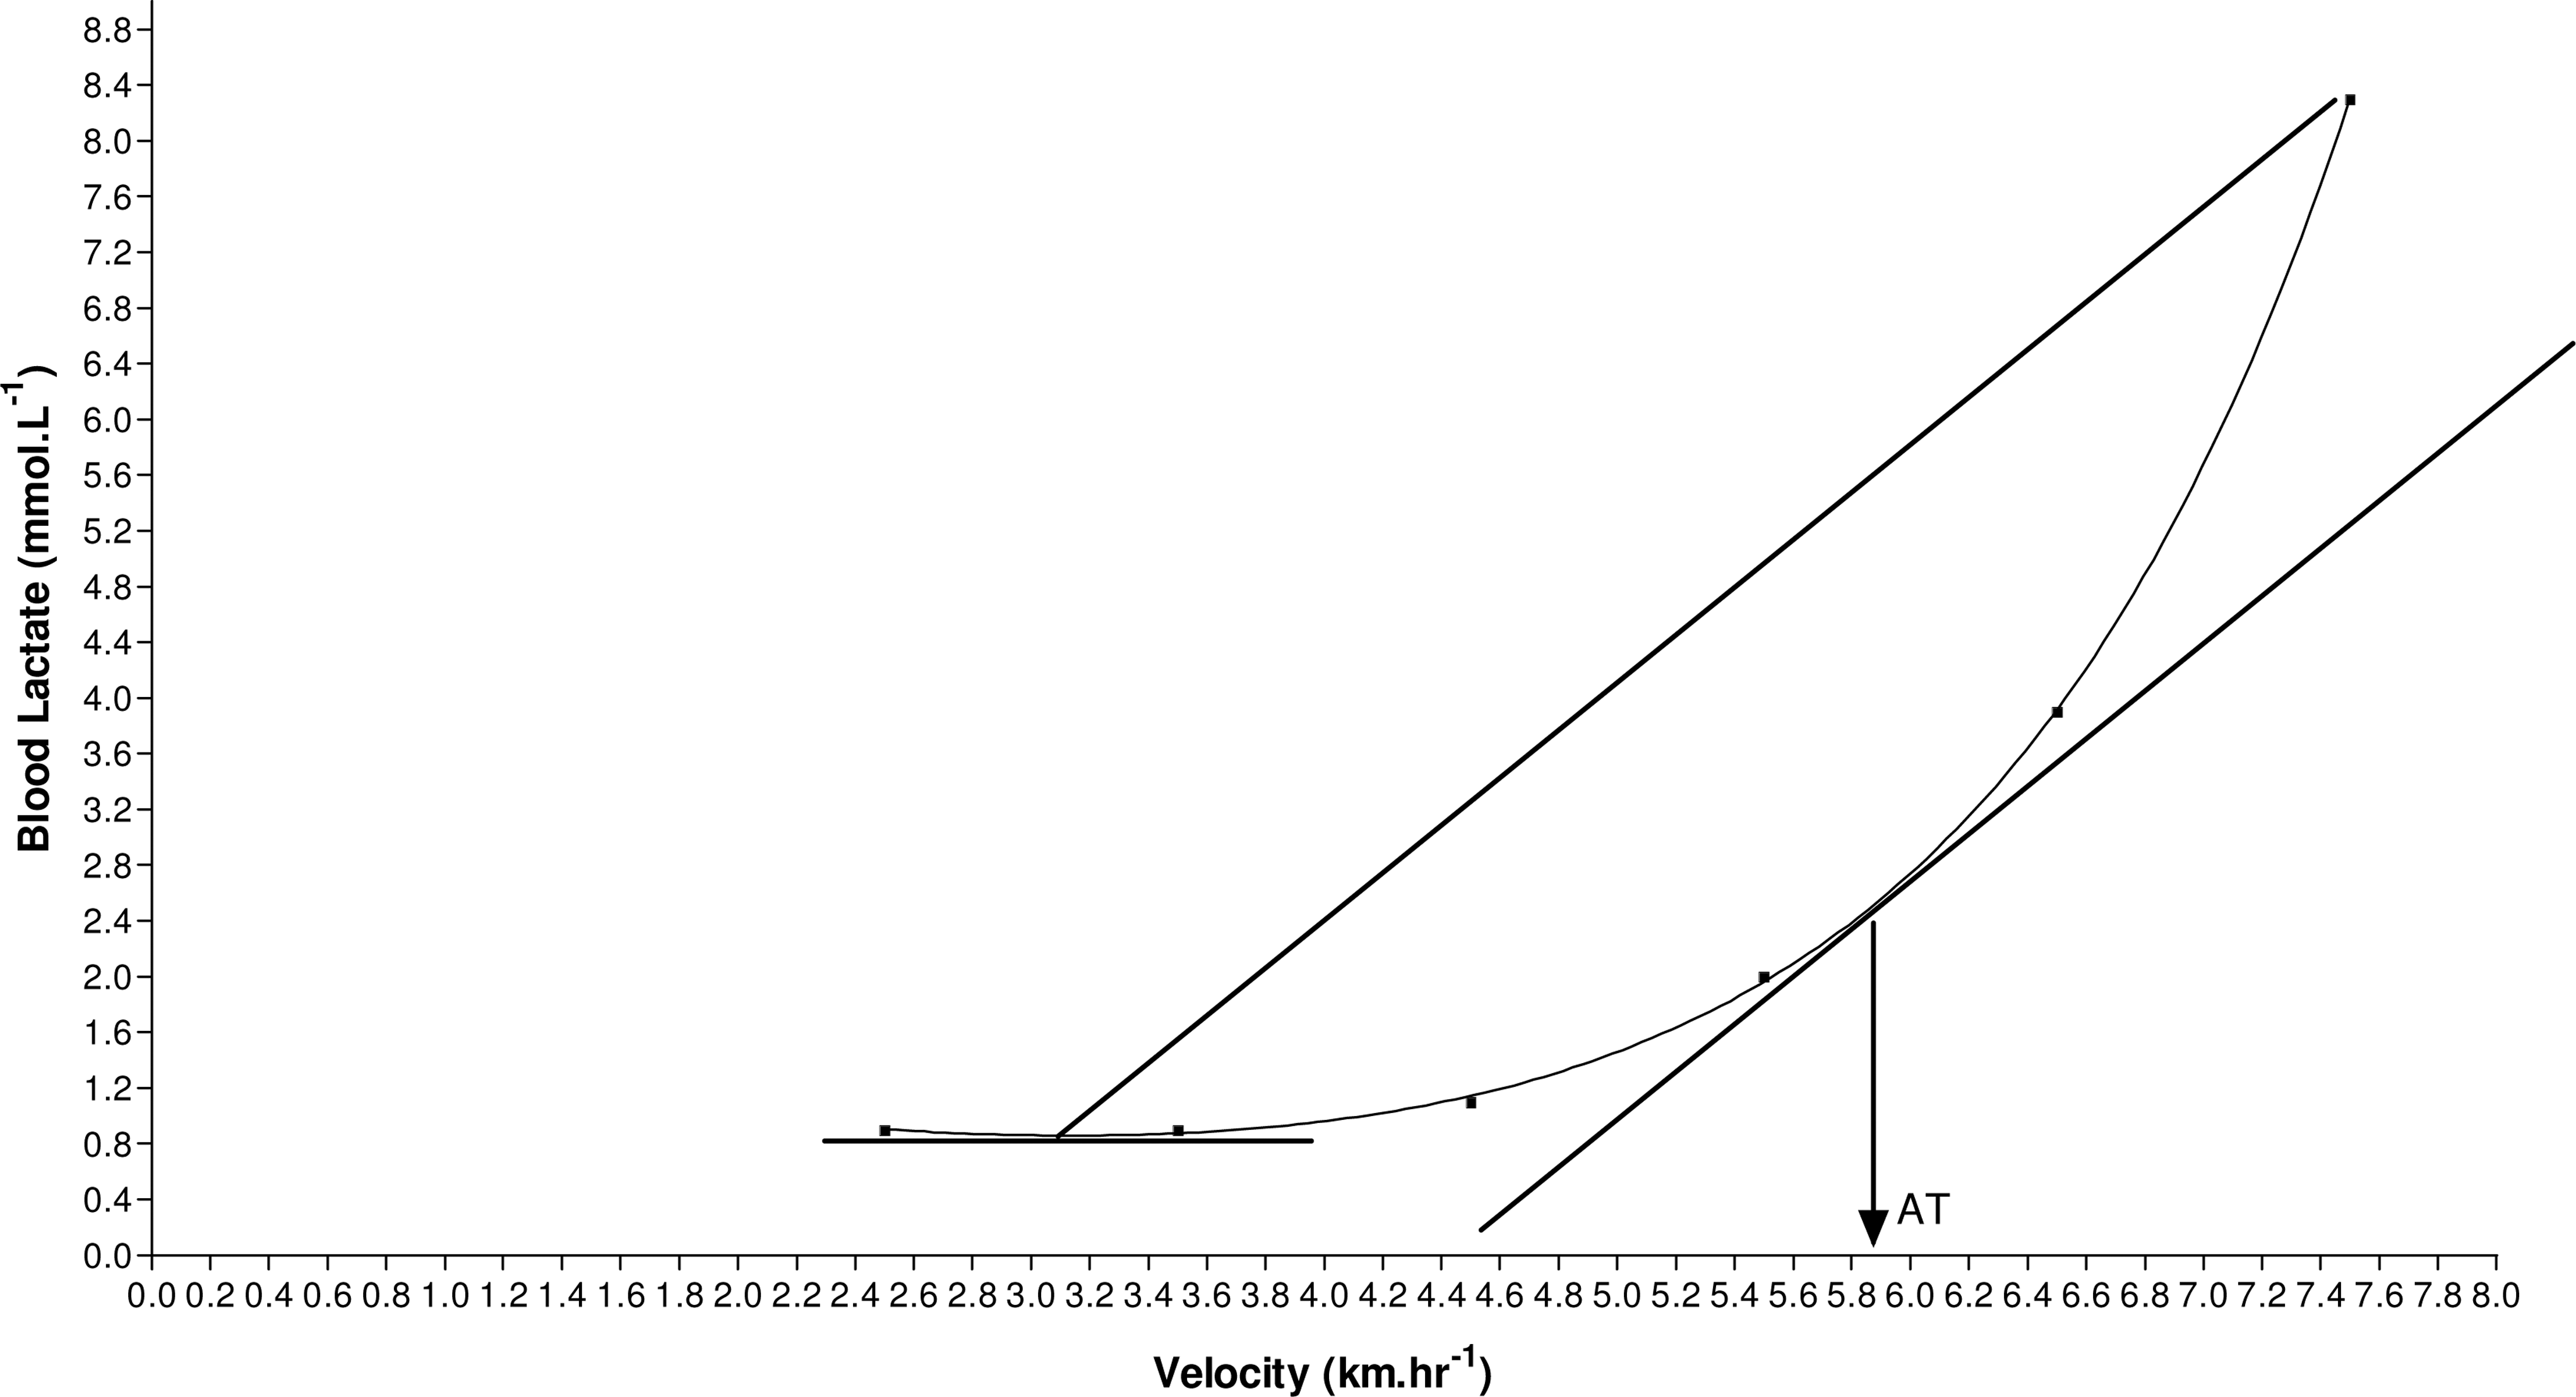
The modified Automatic Data Analysis for Progressive Tests (ADAPT) method, using the lactate value at oxygen consumption (VO2) peak as the end point and the lowest point on the curve as the first point, to measure anaerobic threshold (AT).
The % VO2 peak at AT was calculated by first determining the VO2 at AT. This was determined in the same way described above (ADAPT method), but with VO2 on the x axis as opposed to velocity. The VO2 at AT was then expressed as a percentage of VO2 peak.
Statistical analysis
Data distribution was analyzed using Shapiro–Wilk W test, and any variables that were found to be significantly skewed were log transformed to normality, i.e., P>0.05 by the Shapiro–Wilk W test. Coefficients of variation [CV=(Standard deviation/Mean)×100] were calculated between testing sessions for the two groups. We confirmed our findings by also using the typical error technique as reported by Hopkins. 20 The Bland–Altman method was used to assess agreement between the Mader and modified ADAPT methods. The average values of the two groups were compared using the independent t statistic. Pearson correlation analyses were used to determine the principal correlates of the VO2 peak and the AT. Variables that gave significant correlations in the univariate analyses (P<0.1) were then used as independent variables in two separate multiple regression models in which VO2 peak and AT were the dependent variables. Collinearity was assessed by calculating the variance inflation factors (VIFs) and variables with a VIF >10 were excluded from the initial regression models. Backward, stepwise regression analysis was then performed until only variables with P<0.05 remained in the model. One-way analysis of variance (ANOVA) and analysis of covariance (ANCOVA) were then used to confirm the data from the regression models. The results of the multiple regression models were the same for AT measured using the ADAPT or Mader methods.
Results
Table 1 depicts the physical characteristics of the participants. There were significant differences between the groups in waist circumference, HDL, triglycerides, systolic blood pressure, and VO2 peak. Fasting and 2-hr glucose levels, total cholesterol, diastolic blood pressure, body mass, and age were not significantly different between the groups. No undiagnosed diabetic subjects were detected.
P<0.05.
The percentage of VO2 peak associated with AT was 73.4±7.8% in the group with metabolic syndrome, and 75.8±8.8% in the group without metabolic syndrome. This difference was not significant (P>0.05). There was no significant difference (P>0.05) in velocity at AT determined by the Mader method or the modified ADAPT method in both participant groups. Both methods of determining velocity at AT yielded good (<4%) CV values. There was no statistical difference between the CV values of the two groups (Table 2). The healthy males attained a significantly higher velocity at AT than that attained by the males with metabolic syndrome for both the Mader method (P<0.05) and the modified ADAPT method (P<0.05) (Table 2).
P<0.05 versus healthy males.
AT, anaerobic threshold.
Our findings of good reproducibility were confirmed when we used an alternate method of calculating reproducibility, i.e., the typical error technique reported by Hopkins, 20 which gave values of 3.1%, 0.29 km·h−1 and 4%, 0.27 km·h−1 for the Mader and modified ADAPT methods, respectively. The Bland–Altman plot was used for determining the level of agreement between the two methods (Fig. 2) and demonstrated that the Mader method gave a higher value than ADAPT, with a mean difference of 0.82±0.37 km·h−1 (P=0.03). In addition, this study found a close exponential relationship between treadmill speed and plasma lactate concentration using a two-phase exponential regression fit to the blood lactate values (R 2=0.96–0.99).
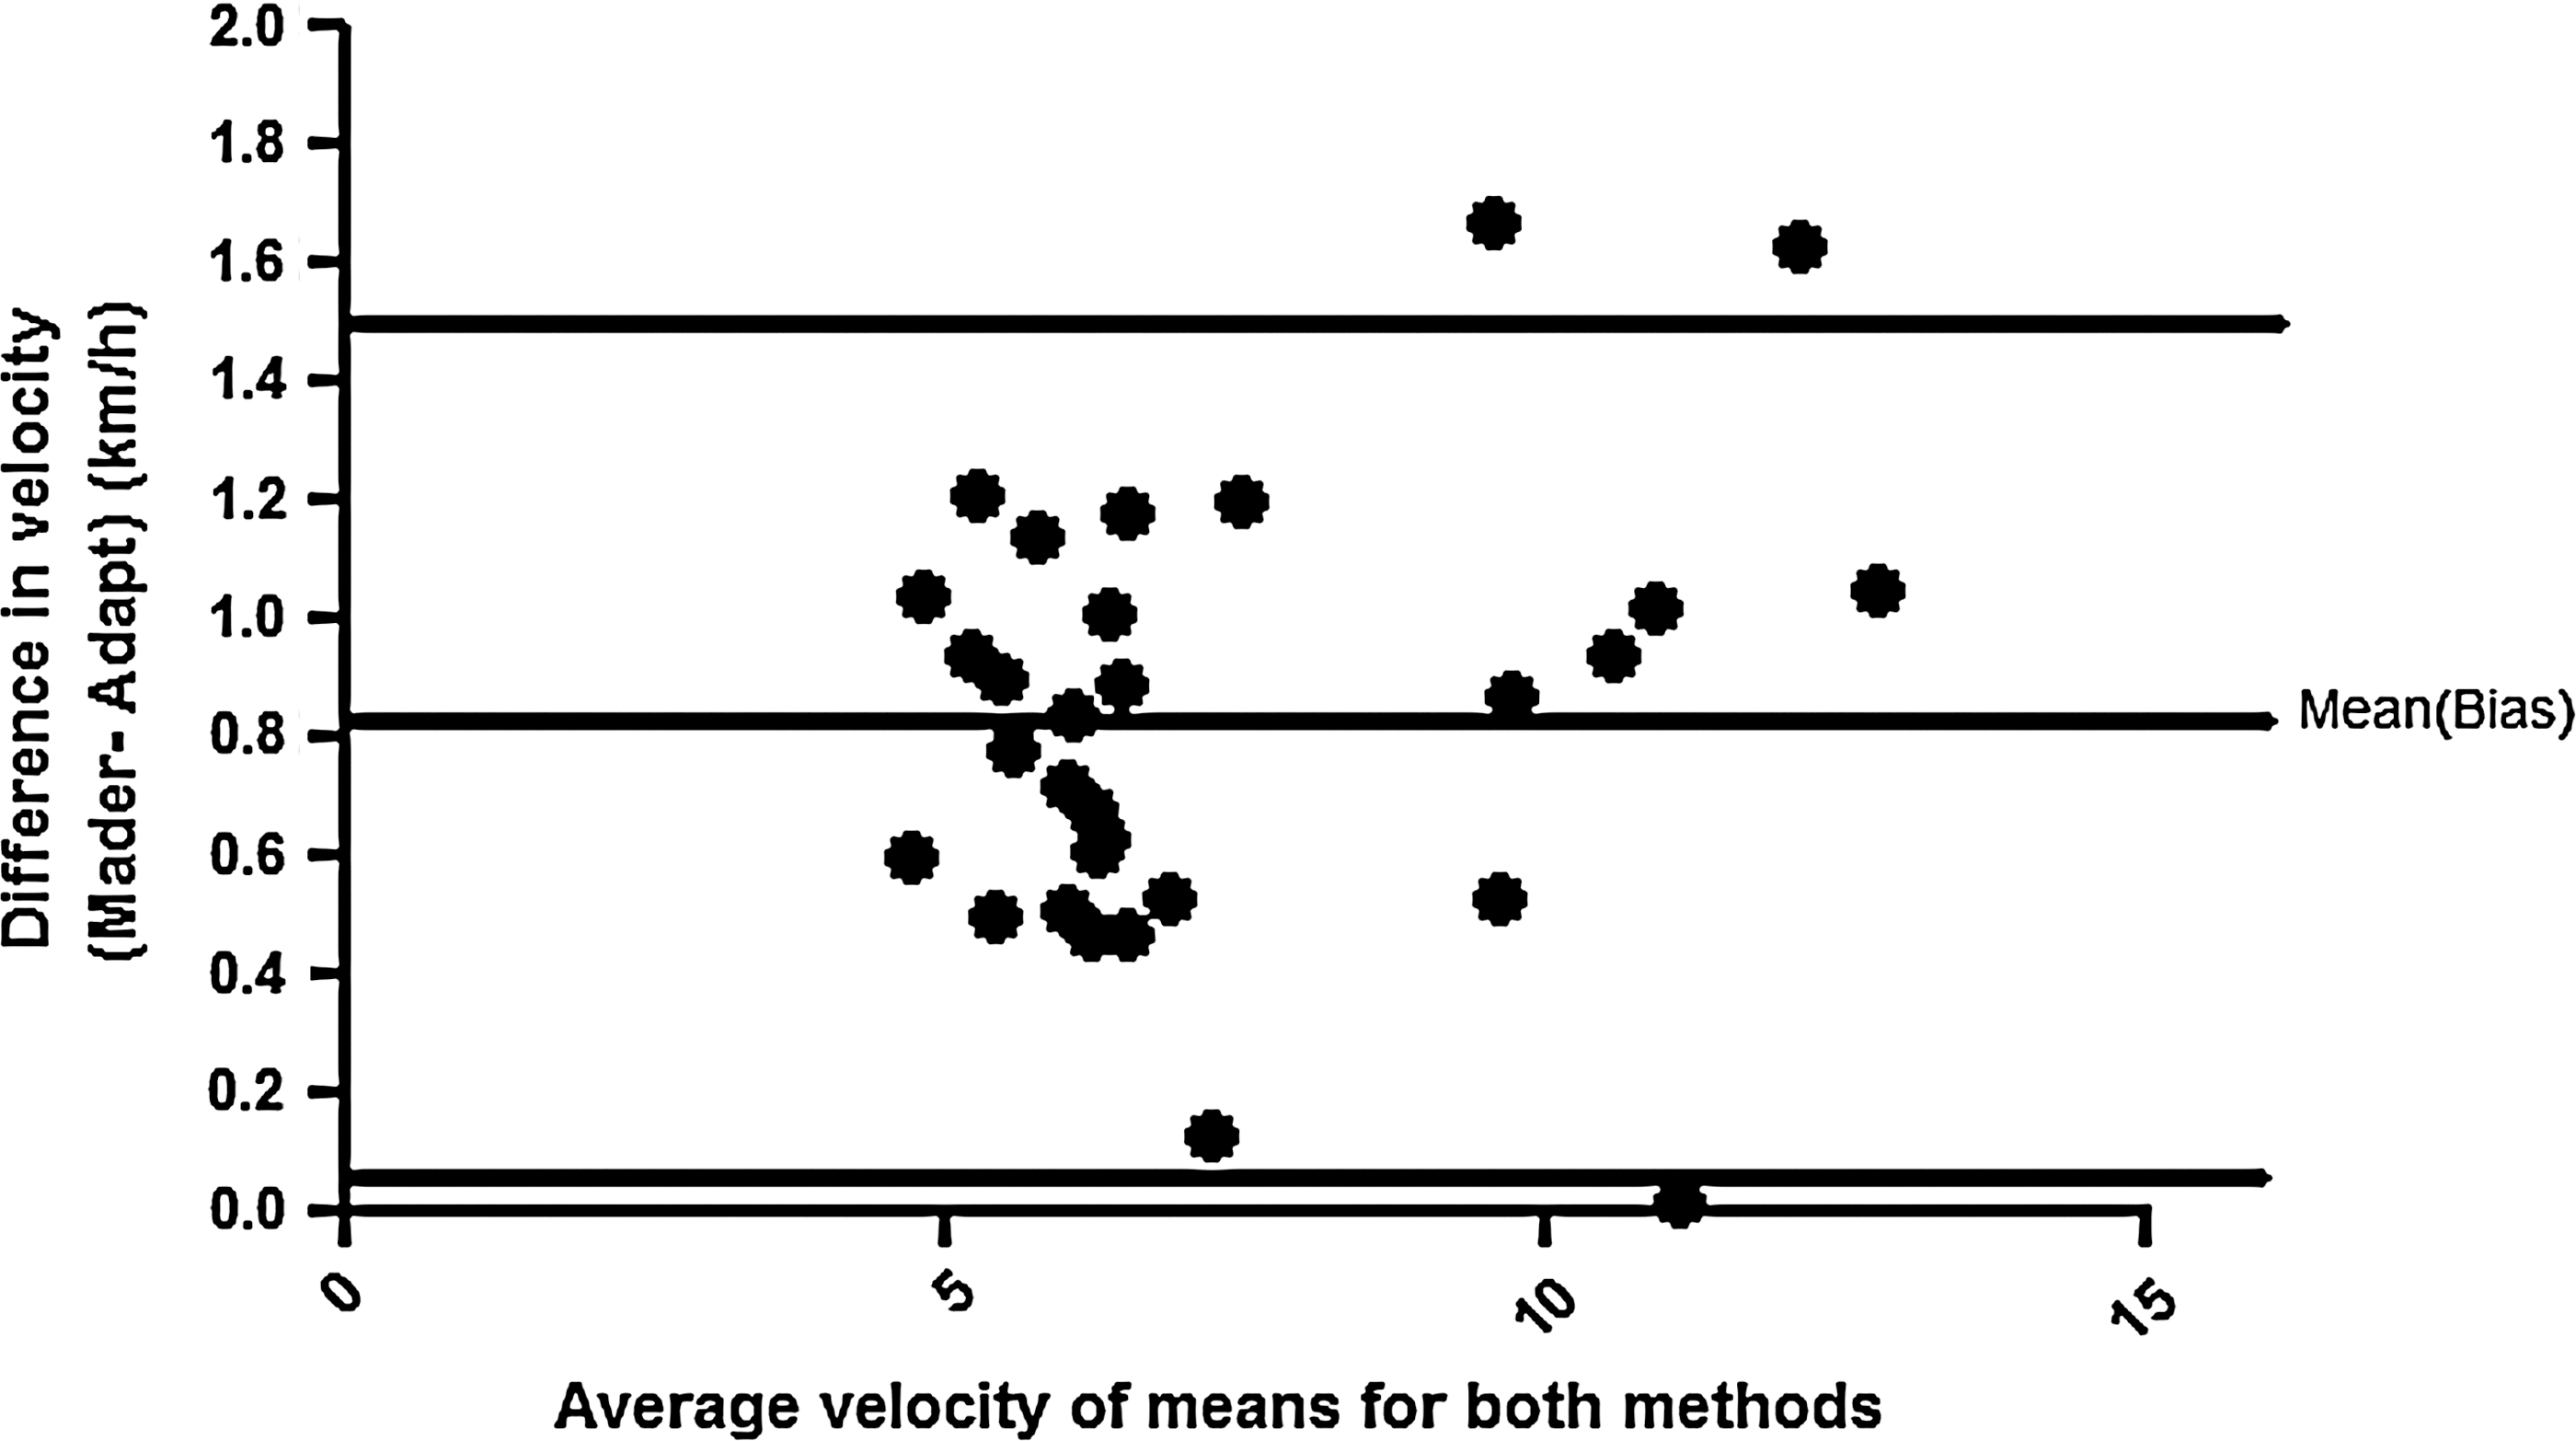
Bland–Altman comparison between the Mader method and the modified Automatic Data Analysis for Progressive Tests (ADAPT) technique (data for the two groups of subjects have been combined). The two horizontal lines depict the 95% limits of agreement (from 0.09 to 1.55), with a mean difference of 0.82±0.37 km·h−1 (P=0.03).
Pearson correlation analysis demonstrated that the VO2 peak and the AT both correlated with each other and with the following variables: Body mass index (BMI), weight, waist circumference, diastolic and systolic blood pressure, and 2-hr plasma glucose levels. These variables, as well as coding variables for the presence/absence of metabolic syndrome, were then included as independent variables in two separate backward, stepwise regression models in which VO2 peak and AT were the dependent variables. In both models, BMI and waist had a VIF >10 and therefore BMI was excluded from each of the initial regression models. In the first regression model, waist circumference and metabolic syndrome were found to be the principal determinants of the VO2 peak (see Table 3). These data suggest that the lower VO2 peak of participants with metabolic syndrome is associated with their higher waist circumference. This was confirmed in an ANCOVA comparing VO2 peak between the two participant groups, where waist circumference was added as a covariate. This attenuated the F value from 11.4 to 4.34 and the P value from 0.002 to 0.05. In the second regression model, weight and VO2 peak were found to be the principal determinants of AT (see Table 3). This suggests that the lower AT of participants with the metabolic syndrome may be due to differences in weight and/or VO2 peak. This hypothesis was tested by comparing AT in control and metabolic syndrome patients using ANCOVA adjusted for either weight or VO2 peak. Adjusting for weight attenuated the F value from 7.49 to 4.46 and the P value from 0.01 to 0.04, whereas adjusting for VO2 peak attenuated the F value to 0.0006 and the P value to 0.98. This demonstrates that the lower AT values in subjects with the metabolic syndrome is largely associated with their lower VO2 peak levels.
Presence of the metabolic syndrome was coded as 1 and absence was coded as 0.
VO2, oxygen consumption.
Discussion
The metabolic syndrome group in this study had higher waist circumference, higher triglyceride levels, and lower HDL-C levels when compared to the healthy group. These results agree with the definition used in this study to classify metabolic syndrome.
Considering that body mass and age were not different between the two groups, the lower VO2 peak found in the metabolic syndrome group agrees with the Kuoppio study, 21 which found directly determined VO2 max to be lower in persons with metabolic syndrome. Also, Laaksonen et al 22 showed that men with a VO2 max of <29.1 mL·min−1·kg−1 were three to four times more likely to have metabolic syndrome than those with VO2 max of ≥35.5 mL·min−1·kg−1. The difference in VO2 peak between the two groups cannot be due to the healthy group training more than the metabolic syndrome group, because all subjects in the study had not exercised regularly for a minimum of 4 weeks prior to the testing.
Multiple regression analysis suggested that the lower VO2 peak of metabolic syndrome participants is associated with their higher waist circumference. This is an original finding, and it highlights the importance of reducing waist circumference in individuals with metabolic syndrome to improve energy production and health. It is interesting to note that both longitudinal 23 and cross-sectional studies 24 have shown that, of all anthropometric variables measured, only waist circumference was negatively correlated with level of fitness. It is not known why waist circumference specifically influences VO2 peak. However, waist circumference is a proxy indicator of visceral fat mass, 25 and this body fat depot is a negative regulator of whole-body insulin sensitivity 26 and may therefore limit glucose metabolism in skeletal muscle.
To our knowledge, no other study has shown that the velocity at AT is lower in patients with metabolic syndrome and that this is largely associated with their lower VO2 peak. This finding supports the notion of a lower level of aerobic fitness in patients with metabolic syndrome, as has been demonstrated in other studies. 27,28 Also, the higher velocity attained at AT by the healthy participants when compared to the participants with metabolic syndrome, confirms the observation that persons with metabolic syndrome exhibit a lower level of physical conditioning than their healthier counterparts. 21
The percentage of VO2 peak associated with AT (% VO2 peak @ AT) is not significantly different in the group with metabolic syndrome when compared to the group without metabolic syndrome. It is believed that the % VO2 peak @ AT and VO2 peak are determined by different factors, with VO2 peak being dependent on cardiovascular factors, such as cardiac output, stroke volume, and the % VO2 peak @ AT being dependent on peripheral factors such as number of mitochondria and muscle fiber type. 8,9 This suggests that the metabolic syndrome group had a lower performance in an index of central, cardiovascular function yet similar characteristics in peripheral muscle morphology when compared to individuals without metabolic syndrome.
The Mader method of determining AT yielded good reproducibility in this study (see Table 2). Heitkamp et al. 16 used correlation coefficients for treadmill speed and also found good reproducibility of AT at 4 mmol·L−1 for the Mader method. CV values for velocity at AT determined by the modified ADAPT method in our study were not different from those yielded by the Mader method (Table 2).
The advantage of the ADAPT method is that it calculates AT from the shape of the lactate–work intensity curve. Frohlich et al. 29 found that nutritional factors (glycogen depletion as a result of dietary or training manipulations) did not alter the shape nor the slope of the lactate–work intensity curve. In contrast, nutritional and training/recovery factors will influence the calculation of AT when fixed blood lactate levels are used, as is the case with the Mader method. 17 Urhausen and Kinderman 30 also showed that AT determined via fixed blood lactate levels in a glycogen-depleted state will overestimate endurance capacity, while this threshold determined from the shape of the lactate–workload curve is hardly changed. Furthermore, some individuals with very low levels of conditioning do not reach 4 mmol·L−1 lactate, but one can still use the shape of their curve to determine AT. In addition, the Bland–Altman analysis showed that, when data from the two subject groups were combined, the Mader method gave a higher value for the AT compared to the ADAPT method, with a mean difference of 0.82±0.37 km·h−1. The Mader method uses a fixed blood lactate level of 4 mmol·L−1, yet mean maximal steady-state exercise blood lactate values range from 3.0 to 5.5 mmol·L−1. 9 In view of our results, it is possible that a fixed lactate level of 4 mmol·L−1 is too high and more studies need to be performed to determine if this fixed level of lactate is appropriate for determining AT.
The technical error of measurement (TEM, also called the standard error of measurement: √Σdi 2 /2n) for AT determination using the ADAPT method has been shown to have good precision for athletes tested at the South Australian Sports Institute (TEM%=1.5%). 17 No study has investigated the applicability of this method in the clinical environment. This study found that the modified ADAPT method can be used in the clinical environment with good reproducibility. This finding was also confirmed by the method that Hopkins 20 has set up to test reliability of data. The typical error obtained via this method also shows good reproducibility of velocity at AT using both the Mader and the modified ADAPT methods.
Swart et al. 31 reviewed the reliability and accuracy of the Accusport and Lactate Pro portable blood lactate analyzers. These researchers stated that the changes in blood lactate concentration at threshold that occur with training (approximately 0.7 mmol·l−1) might be of a smaller magnitude than the level of error inherent in the portable blood lactate analyzers (up to 0.35 mmol·L−1 at 5 mmol·L−1, or 0.7 mmol·L−1 at 10 mmol·L−1). This study used the ADAPT method and velocity at AT in determining BLTT, and found the level of error inherent in the Lactate Scout (0.27–0.29 km·h−1) is smaller than the changes that can occur with training (0.5–1.6 km·h−1). 17 Thus, the use of treadmill speed (work load) rather than blood lactate concentration to denote the threshold has improved the reliability of the BLTT.
The AT has been used in prescribing exercise intensity among healthy, nonathletes 8 and among adults with cardiac disease. 12 As far as the authors are aware, this is the first study to investigate AT among adults with metabolic syndrome. Measuring AT on a regular basis in such individuals is straightforward. The test takes only 20–30 min to complete, and automated blood lactate analyzers have made lactate measurement simple and accessible. Most patients find the VO2 peak tests uncomfortable and difficult to perform. Lactate measurements are easier to administer because they can be performed during subpeak exercise and do not require highly specialized staff. In addition, regular monitoring of changes in AT motivates individuals by showing their improvement in endurance capacity as their BLTT curve shifts to the right.
Typical changes in blood lactate levels during exercise range from 1.2 mmol/L to 11 mmol/L for athletes, 17 5 mmol/L in heart disease patients, 12 and 8 mmol/L in healthy subjects. 8,9,12 The changes are similar across different modes of activity (running, cycling, arm ergometer). 9
The current study shows that AT measurements can be used to establish an exercise prescription for persons with metabolic syndrome. This can be accomplished by first asking the subject to exercise for 20 min at 85% of the treadmill velocity at which AT occurred. This would slowly be increased over 12 weeks to 45 min at 100% of the treadmill velocity at which AT occurred (if a cycle is used, watts will be used instead of velocity). The intention of using AT to prescribe exercise is to prevent an exercise load that is too small or too strenuous.
Conclusions
This study showed that the BLTT is reproducible in persons with metabolic syndrome, and that BLTT tests can be used to set the exercise load for persons with metabolic syndrome. The Mader and ADAPT methods of determining the AT were similarly reproducible. The ADAPT method may be preferable because fewer factors influence its determination. In addition, our modifications to the ADAPT method yielded acceptable reproducibility. In addition, this study found that the lower VO2 peak and velocity at AT in individuals with metabolic syndrome was associated with a greater waist circumference and a lower VO2 peak respectively.
Footnotes
Acknowledgments
The authors would like to thank Lancet Laboratories for their support with the blood analyses.
Author Disclosure Statement
There is no conflict of interest in connection with the submission of this manuscript