
Abstract
Background:
The concept of metabolic syndrome has been subject to etiological and clinical controversies in recent years. Associations among the five risk factors (obesity, hypertension, hyperglycemia, high triglyceride levels, and low high-density lipoprotein cholesterol) may help establish the validity of the concept, especially in a cohort representative of an actual population.
Methods:
We used principal component analysis (PCA) to analyze the structure of the physiological components of metabolic syndrome in 7213 patients contained in an administrative database for the Centre Hospitalier Universitaire de Sherbrooke in Sherbrooke, Quebec, a realistic cohort with diverse medical histories. We validated the results by repeating the analysis on stratified and random subgroups of patients, and on different combinations of risk factors. The first axis of the PCA was used to predict coronary heart disease (CHD) and diabetes.
Results:
The two first axes explained 53% of the variance. The first axis (33%) was associated in the expected direction with all five predictor variables, consistent with its interpretation as metabolic syndrome. The first axis was more predictive of subsequent CHD and diabetes than the formal definition of metabolic syndrome.
Conclusions:
These results suggest that the concept of metabolic syndrome accurately captures an existing underlying physiological process. A continuous indicator could be constructed to identify metabolic syndrome more accurately, thus improving risk assessment for CHD and diabetes mellitus. Metabolic syndrome can be measured well even without all five predictors. However, discrepancies with other studies suggest that our results may not be generalizable, perhaps because our cohort tends to be sicker.
Introduction
NCEP ATP III
1
BMI cutoffs chosen based on report of waist circumference equivalent from the Framingham Offspring Study; weight cutoffs corresponding to the 66th percentile of available weights in the Framingham population (same percentile than the BMI's cutoffs).
NCEP ATP III, National Cholesterol Education Program Adult Treatment Panel III; BMI, body mass index; HDL-C, high-density lipoprotein cholesterol.
There have been several studies of the validity of metabolic syndrome using factor analysis, but they often disagree. 4 –10 Some identify a single syndrome 4 whereas others identify multiple independent processes related to metabolic syndrome. 5 –8 Factor analysis is primarily used in the social sciences to evaluate questionnaires composed of items designed specifically to measure preidentified constructs (latent variables). For this reason, factor analysis has come under some criticism as being overly subjective. 11
In contrast, principal component analysis (PCA) is an efficient representation of the correlation structure of a set of variables. As such, it is not useful for hypothesis testing, but it is the least biased way to understand patterns among variables and thereby to look at the underlying processes producing these patterns. In contrast to items on a questionnaire, physiological variables are not devised to measure an a priori construct or process. Physiological data can be used to detect and measure such underlying processes. Thus, unless the processes are already well identified and characterized, PCA is a preferable method because it imposes no biases or presuppositions other than the choice of variables. 12 Thus, PCA should allow us to see if something like metabolic syndrome emerges from the data when we are not designing models specifically to detect it.
The first question PCA can help us answer is: What is the dimensionality of the data? In the case of metabolic syndrome, dimensionality is a crucial question because the validity of the concept of a single syndrome hinges on our ability to describe it with a single variable. Each PCA axis is independent (orthogonal) from the others and can thus be considered a variable corresponding to a dimension; so if we require two axes to describe most of the variance in our data, it implies that at least two independent processes are present.
Second, how do the raw variables associate with each dimension? Again, this is a crucial question for metabolic syndrome. If the primary axis is tightly associated with all five predictors in the right direction, then we are right to interpret a single syndrome and we are right to include all five predictors in its definition. However, if only four predictors associate with this first axis, the missing predictor is not an important part of metabolic syndrome, or the concept as traditionally defined is not valid.
Finally, how does each individual score on each axis? At a clinical level, this should allow doctors to assess the composite risk for a single patient. At an analytical level, the ability to assign scores allows us to perform subsequent analyses including, for example, an assessment of the predictive value of each axis for outcomes such as incidence of CHD and diabetes mellitus.
Therefore, our objectives are to: (1) Validate the dimensionality of the syndrome; (2) propose a continuous indicator to define metabolic syndrome; (3) compare the new definition to the standard definition for their capacity to predict CHD and diabetes outcomes; and (4) assess whether metabolic syndrome can be well measured without all five predictors. We hypothesized that a clear PCA axis for metabolic syndrome would outperform the standard definition, which loses most of the original information by dichotomizing each of the five variables and then further dichotomizing the number of these present.
In addition, properly validating a PCA analysis allows further insight into the physiological processes determining the observed patterns. PCA is only valid when it is stable across subgroups of the population, such as women or men, meaning that in each subgroup it will yield the same associations among the risk factors and thus be represented by an axis with the same interpretation (the metabolic syndrome). Conversely, a lack of stability could be informative: Different axis structures for men and women would imply different regulatory networks and pathways of disease progression by sex. For metabolic syndrome, it is particularly important to validate that results are stable across sex, age, and disease status. The lack of any of these would tend to invalidate a general concept of metabolic syndrome and would suggest that pathways of disease progression and dysregulation are context dependent, a real possibility.
Methods
Data source and study patients
The cohort studied was composed of patients older than 18 years old with at least one visit (outpatient or inpatient) at the Centre Hospitalier Universitaire de Sherbrooke (CHUS) from January 1, 2002, to December 31, 2003. Vital signs, clinical data, and anthropometric measures were collected from the patients along with data for International Classification of Diseases (ICD-9 and ICD-10 codes) and demographic information, such as home postal code. We excluded patients having one or more missing data points on one of the five risk criteria for metabolic syndrome (weight as a clinical common measure of excess adiposity, arterial blood pressure, glycemia, HDL-C, or triglycerides), leaving us with 7213 patients of the 71,151 patients available. A complete data set is necessary to conduct PCA without using any form of imputation methods. Data were obtained via the query system Centre Informatisé de Recherche Évaluative en Service et Soins de Santé (CIRESSS), which is directly linked to the clinical electronic health records of the institution; thus, our cohort includes all patients meeting the above criteria.
Definition of metabolic syndrome
We compared three definitions of metabolic syndrome. (1) For the traditional definition, we used the updated NCEP ATP III thresholds to define formal criteria. The thresholds for each of the metabolic syndrome's criteria are presented in Table 1. When formal criteria were missing, we looked for surrogate criteria based on results from a previous validation study. 13 When more than one measurement for a specific criterion was available during the baseline period, we used the most extreme value (highest for all criteria except for HDL-C, where the lowest value was used). Patients were then categorized into two categories: No metabolic syndrome (less than three criteria met) and having metabolic syndrome (at least three criteria met). Frequencies of measurement and fulfillment of each criteria in the overall population were reported previously. 14 (2) We used the first PCA axis as a continuous score related to metabolic syndrome, a ''degree of metabolic syndrome.'' (3) We also dichotomized the first PCA axis such that the patient either has metabolic syndrome (score greater than zero) or not (score lower than zero). To evaluate the contribution of blood pressure in the data with a single variable, we used mean arterial pressure (MAP) as the standard. 15,16
Outcome variables
Summary discharge forms provided the ICD codes used to identify the incidence of CHD (ICD-9 codes 410–414 and 428; ICD-10 codes I20–I25 and I50) and diabetes (ICD-9 code 250; ICD-10 codes E10–E14) without any discrimination between type 1 or type 2 diabetes. We collected those codes from January 1, 2000, through December 31, 2003, to assess prevalence of the diseases. We included only patients free of CHD and diabetes to assess the incidence of those conditions (this period length was chosen to ensure that we excluded 85% of prevalent diabetes cases, as validated previously 17 ). The same codes were collected during a 5-year follow-up from January 1, 2004, to December 31, 2008, to identify incidence of CHD and diabetes. The use of ICD codes in administrative data to identify CHD has been previously validated. 18,19
Sociodemographic variables
Due to the fact that socioeconomic information was not available at the patient level, we used patients' postal codes to determine population quintiles of social and material deprivation using Pampalon and Raymond's index. 20 We also used patients' postal codes to assess whether the patient was living within or outside a Census Metropolitan Area (CMA). An area is considered a CMA if it has a population of at least 100,000, of which 50,000 or more live in the urban core, 21 an approach validated in our population.
Statistical analysis
PCA was conducted on measures of weight, MAP, nonfasting glucose, HDL-C, and triglycerides to assess the dimensionality of the corresponding structure using Horn parallel analysis. 22 The stability of each of the axes under random sampling was then tested on 100 random samples using bootstrap methods based on the Daudin algorithm. 23 We also modified the algorithm to assess the stability of the axes under nonrandom sampling using 14 subsamples regrouping patients into different categories. The categories used are as follows: (1) Married; (2) unmarried; (3) living in a CMA; (4) not living in a CMA; (5) in the first (poorest) quintile of the material deprivation scale; (6) in the second and third quintiles of material deprivation; (7) in the fourth and fifth (richest) quintiles of material deprivation; (8) in the first and second (poorest) quintiles of the social deprivation scale; (9) in the third and fourth quintiles of social deprivation; (10) in the fifth (richest) quintile of social deprivation; (11) men; (12) women; (13) under 65 years old; (14) over 65 years old. Repartition of the population between each subsample is shown in Table 2.
MAT and SOC are the n th quintile of the material and social deprivation scale.
As defined by Statistics Canada.20
CHUS, Centre Hospitalier Universitaire de Sherbrooke; CMA, Census Metropolitan Area; MAP, mean arterial pressure; HDL-C, high-density lipoprotein cholesterol.
For each subsample, we extracted the loadings for all meaningful axes (based on percent variance explained) to calculate new alternative scores for the full population. We then compared their stability by assessing the pairwise correlations between these alternative scores and the scores from the complete dataset. The last stability assessment test computed correlations between the first axes given by the full PCA (Weight–MAP–Glucose–HDL–Triglycerides) to the ones emerging from a model including all possible subsets of the five criteria (such as Weight–MAP–HDL–Triglycerides).
To test the predictive value of metabolic syndrome, we used logistic regression to compute odd ratios for incidence of CHD and diabetes mellitus as a function of: (1) metabolic syndrome diagnosed by the standard NCEP ATP III definition; (2) the PCA axes as continuous variables; and (3) metabolic syndrome as diagnosed by a dichotomous PCA criterion (greater than vs. less than zero). The criterion was chosen so that we could compare two populations with approximately the same size. Analyses were adjusted for age, sex, and co-morbidities. All analyses were performed using R software, version 2.14.1 (R Foundation for Statistical Computing, Vienna, Austria)
Results
There were 7213 patients available for PCA in the baseline period, including 4173 patients with CHD and/or diabetes. In this population, 4074 patients had metabolic syndrome by the standard definition (Table 2). We conducted PCA on the data to assess the dimensionality of the five metabolic syndrome variables system (Table 3). The first axis explains 33% of the variance, better than any of the original criteria (which would each explain 20% of the variance if independent), the second performs about as well as any criterion, and the remaining three perform substantially worse. Horn parallel analysis 22 identifies the first axis as being essential (adjusted eigenvalue of 1.625), but is inconclusive regarding the second axis (adjusted eigenvalue of 0.998). The analysis further eliminates the other three axes (adjusted eigenvalues lower than 0.854), meaning that we could capture most of the information of the metabolic syndrome with only two components. Therefore, we can consider the dimensionality of the five risk criteria to be at most two axes. The variable loadings (Table 3) confirmed that the first axis was consistent with metabolic syndrome: It was associated in the proper direction with all five predictor variables (positively with all factors except HDL-C, whose threshold is an upper bound instead of a lower bound). The loadings for the remaining axes did not seem to correspond to known biological processes, suggesting that they are not related to metabolic syndrome. Use of only systolic (SBP) or diastolic blood pressure (DBP) instead of MAP did not substantively change the results (data not shown).
MAP, mean arterial pressure; HDL-C, high-density lipoprotein cholesterol.
The stability of the axis structure was first verified with 100 random bootstrap samplings using the Daudin algorithm. 23 The lack of variation in the first two axes suggested that they are stable (Fig. 1), whereas the third axis is highly unstable, indicating that the third, fourth, and fifth axes represent mainly noise and/or measurement error. The same result was found for the 14 subgroup analyses (Fig. 2).
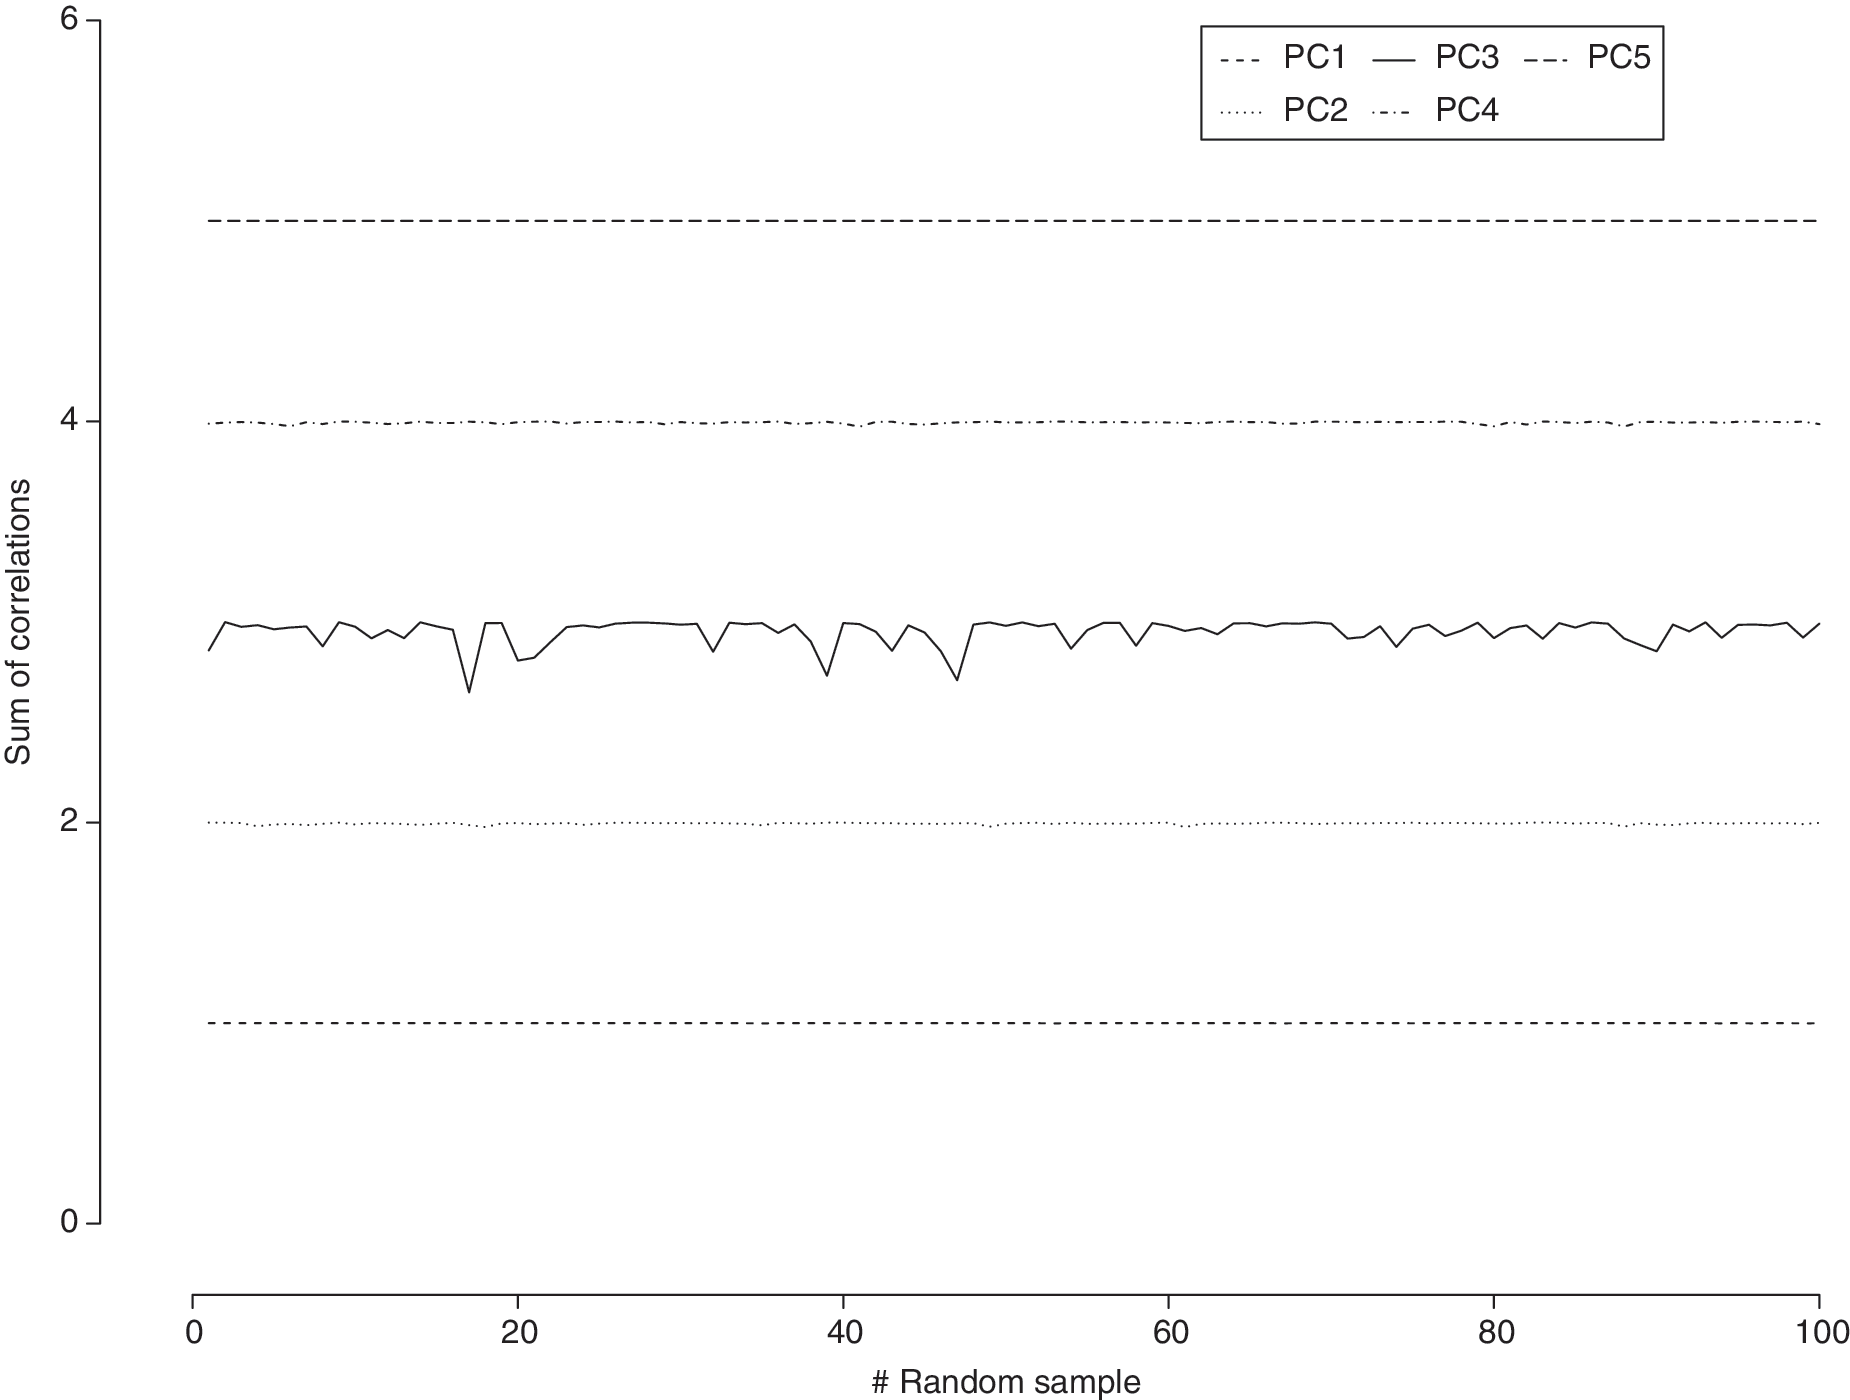
Sum of the correlations between the it h variable of the population principal component analysis (PCA) and the jt h variable of the random sample PCA—a look at the stablity of each of the PC under bootstraping procedures.
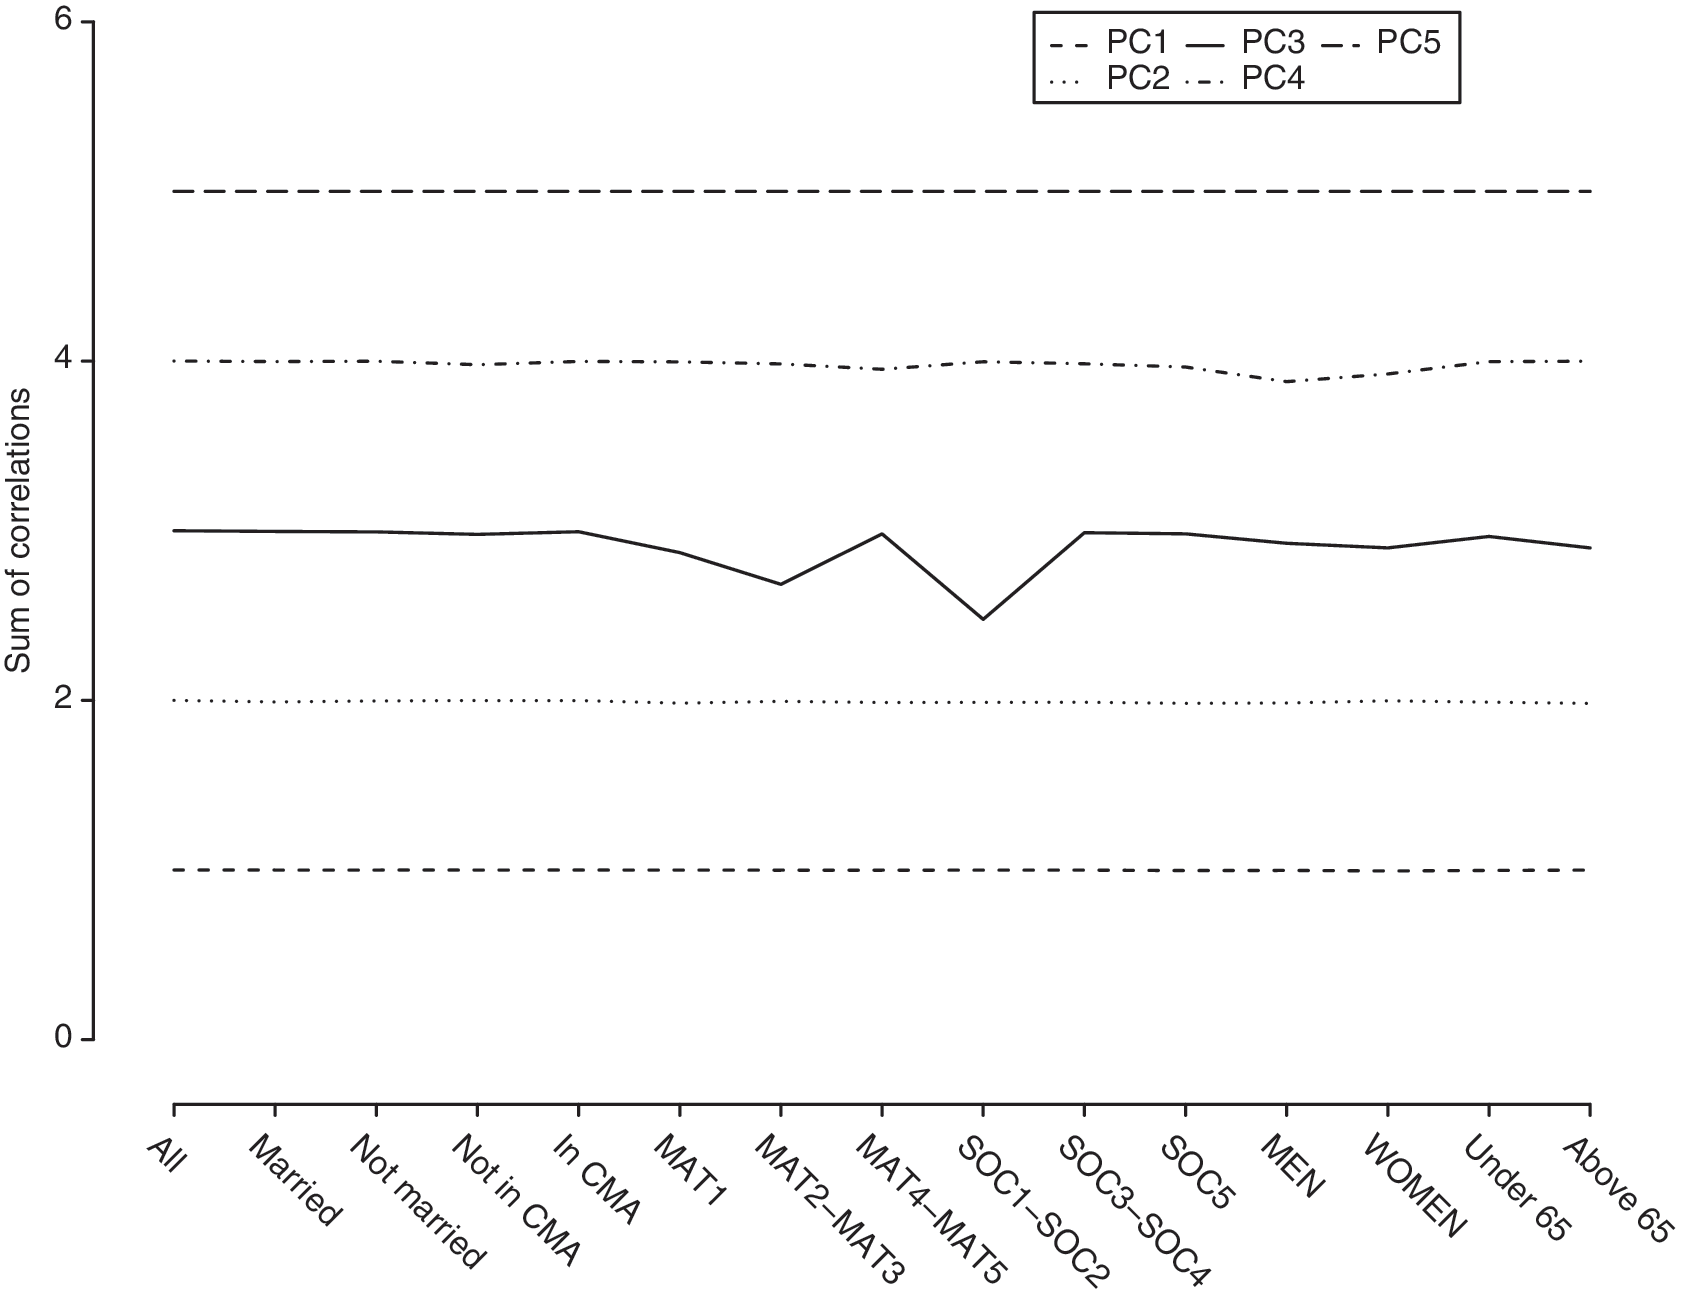
Sum of the correlations between the i th variable of the population principal component analysis (PCA) and the j th variable of the nonrandom sample PCA—a look at the stablity of each of the PC in each of the 14 subsamples.
The stability under different subsets of variables was also tested. The first axis' scores from the five-criteria PCA correlated well with those emerging from PCA using only three or four criteria (all correlations greater than 0.75), but correlations were weaker for the one- or two- criteria models (Fig. 3). Therefore, the first axis could be measured well even without all five predictors.

Correlations between the first principal component analysis (PCA) axis as generated by the variable subset PCA scores and the complete five-criterion PCA scores.
For each subsample, we extracted the loadings for all meaningful axes to calculate new alternative scores for the full population. The mean Pearson correlation coefficient obtained from this analysis was greater than 0.99 for the two first axes. In particular, the scores generated from the male and female subsamples, as well as the under 65 and over 65 years old subsamples, were particularly strongly correlated (all four over 0.997).
Finally, the ability to predict CHD and diabetes outcomes was compared between the standard definition, the dichotomized first PCA axis (with or without adjustment for the second PCA axis), and the fully continuous first PCA axis (Table 4). Comparison of odds ratios shows that the dichotomized first PCA axis always outperforms the standard definition, and that this effect is particularly strong for diabetes. Using the pseudo R-squared, we see that the continuous measure always provides a modest improvement over the dichotomous measure (Table 4). Inclusion of the second PCA axis had no noticeable effect on the models.
Data are odds ratio (OR) [95% confidence interval (CI)] and Nagelkerke Pseudo R2.
Not same scale as metabolic syndrome and dichotomized scores. Absolute OR should not be compared. Please refer to pseudo-R2 for direct comparisons.
P<0.0001.
P<0.005.
CHD, coronary heart disease; NCEP ATP III, National Cholesterol Education Program Adult Treatment Group III; PCA, principal component analysis.
Discussion
This study examined the correlation structure of metabolic syndrome using PCA on data from the electronic health records of 7213 patients at the CHUS hospital. This correlation structure identified a process (measured as a PCA axis) associated with all five criteria of the metabolic syndrome and consistent with previous descriptions of the syndrome. HDL-C, weight, triglycerides, and glucose contributed strongly to this axis, whereas blood pressure was associated more weakly. As seen in Fig. 1, blood pressure contributed more to a second independent axis of the PCA, suggesting that it may be related to metabolic syndrome only secondarily to other mechanisms. These findings, especially the small contribution of the blood pressure, are consistent with previous studies. 9,10 But our study also differs from others by identifying only two relevant axes compared to often three or more axes in other studies. 5 –10 This could be due to the fact that only five criteria were included in our analysis instead of the common 10 or more criteria (often somewhat redundant) in other papers. 5 –7 But even taking the number of axes into consideration, Lindblad et al. 8 and Meigs et al. 10 identified a first PCA axis similar to the one we found.
Subgroup analyses in men and women gave highly consistent results, meaning that the syndrome is not sex specific in our population. Similarly, no differences in the syndrome were identified in younger (<65 years old) or older subgroups, or in other population subgroups. Taken together, these analyses suggest that metabolic syndrome is a stable and highly reproducible phenomenon, at least in the Quebec context.
Last, we were able to demonstrate that subsets of metabolic syndrome criteria provide nearly as good a measure of metabolic syndrome as all five together. When various PCA models including four or less criteria were correlated with the full model, all models including at least three criteria produced an axis strongly correlated with that from the full model. This suggests that many clinicians could identify metabolic syndrome without recommending further exams based solely on information already contained in electronic records. Additionally, hospital-wide screening may help identify at-risk patients, allowing clinicians to intervene more rapidly to prevent CHD and diabetes.
Limitations
(1) Our data come from hospital records, largely inpatient, meaning that we are studying a substantially sicker population than the general population. (2) The sample was restricted to patients having all five criteria measured. Accordingly, patients had many visits to the hospital and took many tests, further suggesting that they represent a sick population. This agrees with our higher-than-usual metabolic syndrome prevalence of 56%, compared to a prevalence of ≈25% in most populations. 24 This could explain differences with other studies on healthier populations. 5,7,8 (3) The lack of information about patient treatments could have resulted in patients being misclassified with respect to specific criteria. (4) The overall population is 97% North American Caucasian, perhaps explaining some discrepancies with other studies. 5,7,9
Conclusion
In summary, we detected two processes determining the five variables related to metabolic syndrome in a sick Eastern Townships population. We clearly identified the most important process, the first PCA axis, as related to metabolic syndrome, whereas the second process is not related to it (strongly associated with arterial blood pressure). Furthermore, the first axis strongly predicts risk of diabetes or CHD incidence, whereas the second axis adds no additional predictive value.
Therefore, our results suggest the possibility for building an improved clinical measure of metabolic syndrome based on PCA that would provide a more precise indication of CHD or diabetes risk. We built such a tool by using the linear combination of the loadings identified as the first PCA axis, dichotomized at zero, to test the efficiency of the tool to predict the discussed diseases. We find that the tool predicts diabetes much better than the standard definition and is a slight improvement for CHD. Previous studies have also shown that metabolic syndrome is more strongly associated with diabetes incidence than with CHD events. 25,26
This improvement in predictive value likely comes from the fact that the PCA allows us to use continuous measures to summarize the information instead of five dichotomous measures like the metabolic syndrome. This can be seen in other studies as well. 27 A completely continuous tool would offer slightly more precision but may be difficult to implant in clinical practice.
Footnotes
Acknowledgments
The Centre de Recherche Clinique Etienne-LeBel and the Centre de Recherche sur le Vieillissement are two clinical research centers supported by the Fonds de Recherche en Santé du Québec (FRSQ). Marie-France Hivert is supported by an FRSQ Scholar Award (junior 1 level) and a Canadian Diabetes Association Clinical Scientist award. Alain Vanasse receives a career award form the FRSQ as a senior clinician scholar.
Author Disclosure Statement
The authors declare that no competing financial interests exist.