




Abstract
Background:
Childhood overweight (OW) is a matter of public health concern because of its long-term impact on adulthood health. NF-E2–related factor 2 (Nrf-2) regulates the antioxidant/lipogenic response to a sustained positive energy balance that prevails during weight gain. Here we aimed at studying a possible link between OW and Nrf-2–dependent antioxidant/lipogenic response in a local population of boys at risk of metabolic complications.
Methods:
We measured clinical and biochemical parameters related to lipid metabolism, oxidative stress, and metabolic syndrome in a population of OW boys [body mass index (BMI) percentile ≥85th and <95th, n=22] and normal weight boys (NW; BMI percentile<85th, n=27) from San Luis City, San Luis, Argentina.
Results:
Compared to NW, OW boys had lower insulin sensitivity, an altered plasma lipid profile, and increased markers of oxidative stress and inflammatory fatty acids. OW boys also had a higher atherogenic index and peripheral insulin resistance than NW boys. We also found that glutathione peroxidase activity and the reduced glutathione to oxidized glutathione ratio were lower in OW boys than NW boys, suggesting that OW boys may have an altered antioxidant response to oxidative stress. Finally, Nrf-2 expression negatively correlated with metabolic syndrome parameters in OW boys.
Conclusions:
Our data suggest that OW boys have a reduced antioxidant and lipogenic response to a positive energy balance, resulting in oxidative stress, insulin resistance, and risk of developing metabolic complications. Our data also provide a rationale for nutritional interventions aimed at restoring Nrf-2 expression to reduce the risk of metabolic complications in OW boys.
Introduction
Under normal conditions, Nrf-2 is bound in the cytosol to its repressor Kelch-like ECH associating protein 1 (Keap1). When an oxidative or electrophilic insult occurs, reactive cysteines of Keap1 are modified, and Keap1 is unable to target Nrf-2 to proteasomal degradation. 3 Consequently, Nrf-2 then translocates into the nucleus, where it heterodimerizes with a small muscle–aponeurotic fibrosarcoma protein to form a heterodimer. 4 This complex binds to antioxidant response elements located in the promoter region of a variety of cytoprotective genes, thereby promoting their transcription. 4
Recently, a role for Nrf-2 in regulating body weight gain and inflammation associated with adiposity has been reported. 4 Nrf-2 also has been shown to be a therapeutic target for reducing insulin resistance (IR) in mouse models of diet-induced obesity. 4 –6 Interestingly, Nrf-2 not only controls the expression of the antioxidant response gene, but also plays a role in regulating a number of genes involved in adipogenesis. 4 For instance, hepatocytes from Nrf-2–deficient mice had reduced expression of peroxisome proliferator-activated receptor-γ (PPAR-γ, fatty acid synthase, stearoyl-coenzyme A (CoA) desaturase, and regulatory-element binding protein. Consequently, these hepatocytes had reduced de novo lipogenesis. 7 This reduced lipogenesis can result in increased circulating saturated free fatty acids (FFAs), which may worsen peripheral oxidative stress, inflammation, and IR. 8 Increased FFAs in circulation and oxidative stress are important pathogenic mediators that contribute to adiposity and its associated metabolic abnormalities, including type 2 diabetes mellitus, cardiovascular diseases (CVD), and some forms of cancers. 9,10
Herein, we report for the first time a decreased expression of Nrf-2 mRNA and increased risk of oxidant/FFA-dependent metabolic complications in a population of local OW boys. These boys have an altered antioxidant and lipogenic response to a positive energy balance and thus are at risk of metabolic complications.
Materials and Methods
Study protocol
This study was carried out in accordance with the guidelines of the Declaration of Helsinki (1964 and its subsequent amendments) and note of clarification on Paragraph 29 added by the World Medical Association General Assembly, Washington DC, in 2002. The protocol followed in this study was approved by the Institutional and Ethic Review Board Committee of the Regional Hospital of San Luis and the National University of San Luis. Written informed consent was required from parents, as well as oral assent from all participants, before the study was started.
Participants' enrollment, clinical history, and anthropometric data were collected during the children's visits to the pediatrician's office for a regular checkup. Although boys and girls were enrolled, in the present report we have only included boys to analyze a more homogeneous population of patients. The study population included 49 boys aged between 7 and 11 years old. This population was ethnically homogeneous (i.e., stable South American Hispanic population). Any participant who had chronic diseases, long-term medication use, or a history of acute infectious diseases in the last 2 weeks was excluded from this study. Height (meters) and weight (kg) were measured twice with an error of±0.2 cm and±0.2 kg, respectively. These measurements were taken with the child slightly dressed and barefoot and according criteria established by the World Health Organization. Body weight was determined with a digital scale up to 150 kg with an accuracy of 0.1 kg, with the child standing up. The height was measured with a stadiometer formed by a smooth wall, without a baseboard using an inextensible measuring tape of 2 meters graduated in millimeters. Body mass index (BMI; weight in kilograms divided by the square of height in meters) was calculated.
Waist circumference (WC) was measured at the midpoint between the lower margin of the last palpable rib and the top of the iliac crest (hip bone) 11 and taken at the end of a normal exhalation at the nearest 0.5 cm. Blood pressure measurements were performed according to guidelines of the Argentinean Society Hypertension. Briefly, three separate blood pressure measurements were recorded by a pediatrician using a random-zero sphygmomanometer after the participant was seated at rest for 5 min. The last two measurements of systolic blood pressure (SBP) and diastolic blood pressure (DBP) were averaged. 12 Metabolic syndrome in children was defined when at least three of the following appeared together 13 : (1) Central obesity (WC >90th percentile), (2) fasting triglycerides >110 mg/dL, (3) high-density lipoprotein cholesterol (HDL-C) <40 mg/dL, (4) hypertension with SBP >30 mmHg and/or DBP >85 mmHg, and (5) fasting glucose >100 mg/dL.
Blood samples
Participants were instructed to fast for at least 12 h before blood sampling, and compliance was determined by interview with the pediatrician the morning of the physical examination. Blood samples were drawn from the antecubital vein between 8:00 am and 9:30 am. Blood samples were obtained with or without anticoagulants to obtain plasma and serum, respectively. After separation of plasma, the buffy coat fraction was used to extract RNA (see below).
Biochemical measurements
Total cholesterol and triglyceride concentrations were measured in serum using a commercial kit (Wiener Lab, Rosario, Argentina) in a Bayer Express Plus Chemistry Analyzer (Bayer Diagnostics, Siemens, Germany). HDL-C was measured after precipitation of apolipoprotein B (ApoB)-containing lipoproteins with tungstic acid/MgCl2 using a commercial kit (Wiener Lab). Low-density lipoprotein (LDL-C) was calculated using the Friedewald formula: LDL-C=total cholesterol (mg/dL) − HDL-C (mg/dL) − triglycerides (mg/dL)/5. 14 The atherogenic index was calculated using the following formula: Total cholesterol (mg/dL)/HDL-C (mg/dL). 15 Fasting serum glucose concentration was determined using a commercial kit based on the glucose/glucose oxidase method in a Bayer Express Plus Chemistry Analyzer. Free thyroxine (FT4) and thyroid-stimulating hormone (TSH) were determined using a commercial kit in an 180 PLUS ACS autoanalyzer (Ciba Corning, Bayer Health Care, Germany). The intra-assay coefficient of variation (CV) for FT4 was 1.54% for estimation of FT4 at 1.42 ng/dL. For TSH, the intra-assay CV was 3.01% at 18.53 μIU/mL. Insulin concentration in serum was measured by chemiluminescence using a commercial kit in an 180 PLUS ACS autoanalyzer. The inter-assay CV for insulin was 5.10% for the calibrator A1 whose concentration was 0 mU/L and 9.05% for the calibrator A2 whose concentration was 143,000 mU/L. As a parameter of systemic inflammation, C-reactive protein was determined in serum using a turbidimetric assay (Wiener Lab).
Measurement of peripheral IR
As a measurement of peripheral IR, we calculated the homeostasis model assessment of insulin resistance (HOMA-IR) using the following formula: HOMA-IR (mmol/L×μU/mL)=fasting serum glucose (mmol/L)×fasting serum insulin (μU/mL)/22.5. 16 HOMA-IR has been validated in children and adolescents and found that strongly correlates with peripheral IR. 17
Determination of parameters of oxidative stress in serum, plasma, and red blood cells
The antioxidant status was evaluated by measuring in serum the activity of paraoxonase, 18 catalase, 19 and total glutathione peroxidase (GPx). 20 In all cases, the total protein content was measured by using the Biuret reaction with bovine serum albumin as standard. Thiobarbituric acid–reactive substances (TBARS) were measured according to Jentzsch et al. 21 and used as a rough estimate of lipid peroxidation, a marker of oxidative stress. Plasma protein carbonyls were determined using a spectrophotometeric assay (ε375nm=22,000 M−1 cm−1) according a method previously reported. 22 The concentration of nitric oxide was determined as nitrite in serum using the Griess reaction. Hemolysate and plasma concentrations of GSH and GSSG were measured using a spectrophotometric assay as described by Akerboom and Sies. 23
Analysis of FFAs in plasma
Lipids were extracted from plasma with a chloroform:methanol mixture (2:1, vol/vol) in the presence of 0.01% butylated hydroxytoluene. Extracted lipids were dried under a stream of nitrogen gas, dissolved in 1.0 mL of benzene, and then trans-esterified with 3.0 mL of boron trifluoride at 80°C for 90 min. The resulting methyl esters of FFAs were extracted twice with 5.0 mL of petroleum ether. The extract was then evaporated to dry under flow of nitrogen gas and dissolved in n-hexane. Then, 1 μL of the sample was used for gas chromatography analysis. Gas chromatography analysis of methyl esters of FFAs was performed using an Innowax capillary column (0.32 mm×30 m) in a Clarus 500 Gas Chromatograph (PerkinElmer, Waltham, MA). Gas chromatography conditions were as follows: Injector and detector port temperatures were 130°C and 250°C, respectively. Column temperature varied from 50°C to 250°C with increases of 10°C/min and a final hold of 15 min. FFA-methyl esters were identified by comparing their retention times with authentic FFA-methyl esters (Sigma Chemical Co). The relative amount of each FFA (% of total FFA) was quantified by integrating the area under the peak and dividing the result by the total area for all fatty acids.
Quantification of Nrf-2 mRNA by using direct reverse transcriptase PCR
After separation of plasma, RNA was isolated from white blood cells contained in the buffy coat using the TRIzol reagent and following the manufacturer's instructions (Life Technologies, Carlsbad, CA). Ten micrograms of total RNA were reverse-transcribed with 200 units of Moloney murine leukemia virus (MMLV) reverse transcriptase (RT; Promega) using random hexamers as primers in 20 μL of reaction mixture following the instructions provided by the manufacturer. Samples were heated to 94°C for 2 min, followed by 38 temperature cycles. Each cycle consisted of three periods: First period at 94°C for 1 min, second period at 52°C for 1 min, and third period at 72°C for 1 min. After 38 reaction cycles, the extension reaction continued for 5 min more. PCR was carried out using the following primers: Human Nrf-2, forward 5′-AGATTCACAGGCCTTTCTCG-3′, reverse 5′-CAGCTCTCCCTACCGTTGAG-3′, 201 bp, 24 and human cyclophilin (standard control), forward 5′-TCCTAAAGCATACGGGTCCTGGCAT-3′, reverse 5′-CGCTCCATGGCCTCCACAATATTCA-3′,166 bp. 25 RT-PCR products were electrophoresed on 2% agarose gel with 0.01% ethidium bromide. The image was visualized and photographed under ultraviolet transillumination. The intensity of each band was quantified with the use of the NIH ImageJ software as a measurement of mRNA concentration of Nrf-2 and cyclophilin. Nrf-2 expression in normal weight (NW) and OW boys is shown as Nrf-2/cyclophilin band's mean-intensity ratios.
Statistical analysis
The results are shown as mean values±standard deviation (SD). Data obtained were analyzed using a Kolmogorov–Smirnov test to determine normality followed by either a Mann–Whitney test or t-test. Specifically, BMI, WC, TBARS, Nrf-2, fasting insulin and glucose, HOMA-IR, triglycerides, total cholesterol, HDL-C, LDL-C, atherogenic index, %C12:0, and %C14:0 data from NW and OW boys had a normal distribution; therefore, they were compared using an unpaired t-test. SBP and DBP pressure, %C16:0, %C18:1, %C18:2, paraoxonase, catalase, nitric oxide, and GPx data were from NW and OW boys and had nonnormal distribution; therefore, they were compared using a Mann–Whitney test. Correlations between Nrf-2 and parameters of metabolic syndrome were determined using the Spearman nonparametric test. Statistical analyses were performed by using the SPSS 17.0 program for Windows (SPSS Inc.). A P<0.05 was considered to be statistically significant.
Results
OW boys have an increased risk of metabolic complications
Table 1 shows the clinical and biochemical characteristics of the population of local children included in this study. We enrolled the first 49 boys aged between 7 and 11 years old during their regular health checkups and were not excluded (see Materials and Methods). This was the only criteria of selection used. The population of boys was divided into two groups according their BMI percentile in NW (BMI %tile<85th) and OW (BMI %tile≥85th and <95th) boys. Boys with a BMI below the 5th percentile were not enrolled in this study. Overall, 55.1% of the children had a BMI below the 85thpercentile, whereas 44.9% of the children had a BMI in the 85th–95th percentile range. In addition, WC was significantly larger in OW boys than NW boys. There were no differences in SBP and DBP between OW and NW boys. Although compared with NW boys, SBP in OW boys was within the limit of significance (P<0.07). Twenty-two percent of our population of OW boys (n=5) had at least the three indicators of metabolic syndrome (see Materials and Methods). Serum glucose and insulin concentrations were higher in OW boys compared to NW boys, and consequently HOMA-IR was higher in OW than NW boys (Table 1). Total cholesterol, LDL-C, and triglycerides in plasma were higher in OW compared to NW boys, whereas HDL-C concentration was lower in the OW than the NW group. The atherogenic index in OW boys was larger than NW boys (3.8±0.2 vs. 2.3±0.1, P<0.01). We found no differences in markers of hypothyroidism (i.e., FT4 and TSH) between OW and NW groups (data not shown).
Data shown are mean values±standard deviation (SD).
BMI %tile indicates BMI percentile.
Homeostasis model assessment of insulin resistance (HOMA-IR, mmol/L×μIU/mL)=fasting serum glucose (mmol/L)×fasting serum insulin (μIU/mL)/22.5.
Atherogenic index=total cholesterol (mg/dL)/ HDL-C (mg/dL).
The quantity of free fatty acids (FFAs) is shown as percentage of total fatty acids present in the sample based on the internal standard method.
NW, normal weight; OW, overweight; BMI, body mass index; HOMA-IR, homeostasis model assessment of insulin resistance; HDL-C, high-density lipoprotein cholesterol; LDL-C, low-density lipoprotein cholesterol.
OW affects plasma fatty acid profile
Saturated FFA concentration was higher in plasma from OW boys compared to NW boys (Table 1). OW boys had more lauric (P<0.01), myristic (P<0.001), and palmitic (P<0.04) acids than NW boys. However, the percentages of plasma unsaturated FFA (oleic, linoleic, and linolenic acid) between these two groups of boys did not change. Aside from the higher concentrations of saturated FFAs in OW boys with respect to NW boys, there were no differences in the concentration of reactive C protein (data not shown).
OW, markers of systemic oxidative stress, and Nrf-2–dependent antioxidant response
Table 2 shows some markers of oxidative stress in OW and NW boys. Serum concentrations of TBARS (P<0.002) were higher in OW boys compared to NW boys, whereas protein carbonyls in plasma were at the limit of significance (P=0.06). Paraoxonase (P=0.28) and catalase (P=0.07) activity did not change between OW and NW boys. However, we observed a lower activity of total GPx (P<0.04) in serum from OW boys with respect to NW boys. The reduced (GSH)/oxidized (GSSG) glutathione ratios in red blood cells (1.79 vs. 2.8, P<0.01) and in plasma (2.9 vs. 3.7, P<0.04) were lower in OW than NW boys. We also found that the concentration of Nrf-2 mRNA was lower (P<0.01) in OW compared to NW boys (Fig. 1). As expected, GPx and hemoxygenase-1 mRNAs were lower in OW than NW boys (data not shown).
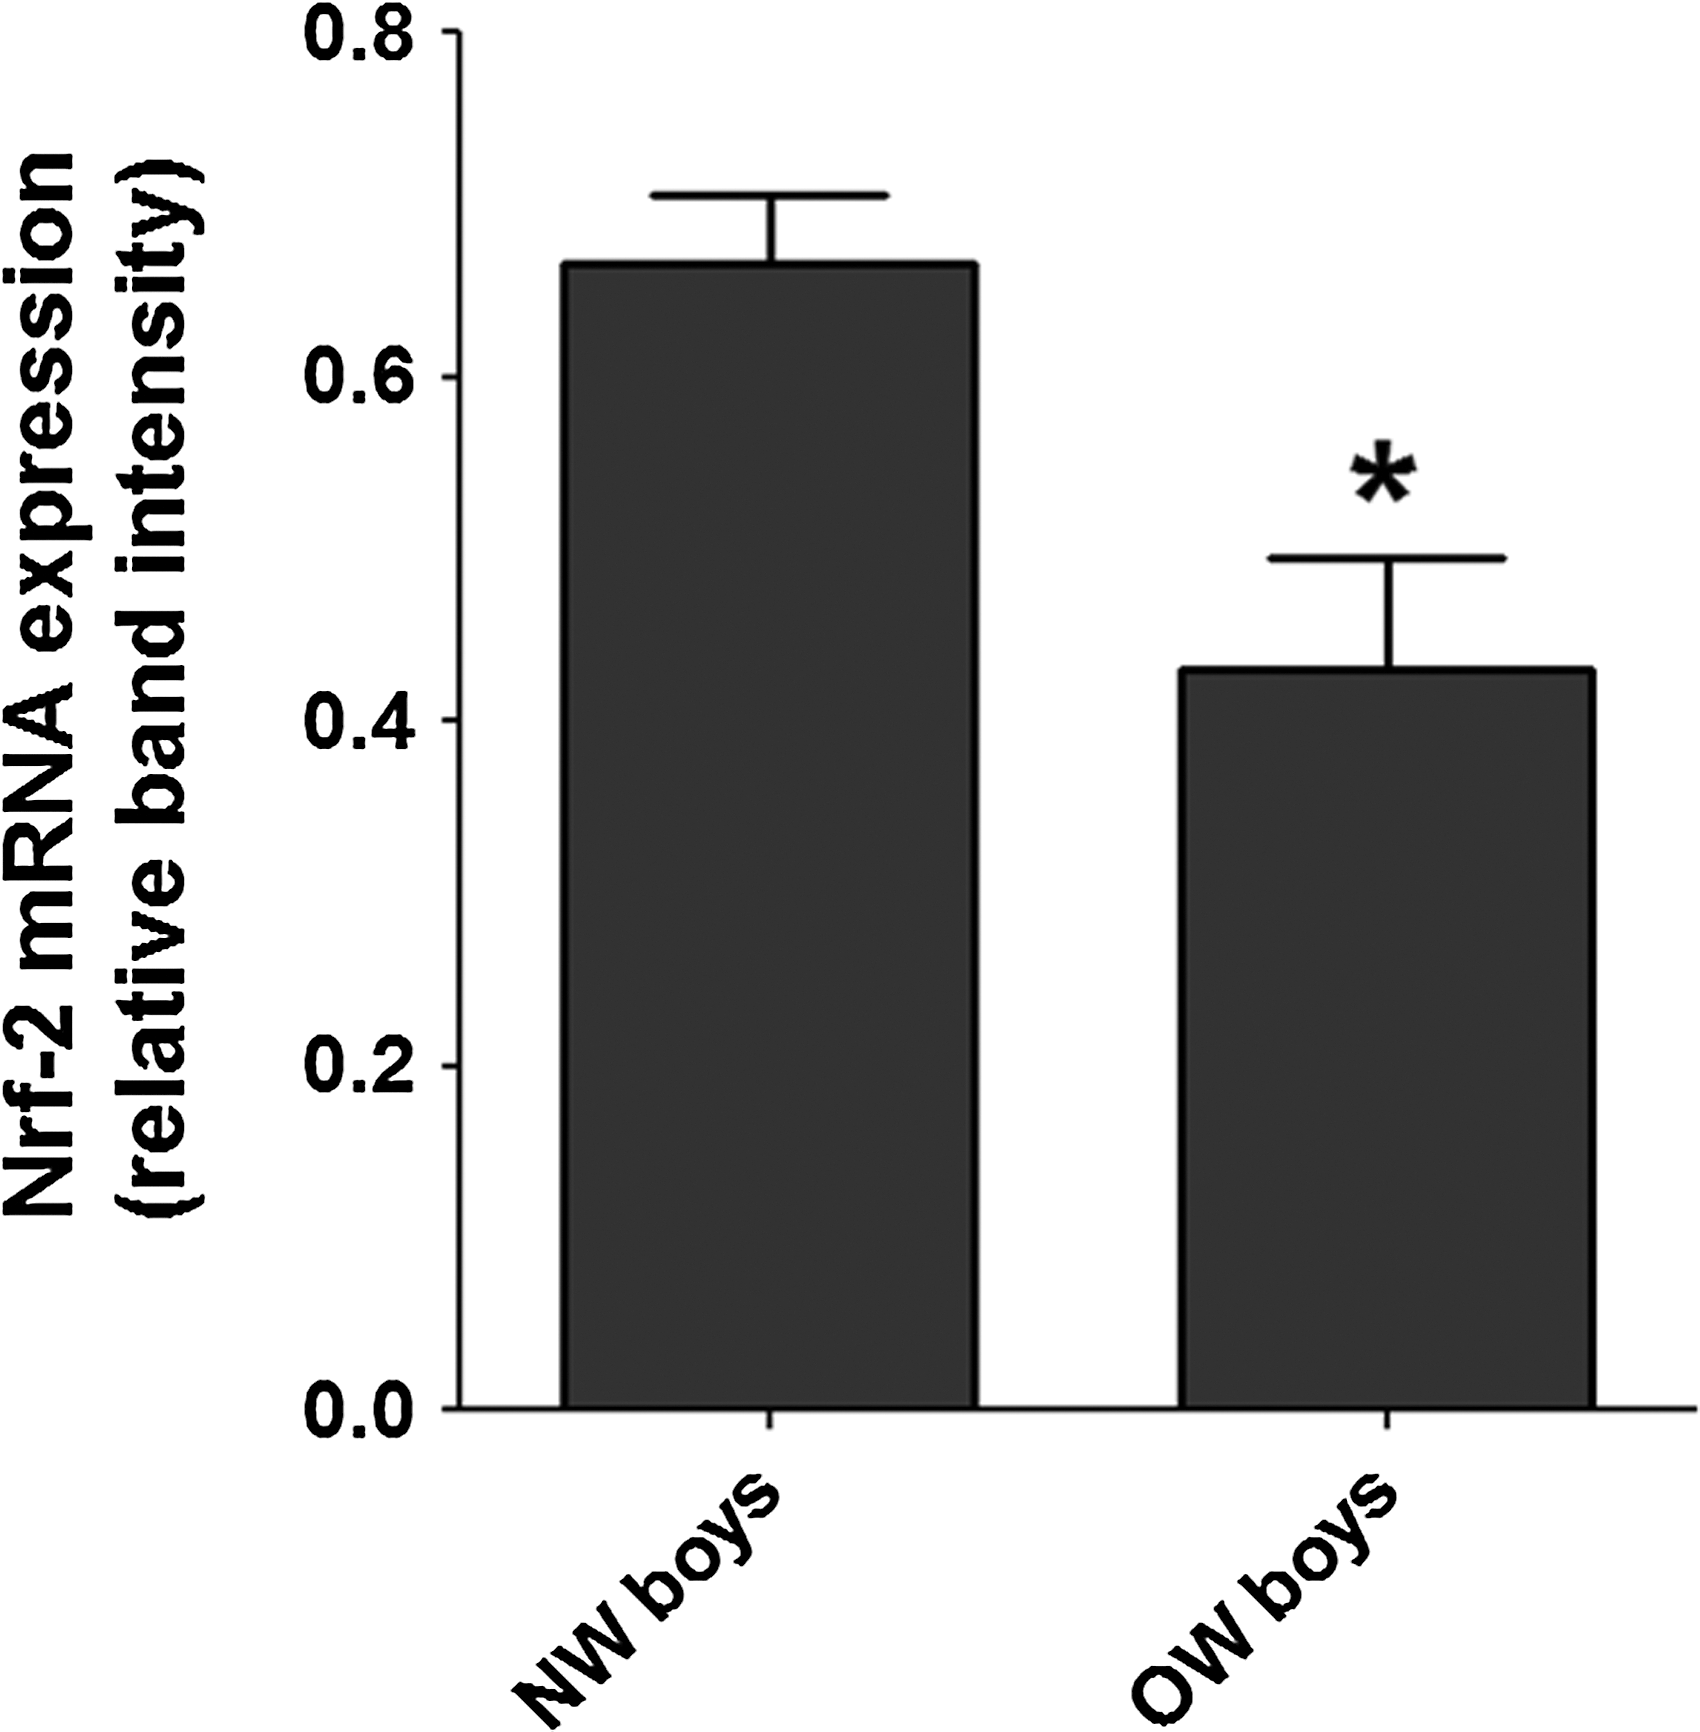
Impaired Nrf-2 expression in white blood cells obtained from overweight (OW) boys. The relative concentrations of Nrf-2 mRNA in OW boys (n=11) was lower than normal weight (NW) boys (n=10). Nrf-2 expression was normalized to cyclophilin expression. (*) P<0.01 between NW and OW boys.
Data shown are mean values±standard deviation (SD).
Ratios of the mean values. Mean values±SD of hemolysate (mM) and plasma (μM) GSH/GSSG are shown in parentheses.
NW, normal weight; OW, overweight; TBARS, thiobarbituric acid–reactive substances; GSH/GSSG, reduced glutathione/oxidized glutathione.
Correlation analysis of Nrf-2 expression and indicators of metabolic syndrome in OW boys
Table 3 shows the correlation analysis of Nrf-2 expression and some indicators of metabolic syndrome in OW boys. The expression of Nrf-2 in OW boys negatively correlated with the BMI (r=−0.71, P=0.01), SBP (r=< 0.59, P=0.04), triglycerides (r=−0.73, P=0.01), and HOMA-IR (r=−0.68, P=0.02) (Table 3). We did not find any correlation between saturated and unsaturated plasma FFAs and Nrf-2 expression in OW boys. WC (r=−0.99, P=0.01) and SBP (r=−0.94, P=0.01) were significantly and negatively correlated to Nrf-2 expression only in those OW boys that met the criteria of metabolic syndrome.
The distribution of the population of data was determined using the Kolmogorov–Smirnov test. Data had a normal distribution (homogeneous).
The correlation between Nrf-2 expression and indicators of metabolic syndrome was determined using the Spearman test (nonparametric). r is the correlation coefficient and r 2 is the coefficient of determination.
BMI, body mass index; HOMA-IR, homeostasis model assessment of insulin resistance; TBARS, thiobarbituric acid–reactive substances.
Discussion
We measured some biochemical parameters in a homogeneous South Amercian Hispanic population of boys aged between 7 and 11 years old from the City of San Luis, San Luis, a state located in the central region of Argentina. This population showed that compared to NW boys, OW boys have lower Nrf-2 mRNAs in the blood and an increased risk of metabolic syndrome. This change was accompanied by a reduced antioxidant and lipogenic response and thus increased plasma concentrations of saturated FFAs and oxidative stress markers.
In a recent study that enrolled 2919 school-aged children in the state of Santa Catarina in Brazil, 26 the ancestry of those children was similar to our population of children; they showed a different pattern of WC, a parameter of central adiposity, in relation to age-matched British children. Although our study included boys and girls at the beginning, in this study, we report data from the population of boys only; in the range of ages included (7–11 years old), girls' biochemical and anthropometric parameters and risk of metabolic disorders are highly influenced by age-intrinsic hormonal changes. 27
Our study showed a higher concentration of markers of oxidative stress in OW compared to NW boys (see Table 2). A chronic positive energy balance leads to saturation of the capacity of adipose tissue to store FFAs in the form of triglycerides in adipocytes. Consequently, excess saturated FFAs remain in the circulation longer. Our data show that OW boys had higher concentrations of circulating saturated FFAs (i.e., lauric, myristic, and palmitic acids) than NW boys. FFAs can activate tissue macrophages to produce a larger amount of reactive oxygen species (ROS) that can cause oxidative stress and promote IR in a number of tissues. 8,10 This observation may explain the increased oxidative stress and reduced insulin sensitivity in peripheral tissues, as indicated by the higher HOMA-IR in OW than in NW boys.
ROS and FFAs can affect glucose uptake by glucose-demanding tissues (i.e., muscle, liver, and adipose tissue). 28,29 Reduced uptake of glucose by peripheral tissues may explain the higher concentrations of serum glucose and insulin and thus higher HOMA-IR observed in OW boys compared to NW boys. Increased circulating insulin can lead to activation of nicotinamide adenine dinucleotide phosphate (NADPH) oxidase-2 in leukocytes 30 and production of superoxide radical anions, thereby increasing the risk of oxidative stress–mediated loss of insulin sensitivity.
OW boys had lower sensitivity to insulin accompanied by increased lipid peroxidation, a reduced GSH/GSSG ratio in plasma and hemolysate, reduced total GPx activity, and lower Nrf-2 mRNA in blood than NW boys. GPx is one of the main enzymes involved in the removal of lipid peroxides from circulation. Lipid peroxidation leads to the formation of a number of short-length electrophilic fatty acid derivatives (e.g., 4-hydroxynonanal) and lipid peroxides, which are known to trigger Nrf-2 pathway activation and synthesis of proteins involved in the removal of electrophilic compounds. 4,31 Protein carbonyls, markers of protein oxidation, were increased in OW boys with respect to NW boys; however, electrophilic compounds generated from lipid peroxidation can modify proteins, causing more protein carbonyls. 32 Indeed, protein carbonyls increase in situations of oxidative damage to tissue proteins and/or lipids. 33
Like many other antioxidant and lipogenic genes, GPx gene expression is triggered by the binding of Nrf-2 to the antioxidant response element in its gene's promoter. Additionally, BMI and WC have been positively correlated with oxidative stress and activation of circulating leukocytes, 34 which mediate endothelial dysfunction and thereby increase the likelihood of CVD. Our data showed that OW boys synthesize less Nrf-2 mRNA than NW boys. Moreover, Nfr-2 is positively correlated with adiposity in obese, nondiabetic, healthy patients. 35 It is important to highlight that many of the genes under the control of the antioxidant response element, to which Nrf-2 binds, also contain other response elements, which may or may not compensate the deficiency of Nrf-2 in OW boys. Interestingly, our data showed a negative correlation between Nrf-2 expression and BMI, SBP, triglycerides, and HOMA-IR, suggesting that the decrease in Nrf-2 expression results in or is a consequence of increased adiposity and insulin resistance. Only in those OW boys with metabolic syndrome (22.7% of the total OW boys) did Nrf-2 expression also correlate negatively with central adiposity. However, we did not observe any correlation between Nrf-2 and FFAs in OW boys with or without metabolic syndrome, suggesting an indirect effect of Nrf-2 on FFA metabolism. Taken together, our data suggest that reduced Nrf-2 expression may determine an increased risk of metabolic syndrome in OW boys. We anticipate that a larger population size will help clarify better the relationship between Nrf-2 expression and FFA metabolism in our population of OW boys.
Altogether, our data suggest that compared to NW boys, OW boys have a reduced Nrf-2–mediated antioxidant/adipogenic response, altered lipid metabolism, and increased risk of metabolic disorders associated with OW. Finally, this study highlights the importance of preventive nutritional strategies aimed at improving Nrf-2–dependent antioxidant and adipogenic responses in OW boys to help reduce the risk of undesirable metabolic effects of youth OW in adulthood health.
Footnotes
Acknowledgments
Authors thank Sandra E. Gomez-Mejiba for helping in the editing of this manuscript and Dr. Isabel Giménez for assistance with statistical analyses. D.C.R. is an affiliate Investigator of the National Institute of Environmental Health Sciences, National Institutes of Health, U.S. Department of Health and Human Services. This research was supported by the National University of San Luis to M.S.G. (grant #8104: Nutrition, Environment and Cell Metabolism) and PIP CONICET 4931 to M.S.G.
Author Disclosure Statement
Authors have read the journal's policy on disclosure of potential conflict of interest and have no such conflicts to report.