
Abstract
Background:
The aim of this study was to evaluate the distribution of fatty liver—nonalcoholic (NAFL) and alcoholic (AFL)—and its association with metabolic syndrome and its components in a population sample from a Mediterranean area.
Methods:
A sample of 2974 subjects (1679 males, 1295 females, age range 30–89 years) was randomly drawn from the population of a town in southern Italy. The survey visit included a validated semiquantitative food frequency questionnaire, anthropometric measurements, a blood sample taken in the morning after overnight fasting, as well as abdominal ultrasound examination to evaluate liver fat with a standardized scoring system. The 2001 National Cholesterol Education Program Adult Treatment Panel III (NCEP ATP III) definition of the metabolic syndrome was adopted.
Results:
In this Mediterranean population, where alcohol intake is mostly as wine with meals, NAFL is present in 36.8% of men and 25.7% of women and AFL in 13.8% of men and 5.5% of women. NAFL and AFL are associated with metabolic syndrome and its characteristics, body mass index (BMI), and visceral and subcutaneous fat (in AFL subjects, only in women) measured by ultrasound. Stratifying by BMI and controlling for confounders (age, height, smoking habit, and alcohol consumption), in overweight and obese subjects, liver and visceral fat are associated with the metabolic syndrome both in men and women and subcutaneous fat only in women. In normal weight subjects, only liver fat in men is associated with the metabolic syndrome.
Conclusions:
Fatty liver is highly prevalent in this Mediterranean population and is associated with metabolic syndrome in overweight and obese men and women as well as in men with normal BMI.
Introduction
The aim of this study is to evaluate the distribution of fatty liver (AFL and NAFL), detected by ultrasound, and its association with metabolic syndrome in a population sample from southern Italy. A grading system based on three sonographic features commonly used for the detection of fatty infiltration of the liver was proposed; this grading system was also for the purpose of increasing inter- and intraobserver agreement. 10 This is one of the few studies on fatty liver conducted on a random population sample in a Mediterranean area.
Patients and Methods
Study design
The design of this study was a cross-sectional survey.
Patients
The study subjects were randomly sampled from the electoral rolls of the population of Castellana, a town in southern Italy (Apulia region). The final population consisted of 2974 subjects (response rate 70%), 1679 males and 1295 females, with an age range of 30–89 years.
Measurements
The survey visit consisted of the administration of a standardized questionnaire, including a validated semiquantitative food frequency questionnaire, anthropometric measurements, a blood sample for biochemical tests, and an ultrasonographic examination. Blood sampling was performed in the morning after overnight fasting. The standardized questionnaire also enquired about diet and alcohol intake.
Ultrasound examination and fatty liver
All the subjects underwent a standardized ultrasound examination by two investigators (M.C. and M.R.N.) using a Hitachi H21 Vision (Hitachi Medical Corporation, Tokio, Japan). Examination of the visible liver parenchyma was performed with a 3.5-MHz transducer. A scoring system was adopted to obtain a semiquantitative evaluation of fat in the liver. The degree of liver fatty infiltration was graded according to the appearance of the liver echotexture, the hepatic echo penetration, and the clarity of the hepatic blood vessels, as well as the liver diaphragm differentiation in echo amplitude. Each criterion was assigned a score, indicating the level of fatty liver infiltration. For each criterion, a score of 2 indicated a definite positive (++) fatty liver infiltration, a score of 1 a probably positive (+) fatty liver infiltration, a score of 0 a negative (−) evaluation for fatty liver. The sum of scores for all three criteria was considered to be an indicator of the severity of fatty infiltration. Thus, the fatty liver score ranged from 0 to 6, where a total score of 1–2 indicated mild fat infiltration, a score of 3–4, moderate infiltration, and a total score of 5–6, severe fat infiltration; absence of fatty liver=score 0.
In all of the study subjects, the thickness of subcutaneous abdominal fat (subcutaneous fat) and anterior intra-abdominal fat (visceral fat) was also measured by ultrasound standard scans. To measure the subcutaneous fat, epigastric transverse scanning was done down the center of the xypho-umbilical line. The same point was used to measure the visceral fat between the posterior surface of the abdominal wall and the anterior wall of the abdominal aorta; thicknesses were measured in millimeters. The intra- and interobserver variability of the partial and total scores obtained for the assessment of liver fat by the two radiologists (M.C. and M.R.N) was evaluated in 32 different subjects and ranged from 0.77 to 0.85 (Marisa Chiloiro, MD. Thesis for the Board Certification in Radiology, University of Palermo, Italy, 2008).
Liver steatosis was divided into NAFL and AFL using a standardized semiquantitative food frequency questionnaire and the standard cutoff for alcoholic liver disease (>30 grams/day for men and >20 grams/day for women), even though alcohol in our population is consumed almost exclusively as wine with meals and it is easy to consume more than the AFL cutoff. The biological significance of this overconsumption is probably not as clear as in other populations of Central Europe and North America, where alcohol is consumed as strong spirits outside meals.
Metabolic syndrome
The metabolic syndrome was defined in accordance with the 2001 National Cholesterol Education Program Adult Treatment Panel III (NCEP ATP III) as the presence of three or more of the following criteria: (1) Waist circumference ≥102 cm in males and ≥88 cm in females; (2) fasting glycemia ≥100 mg/dL); (3) systolic blood pressure ≥130 mmHg and/or diastolic blood pressure ≥85 mmHg; (4) triglycerides ≥150 mg/dL; (5) high-density lipoprotein cholesterol (HDL-C) <40 mg/dL in males and <50 mg/dL in females.
Statistical analysis
The association of fatty liver with metabolic syndrome and other variables was evaluated stratifying for BMI, the main confounder, and often also an effect modifier of the association. Mean and standard deviation were used as index of centrality and dispersion of the distributions. The Pearson correlation coefficient and multiple logistic regression analysis were used to study relationships between variables. The Student t-test and chi-squared distributions were used to test statistical hypotheses, with the level of statistical significance of the null hypothesis rejection set at P<0.05. STATA 10 (StataCorp, Stata Statistical Software: Release 10, College Station, TX, USA) software was used.
The proposal of this study was approved by the Institutional Review Board (Ethical Committee) of IRCCS De Bellis, and written informed consent was obtained from each participant before entering the study.
Results
The study subjects characteristics are summarized in Table 1. In this population, fatty liver (NAFL and AFL) and diabetes were more frequent in men, whereas obesity was more frequent in women. Visceral adipose tissue was thicker in men, and subcutaneous adipose tissue was thicker in women. Table 2 shows the distribution of NAFL and AFL by gender, age, and BMI. NAFL and AFL were in all categories of age and BMI more frequent in men than in women, although NAFL was more frequent in young obese men, and there was increase in frequency with increasing BMI, both in men and women. Table 3 shows the distribution of subjects' anthropometric characteristics by fatty liver score in NAFL and AFL. The fatty liver score is linearly correlated with BMI, waist circumference, and thickness of visceral and abdominal fat, both in NAFL and AFL and in men and women, but with abdominal subcutaneous fat in men with AFL. The ratio of visceral to abdominal fat thickness is not related to fatty liver, although it is in men with AFL and only weakly. Tables 4A and 4B summarize the mean and standard deviation of the metabolic syndrome score and some common metabolic variables stratifying by fatty liver score, in subjects with NAFL and AFL. In NAFL, as well as in AFL, all of the variables increase (HDL-C decreases) their mean with increasing fatty liver score, but serum cholesterol in subjects with NAFL and HDL-C in women with AFL. Cholesterol in blood is associated with fatty liver score clearly only in women with ALF. The association of anthropometric variables with fatty liver score is present both in obese and nonobese subjects in NAFL and AFL. Only the ratio of visceral fat to abdominal fat measured by ultrasounds is not associated with fatty liver score (Table 5). Figure 1 shows the prevalence of metabolic syndrome (yes/no) in fatty liver categories in all of the subjects and in subjects with NAFL and AFL, stratifying by gender. In males and females, in NAFL and AFL, metabolic syndrome prevalence increases clearly with fatty liver score. Table 6 shows the results of logistic regression of metabolic syndrome (no=0, yes=1) on fatty liver score, visceral and subcutaneous fat (all measured as standardized deviate), either as single variables (Table 6A), or including the other fat localizations (Table 6B) in the model, controlling for age, height, smoking habit, and alcohol consumption, and stratifying by categories of BMI. At normal BMI levels, the metabolic syndrome is associated only with fatty liver (independently from alcohol consumption), and only in men. Instead, in overweight and obese subjects, metabolic syndrome is associated with liver and visceral fat both in men and women, but with subcutaneous fat only in women (Table 6A). Furthermore, controlling for the other fat localizations, the same relationships are evident, albeit more attenuated (Table 6B).
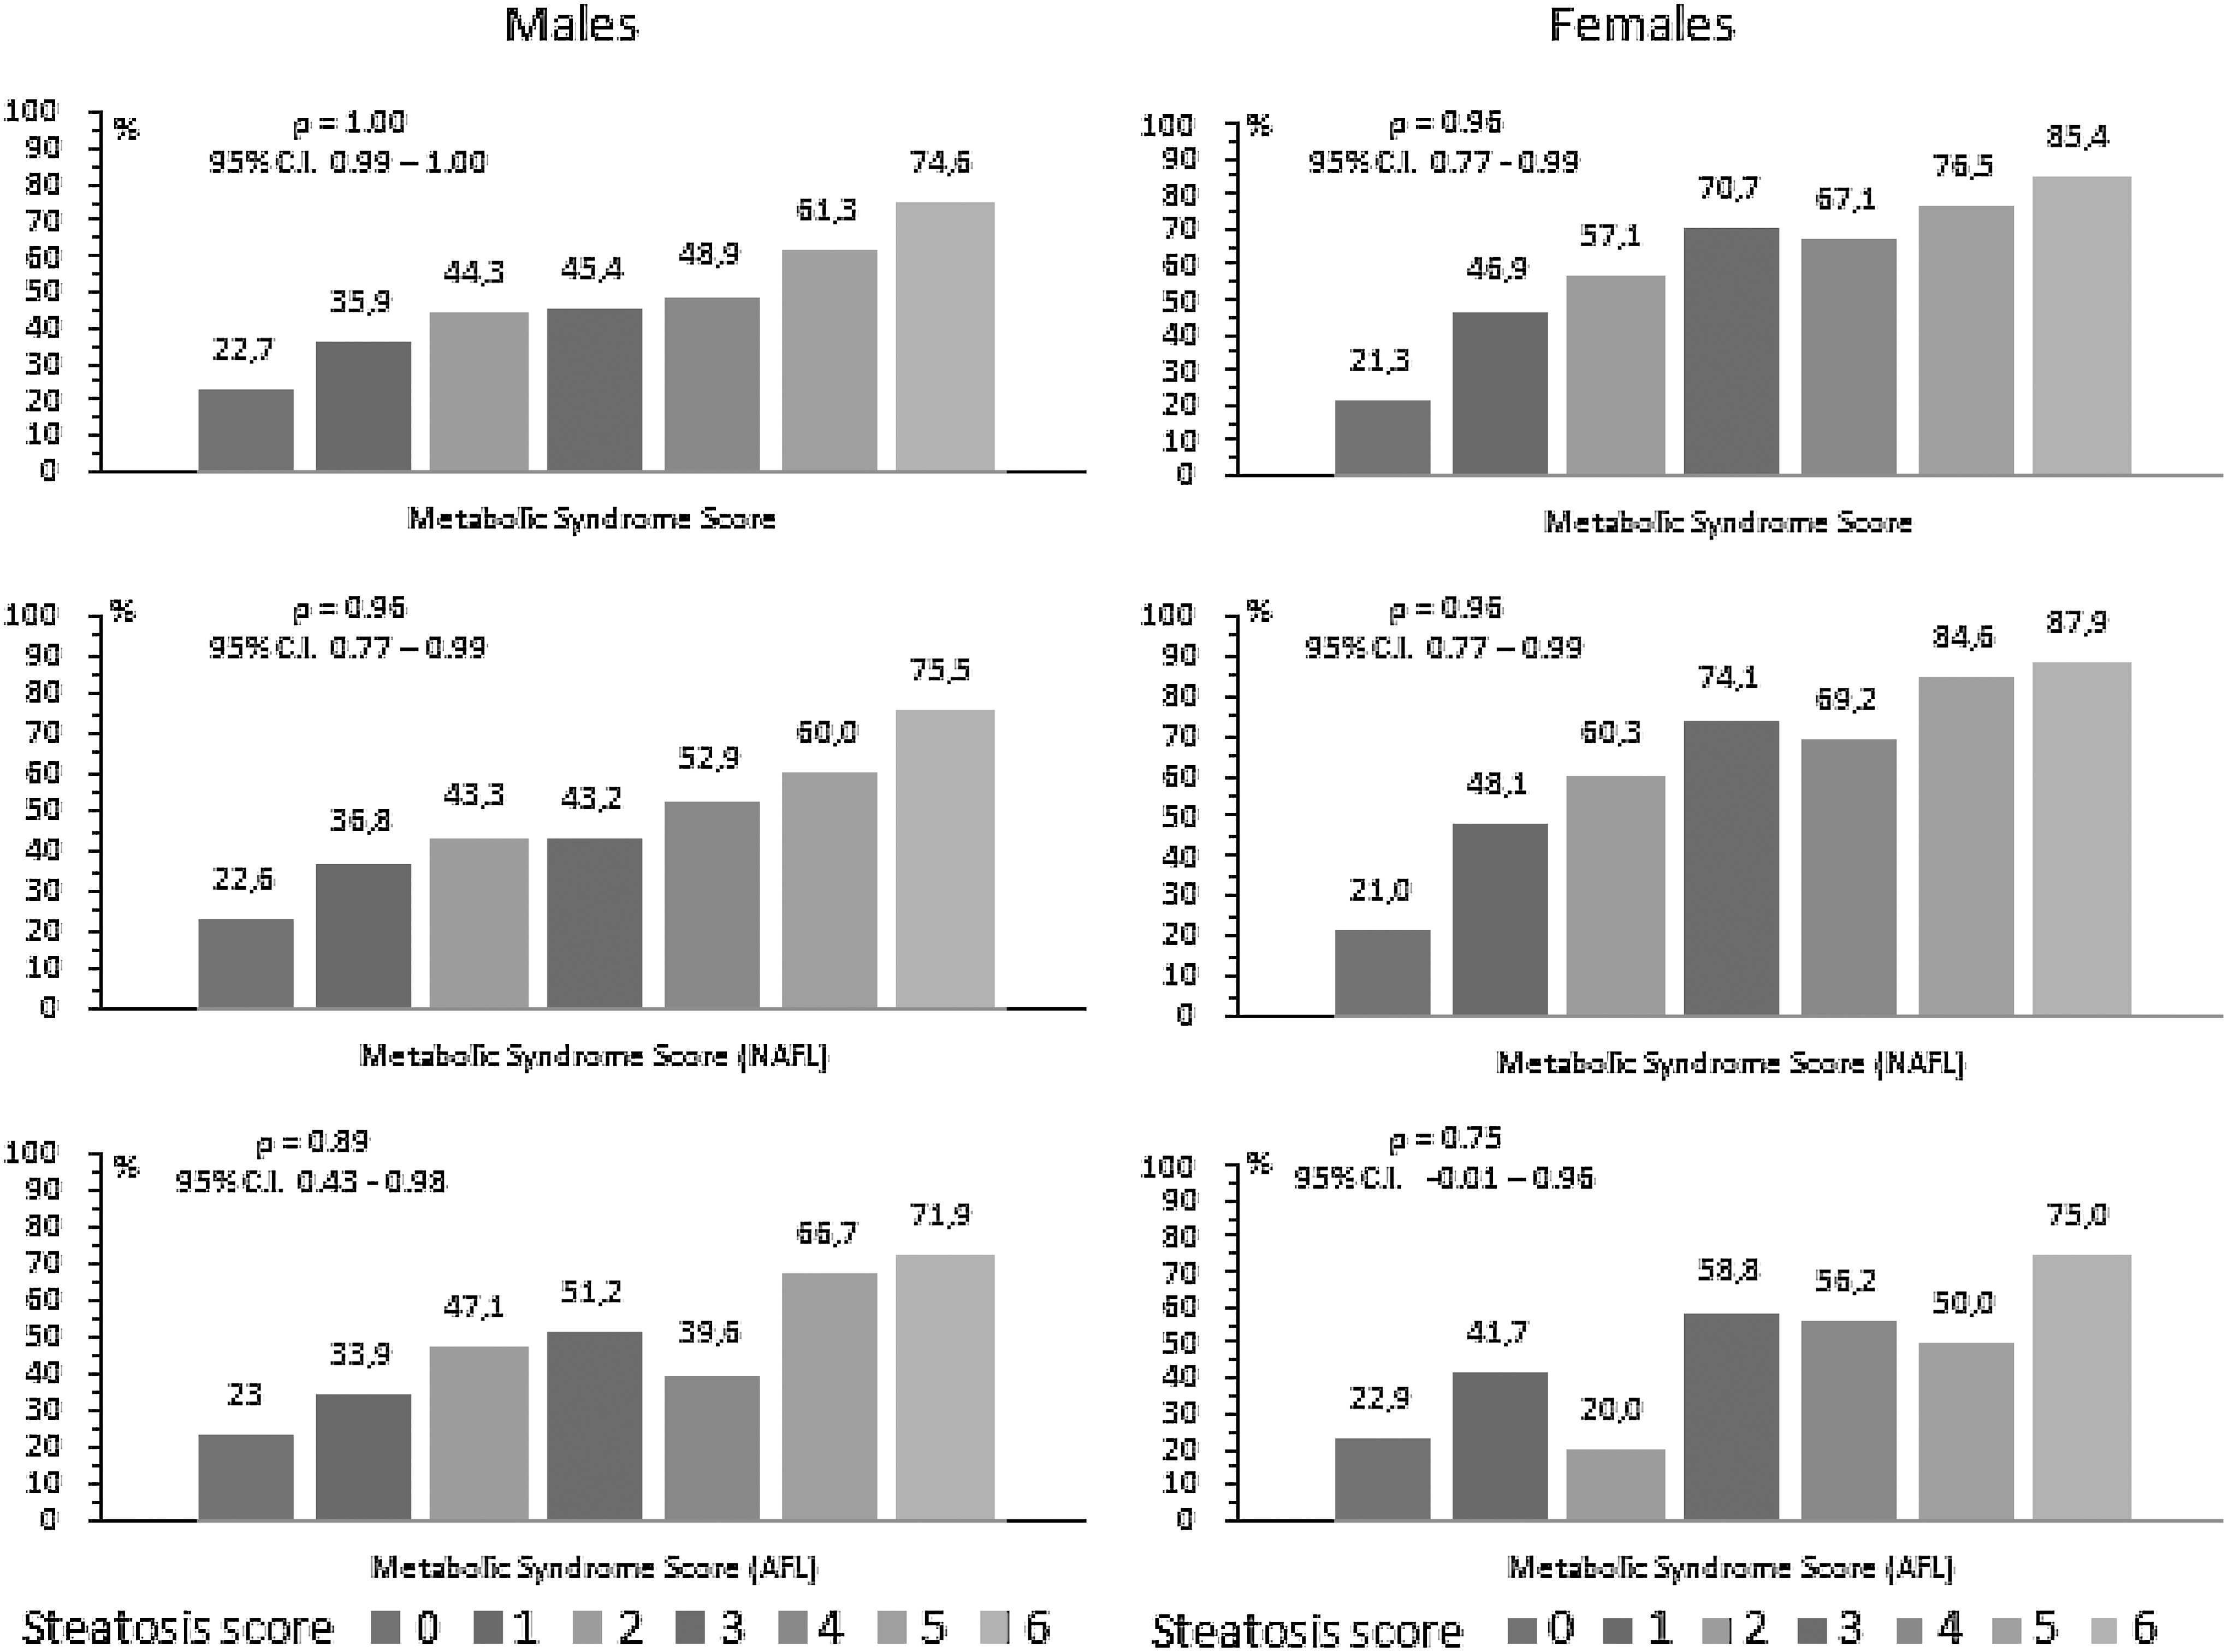
Distribution of metabolic syndrome prevalence in liver steatosis score by gender.
Values as mean±standard deviation (SD), or n (%).
t-test.
Chi-squared test.
Alcohol consumption <30 grams/day (men), <20 grams/day (women).
Alcohol consumption ≥30 grams/day (men), ≥20 grams/day (women).
BMI, body mass index; HDL-C, high-density lipoprotein cholesterol; GPT, glutamate pyruvate transaminase.
Alcohol consumption: males (<30 grams/day), females (<20 grams/day).
Alcohol consumption: males (≥30 grams/day), females (≥20 grams/day).
BMI, body mass index.
Alcohol consumption: males (<30 grams/day); females (<20 grams/day).
Pearson product-moment correlation coefficient.
z-test for trend.
BMI, body mass index; M, male; F, female.
Alcohol consumption: males (≥30 grams/day), females (≥20 grams/day).
Pearson product-moment correlation coefficient.
z-test for trend.
CI, confidence interval; M, male; F, female.
Alcohol consumption: males (<30 grams/day), females (<20 grams/day).
Pearson product-moment correlation. coefficient.
z-test for trend.
M, male; F, female; HDL-C, high-density lipoprotein cholesterol; GPT, glutamate pyruvate transaminase.
Alcohol consumption : males (≥30 grams/day), females (≥20 grams/day).
Pearson product-moment correlation coefficient.
z-test for trend.
M, male; F, female; HDL-C, high-density lipoprotein cholesterol; GPT, glutamate pyruvate transaminase.
Alcohol consumption: males (<30 grams/day), females (<20 grams/day).
Alcohol consumption: males (≥30 grams/day), females (≥20 grams/day).
Pearson product-moment correlation coefficient.
BMI, body mass index; NAFL, nonalcoholic fatty liver; AFL, alcoholic fatty liver.
BMI, body mass index; OR, odds ratio; CI, confidence interval.
Discussion
Summary of findings
The results of this study show that fatty liver and NAFL, measured by ultrasound, are present, respectively, in 50.6% and 36.8% of men and 31.6% and 25.7% of women, in this population sample from southern Italy, a Mediterranean area. Fatty liver, either NAFL or AFL, is associated with BMI, waist circumference, visceral and subcutaneous fat (the latter only in women), and with the metabolic syndrome and its characteristics. Stratifying by BMI and controlling for confounders (age, height, smoking habit, and alcohol consumption), in overweight and obese subjects liver and visceral fat are associated with the metabolic syndrome both in men and women, subcutaneous fat only in women. In normal weight subjects, only liver fat in men is associated with the metabolic syndrome. These associations are evident either in NAFL or in AFL.
Comparison with previous studies
Recent population ultrasonographic surveys reported 20%–25% prevalence rates for NAFL in northern Italy, 11 15% in Shanghai, China, 12 and 21.8% of fatty liver in Japan. 13 In our study, in a random sample of the general population in a Mediterranean country, the prevalence of fatty liver and NAFL is 41.3% and 31.2 %, respectively, comparable with the 30% prevalence of NAFL found in Israel, another Mediterranean country. 14 Fatty liver was most prevalent at higher BMI both in males and females in all age classes. The lower prevalence of fatty liver we found at more advanced ages and in all the BMI categories, both in males and females, is probably due to a cohort effect, because older people are less exposed to the risk factors for fatty liver than younger people. In fact, it is known that the younger generations in most Mediterranean countries have almost completely abandoned their traditional healthy diet. 15
Many studies have been focused on exploring the association between fatty liver and the metabolic syndrome and separating this effect from that of visceral fat. In 161 Caucasian men, visceral fat and liver fat measured by computed tomography were independent predictors of high values of plasma triglycerides, HDL-C, and fasting glucose in men. 16 Liver fat content, measured by magnetic resonance spectroscopy, was four-fold higher in 116 subjects with the metabolic syndrome than in 155 subjects without, and remained higher, even when controlling for age, gender, and BMI. 17 In 45 nondiabetic men, fat accumulation in the liver rather than in the skeletal muscle was associated with features of the metabolic syndrome. 18 In 31 obese subjects (BMI mean and standard deviation 35.7±0.8 kg/m2): (1) matched for intrahepatic triglycerides and with different visceral adipose tissue values (high or normal); or (2) matched for visceral adipose tissue and with different intrahepatic triglycerides values (high or normal), a different insulin sensitivity, measured with a euglycemic–hyperinsulinemic clamp, and very-low-density lipoprotein–triglyceride (VLDL-TG) secretion, measured with isotope techniques, was found only in the group of subjects matched for visceral adipose tissue. 19 These results were supported by findings in other studies by the same group: (1) an increased obesity without a parallel increase in intrahepatic triglycerides was not associated with additional abnormalities in adipose tissue, skeletal muscle, hepatic insulin sensitivity, and VLDL metabolism; 20 (2) reducing visceral adipose tissue through omentectomy did not improve metabolic function in obese patients. 21 In 330 individuals at risk of type 2 diabetes, glucose tolerance status was determined by a 2-h 75-gram oral glucose tolerance test (OGTT); total body and visceral fat were measured by magnetic resonance, and liver fat by hydrogen magnetic resonance (H-MR) spectroscopy. Liver fat was strongly increased, more than visceral fat, with the progressive shift in values from normal glucose tolerance to isolated impaired fasting glucose, to isolated impaired glucose tolerance and, finally, impaired fasting glucose plus impaired glucose tolerance. 22
In 2589 individuals enrolled in the Framingham Heart Study, examined by computed tomography of the abdomen, after adjustment for other fat depots, fatty liver remained associated with diabetes, impaired fasting glucose, hypertension, metabolic syndrome, HDL-C, and triglycerides, independently of visceral adipose tissue and other obesity measures. 23 The same results were obtained in a study of 356 subjects in which liver fat was measured by H-MR spectroscopy and intrabdominal fat by magnetic resonance imaging. 24 In the AGES-Reykjavik Study of 1616 women and 879 men examined by computed tomography, visceral adipose tissue and liver fat were associated with the metabolic syndrome independently of each other, but visceral adipose tissue was the more important depot at lower levels of adiposity and liver fat at higher levels. 25 The opposite was found in a Taiwanese epidemiological study of 3058 adults examined by ultrasound, in which participants with fatty liver alone had a significantly higher odds ratio for hyperglycemia, hypertriglyceridemia, low HDL-C, and a clustering of metabolic syndrome components as compared with participants with only abdominal obesity. Thus, in this study, as well as in our study using ultrasound as a diagnostic tool, fatty liver findings provide important information on the metabolic syndrome in nonabdominally obese patients. 26 These results were confirmed in another ultrasonographic survey of 5878 nonobese, nondiabetic Korean subjects, in which the NAFL prevalence was associated with the number of metabolic syndrome components, as well as with insulin resistance, regardless of the metabolic syndrome. 27 Finally, in 2882 subjects of the Jackson Heart Study examined by computed tomography, both fatty liver and abdominal visceral adipose tissue were independent correlates of the components of the metabolic syndrome, although the associations were stronger for visceral adipose tissue than for fatty liver. 28
In 314 subjects with a family history of type 2 diabetes mellitus, there were metabolically healthy obese, and the association of obesity with metabolic abnormalities was mediated by fatty liver more than visceral fat. 29 Furthermore, the same group found in 337 subjects (327 without diabetes and 10 with newly diagnosed type 2 diabetes) that high liver fat content is not always associated with metabolic abnormalities in humans, 30 stressing the protective role of triglycerides as liver fat depot.
Limitations
These results were obtained in a random sample of the general population and all the clinical and laboratory measurements were standardized, as well as the ultrasound measurements of liver fat. The cross-sectional design of the study makes it difficult to understand the direction of the relationship. However, as it is clear in the logistic model, we favored an influence of liver fat on the generation of the metabolic syndrome and not vice versa.
In clinical practice, ultrasound is typically the first-line imaging modality used to assess the significance of abnormal liver function tests, but it is somewhat subjective and operator dependent. Additionally, ultrasound is insensitive to modest levels of hepatic triglyceride, although these may be clinically important. Indeed, in the majority of individuals with a fatty infiltration identified by ultrasound, H-MR spectroscopy shows more than 33% of histologically affected hepatocytes and more than 10% of liver fat content. 31 For this reason, the sensitivity of ultrasound in detecting hepatic steatosis has ranged widely (60%–94%) depending on the population chosen for study.
Conclusions
These results from a cross-sectional study show that liver fat scored by ultrasound is associated with the metabolic syndrome and its characteristics, independently of abdominal subcutaneous and visceral fat. It could be interesting to explore the association of higher levels of fatty liver and an increased risk for developing diabetes and cardiovascular disease, independently of other fat depots, in prospective studies.
Footnotes
Acknowledgment
This study was supposted by a grant from the Italian Ministry of Health.
Author Disclosure Statement
The authors have no financial conflicts of interest to disclose.