
Abstract
Background:
Metabolic syndrome is prevalent in adults characterized by increased visceral adiposity and insulin resistance (IR). However, the link between pancreatic β-cell function and metabolic syndrome severity in adults across the glucose spectrum is unknown. We hypothesized that poor β-cell function would independently predict a higher metabolic syndrome Z-score (i.e., severity).
Methods:
Seventy (12 normal glucose tolerant, 37 prediabetic, 21 type 2 diabetic) obese adults [62.4±1.1 year; 34.6±0.6 kg/m2; data are mean±standard error of the mean (SEM)] participated in this cross-sectional study. A 2-hr 75-gram oral glucose tolerance test (OGTT) was administered, and insulin and glucose area under the curve was determined for calculations of insulin action. Fasting and glucose-stimulated insulin secretion was calculated using homeostasis model assessment of insulin secretion (HOMA-B) and the insulinogenic index (i.e., I0–30/Glc0–30 or I60–120/Glc60–120), respectively. Fasting and postprandial insulin sensitivity was assessed by HOMA-IR and the Matsuda Index, respectively. β-cell function was estimated using the disposition index via HOMA-B/HOMA-IR, I0–30/Glc0–30 or I60–120/Glc60–120×Matsuda Index, which represents basal, first-, and second-phase insulin release, respectively. Body composition (via computerized tomography and dual X-ray absorptiometry) and sex-specific metabolic syndrome Z-scores were calculated from waist circumference, blood pressure, fasting glucose, triglycerides, and high-density lipoproteins.
Results:
Compared to those with normal glucose tolerance, visceral fat and IR were higher and β-cell function was lower in adults with glucose intolerance and type 2 diabetes mellitus. Elevated visceral fat and IR (HOMA-IR and Matsuda Index) correlated with elevated Z-scores (r=0.51, r=0.54, r=−0.49; all P<0.002, respectively). Basal, first-, and second-phase β-cell function correlated with low Z-scores (r=−0.59, r=−0.51, and r=−0.43, all P<0.001). Insulin secretion significantly predicted the Z-score independent of sex, body fat, blood lipids, blood pressure, IR, and glucose metabolism (P<0.005).
Conclusion:
β-cell dysfunction is highly correlated with the severity of metabolic syndrome in adults. Future work is warranted to elucidate the mechanism by which cardiometabolic disturbances influence insulin secretion.
Introduction
A
Methods
Patients
Seventy (25 men and 45 women) adults (see Table 1) were included in this cross-sectional study, and some of the data were previously reported. 8,9 Subjects were recruited from the local community using newspaper and community flyers. Subjects were included if nonsmokers, sedentary (<60 min/week for the past 3 months), weight stable (<2 kg in previous 6 months), and free of known chronic disease (i.e., renal, hepatic, cardiopulmonary, and hematological), with the exception of 21 adults with T2DM. Subjects with T2DM were newly diagnosed and not on any antihyperglycemic medications (e.g., insulin, metformin, etc.). Subjects were excluded if taking dietary supplements known to influence glucose/lipid metabolism as well as body weight and blood pressure. Women were excluded from participation in the study if on hormone replacement therapy or oral contraceptive use. Five women were premenopausal and tested in the midfollicular phase. Glucose tolerance was based on a 75-gram oral glucose tolerance test (OGTT). Metabolic syndrome was defined as having at least three of the five ATP III criteria 10 because the metabolic syndrome Z-score was previously calculated using ATP II criteria. 11 –13 Although the definition of metabolic syndrome is controversial, and other definitions should be considered within the context of these findings, our view is that disease severity is more important than the disease itself. Subjects provided written and verbal consent, and our Institutional Review Board approved the study.
Data are mean±standard error of mean.
Chi-squared analysis used to compare prevalence of females, metabolic syndrome, and race between groups (P<0.01).
Compared to control: #P<0.07, ‡P<0.05, * P<0.01.
Compared to prediabetes: ¥P<0.07, †P<0.05, ^P<0.01.
NGT, normal glucose tolerance; T2DM, type 2 diabetes mellitus; ANOVA, analysis of variance; M, male; F, female; AA, African Americans; HOMA-IR, homeostasis model assessment of insulin resistance; HOMA-B, homeostasis model assessment of insulin secretion; DI, disposition index; IS, Matsuda Insulin Sensitivity Index; HDL, high-density lipoprotein; TG, triglyceride; ATP III, Adult Treatment Panel III.
Control period
Metabolic assessments of insulin action and cardiometabolic risk factors were conducted during a 3-day inpatient stay at the Clinical Research Unit. Resting metabolic rate was determined after subjects rested in the supine position for 30 min. Respiratory gases were analyzed by indirect calorimetry (Vmax Encore, Viasys, Yorba Linda, CA). Thereafter, subjects were provided weight-maintenance meals (resting metabolic rate×1.2 activity factor; 55% carbohydrate, 30% fat, 15% protein) and refrained from strenuous activity. 14
Anthropometrics and fitness
Body weight was measured with subjects in a hospital gown on a digital scale, and height was measured without shoes using a wall-mounted stadiometer. Total fat and fat free mass were measured using the intelligence dual X-ray absorptiometry system (iDXA; Lunar Prodigy, Madison, WI), and visceral adipose tissue mass was determined using computerized tomography (CT) as previously described. 15 In brief, subjects were placed in a supine position, and measurements were made at 120 kV with a slice thickness of 8 mm. Images were obtained manually without contrast at the fourth lumbar vertebra (L4). Scans were standardized using distances from bony landmarks, and digitized images were analyzed in a blinded fashion. Maximal oxygen consumption (VO2max) was determined (Jaeger Oxygcon Pro; Viasys, Yorba Linda, CA) during a treadmill test. VO2max was reached if at least three of the following criteria were met—plateau in oxygen consumption with increasing workloads, heart rate <10 beats/min of age-predicted maximum, respiratory exchange ratio >1.1, or volitional fatigue.
Metabolic assessment
Waist circumference (WC), and blood samples for fasting glucose (FG), TGs, total cholesterol, and high-density lipoprotein (HDL) were obtained as previously described. 8,9,15 Blood pressure was measured after approximately 10 min of rest and mean arterial pressure (MAP) was calculated as: MAP=[2/3 diastolic blood pressure (DBP)]+[1/3 systolic blood pressure (SBP)]. Sex-specific Z-scores were calculated as: Z-scoremen=[(40−HDL)/8.9]+[(TGs−150/69.0)]+[(FG−100)/17.8]+[(WC−102)/11.5]+[(MAP−100)/10.1], and Z-scorewomen=[(50−HDL)/14.5]+[(TG−150/69.0)]+[(FG−100)/17.8]+[(WC−88)/12.1]+[(MAP−100)/10.1] (11). The ATP III score was also calculated as the sum of risk factors meeting metabolic syndrome criteria.
Insulin sensitivity and secretion
A 75-gram OGTT was performed after an overnight fast. Insulin and glucose area under the curve (AUC) during the OGTT (i.e., 0, 30, 60, 90, and 120 min) was calculated using the trapezoidal method [i.e., ((OGTT0+OGTT30))/2×30minutes)…((OGTT90+OGTT120)/2×30minutes)]. The homeostasis model assessment of insulin resistance (HOMA-IR) and of insulin secretion (HOMA-B) were calculated as described previously. 16 The Matsuda Index was used to estimate insulin sensitivity. 17 To represent first- and second-phase insulin release, oral glucose-stimulated insulin secretion was estimated as plasma insulin AUC divided by glucose AUC during the first 30 (I0–30/Glc0–30) and last 60 (I60–120/Glc60–120) min of the OGTT. 18 Because glucose-stimulated insulin secretion is affected by the prevailing degree of IR, β-cell function was defined as basal disposition index (HOMA-B/HOMA-IR) and the first and second oral disposition index (I0–30/Glc0–30 or I60–120/Glc60–120×Matsuda Index), to characterize the physiological capacity of the pancreas. 19
Biochemical analysis
Plasma glucose and insulin were determined using the glucose oxidase assay (YSI 2300 STAT Plus, Yellow Springs, OH) and radioimmunoassay (Millipore, Billerica, MA), respectively. Plasma TGs and cholesterol were analyzed using enzymatic methods on an automated platform (Roche Modular Diagnostics, Indianapolis, IN).
Statistics
Data were analyzed using the R statistical package (v. 2.4.0, The R Foundation, Vienna, Austria, 2006). Obese, normal, glucose-tolerant individuals were compared to obese, glucose-intolerant and T2DM adults using analysis of variance (ANOVA). Chi-squared tests were used to assess sex differences, metabolic syndrome prevalence, and racial differences among groups. Pairwise comparisons were used for post hoc analysis. Pearson correlation was used to determine associations. Principal component analysis (PCA) was used to reduce the confounding introduction of several variables that measure the same parameters into a single principle component so it can be used in subsequent analyses. Multiple linear regression was used to determine the independent role of basal and OGTT-derived β-cell function as a predictor of the metabolic syndrome Z-score by including: PCA body composition (i.e., BMI, body fat %, visceral fat, and WC), PCA glucose metabolism (i.e., FG, glucose AUC, and Matsuda Index), MAP, and PCA blood lipid metabolic syndrome criteria (i.e., TG and HDL). Data are mean±standard error of the mean (SEM). Significance was accepted as α≤0.01 to account for multiple comparisons.
Results
Metabolic syndrome and subject characteristic
Adults with T2DM had higher Z-scores and more ATP III risk factors compared to individuals with prediabetes or normal glucose tolerance (NGT), although there was no statistical difference in metabolic syndrome prevalence compared to adults with prediabetes (Table 1). The majority of our study population consisted of women (64%). However, there was no sex difference between groups despite the prediabetes group tending to have more women compared to either the NGT control or T2DM groups (P=0.10 and P=0.11, respectively). Although most patients in our cohort were white (77%), there were a relatively even number of African American and Hispanic adults among the groups.
Metabolic and body composition characteristics
Elevated 2-hr glucose levels were significantly correlated with an increased Z-score (r=0.44, P<0.0002). Adults with T2DM and prediabetes had higher visceral fat content compared to controls (Table 1). Visceral fat was also significantly correlated with the Z-score (r=0.51, P<0.0001). As expected, IR increased across the glucose tolerance continuum (Table 1), and HOMA-IR and the Matsuda Index correlated with the Z-score (r=0.54, P<0.001 and r=−0.49, P<0.002, respectively). VO2max did not differ across the glucose tolerance continuum (Table 1), nor was it associated with the Z-score (r=0.13; P=0.32).
Pancreatic capacity
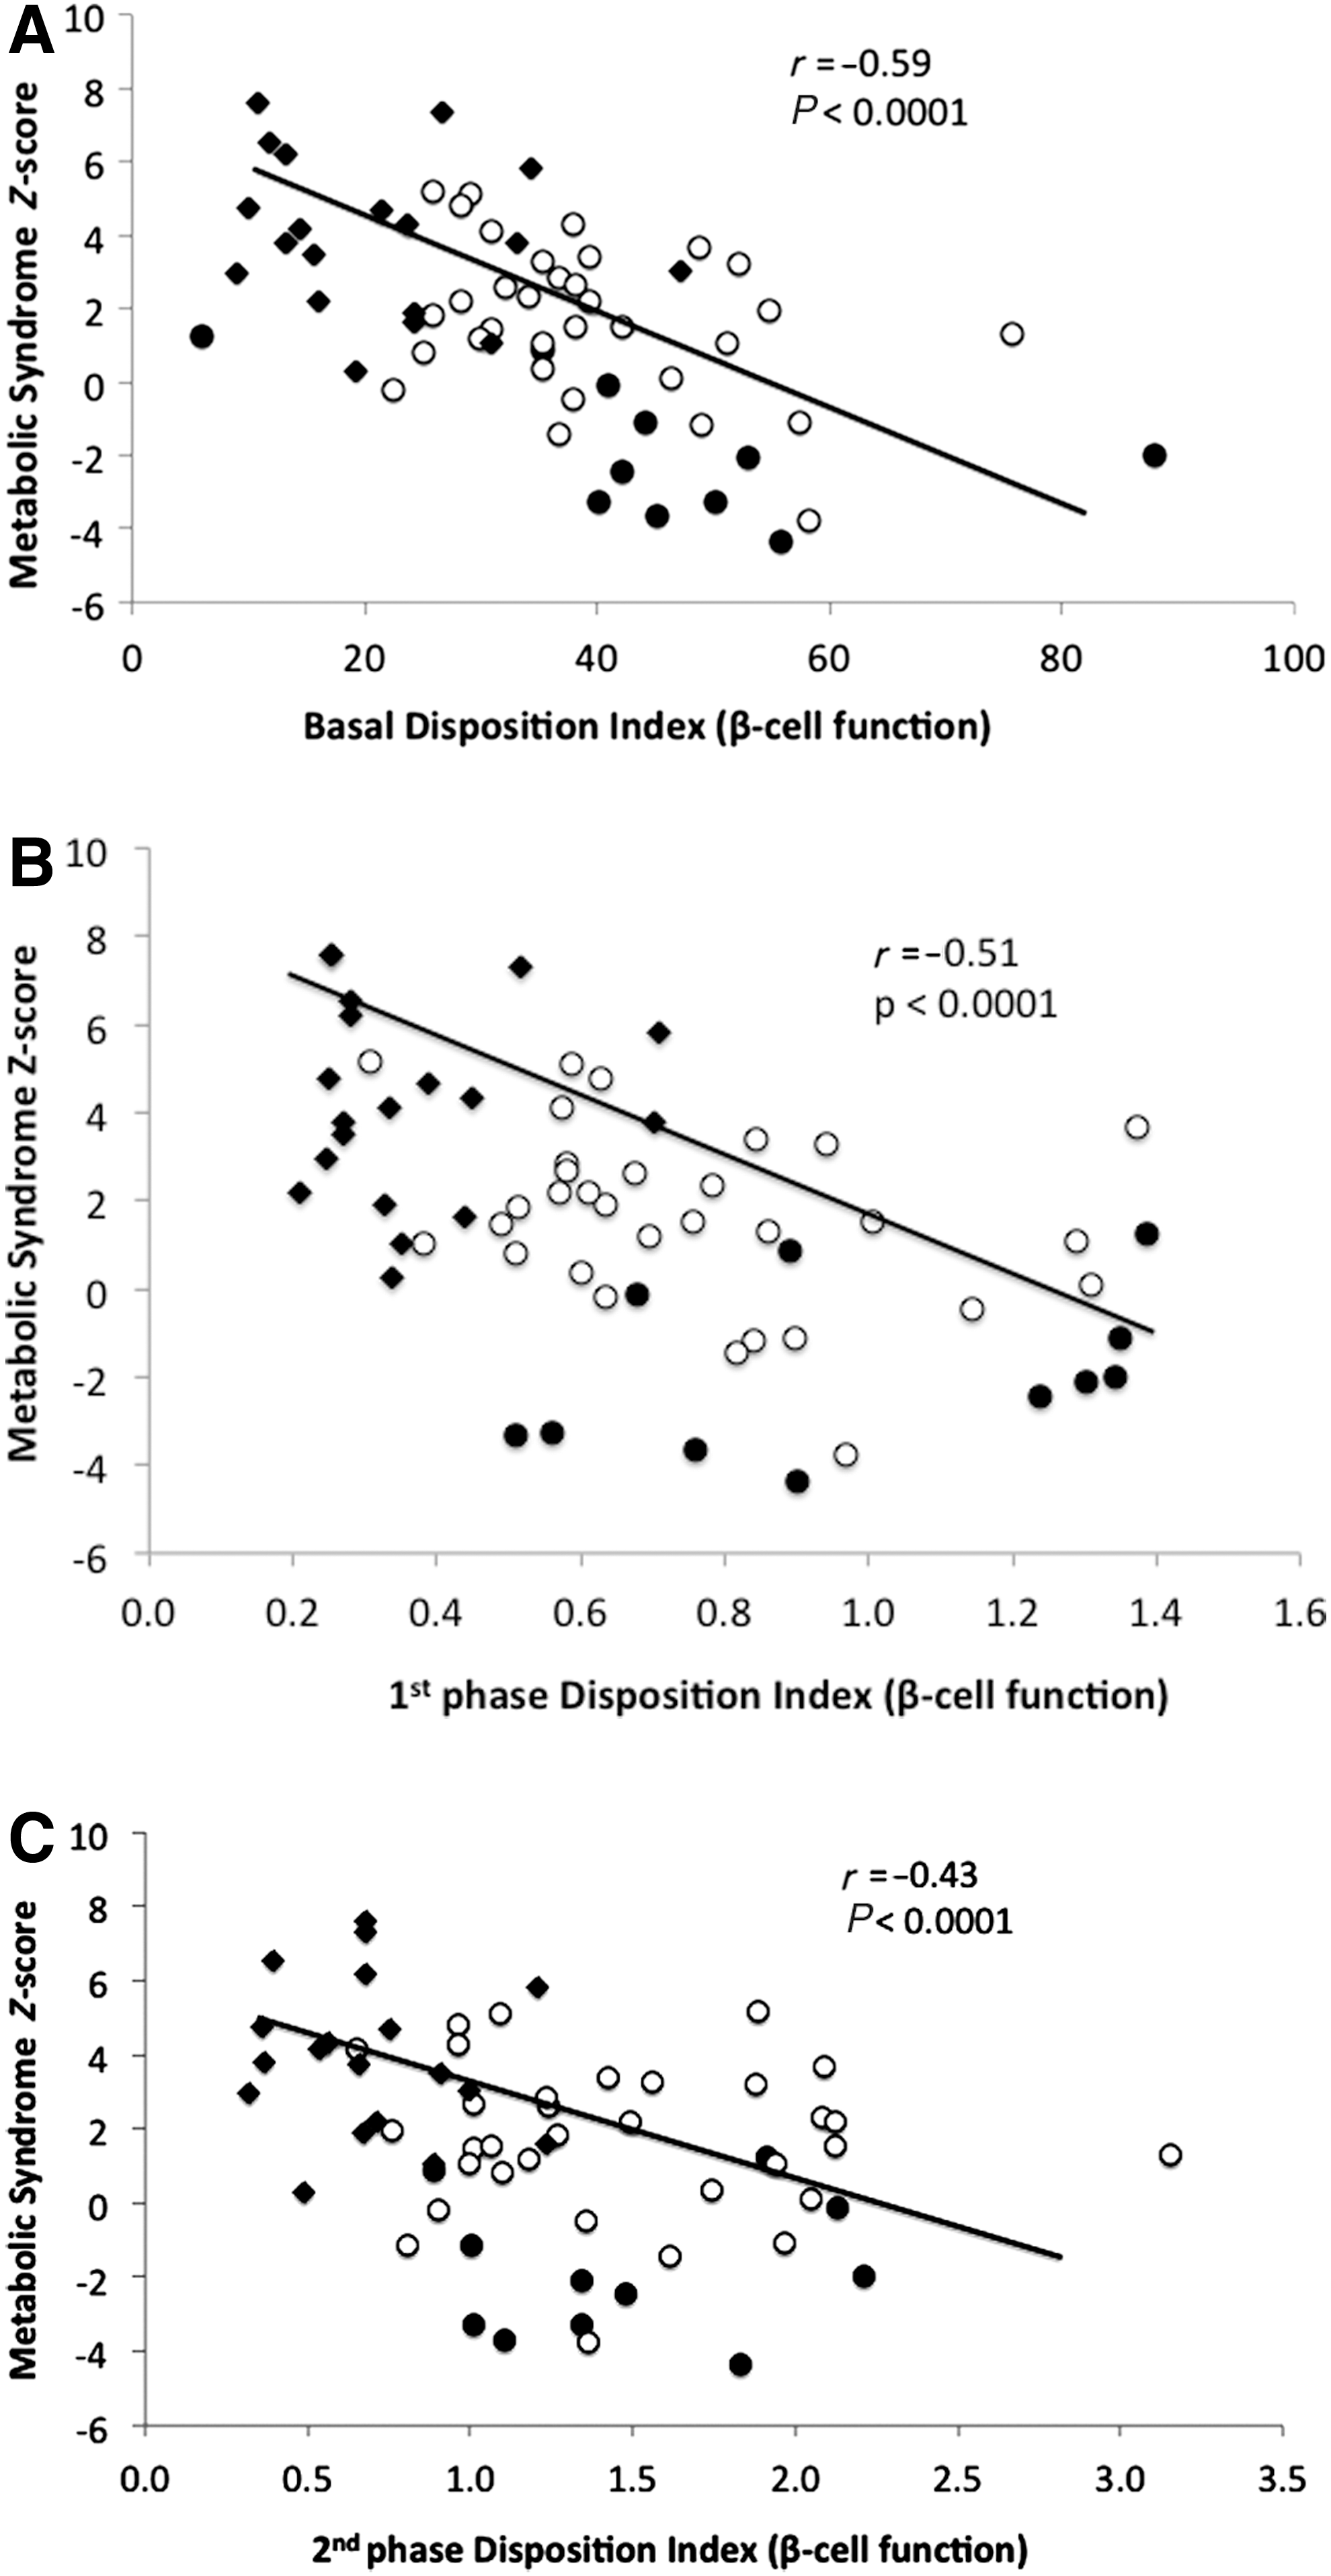
β-cell function, whether estimated from basal, first-, or second-phase–derived OGTT measures, declined across the glucose tolerance spectrum (Table 1). However, we found that β-cell function was similar for men and women (basal, 35.6±3.0 vs. 35.5±2.5, P=0.98; first phase, 0.78±0.09 vs. 0.67±0.06, P=0.32; second phase, 1.3±0.14 vs. 1.1±0.08, P=0.23). Basal disposition index correlated with first- and second-phase measures (r=0.76 and r=0.75, respectively, P<0.0001), while the first phase correlated with second-phase β-cell function (r=0.73, P<0.0001). Basal, first-, and second-phase disposition index measures were inversely associated with the metabolic syndrome Z-score (r=−0.59, r=−0.51, and r=−0.43, respectively; P<0.0001; Fig. 1A–C). In addition, β-cell function was significantly associated with metabolic syndrome Z-score for both men and women, respectively (basal, r=−0.53, P<0.02 vs. r=−0.63, P<0.0001; first phase: r=−0.45, P<0.03 vs. r=−0.53, P<0.001; second phase, r=−0.44, P<0.03 vs. r=−0.48, P<0.002).
Correlation between basal
β-cell function estimated from basal, first-, or second-phase OGTT-derived measures correlated with fasting (r=−0.82, P<0.0001, r=−0.65, and r=−0.70, P<0.0001, respectively) and 2-hr glucose levels (r=−0.72, P<0.0001, r=−0.68, and r=−0.70, P<0.0001, respectively). TGs, total cholesterol, and HDL (r=−0.26, P=0.04, r=0.26, P=0.04 and r=0.29, P=0.02), but not visceral fat (r=−0.11, P=0.36) were statistically correlated with the basal-derived disposition index. TGs, HDL, total cholesterol, and visceral fat were also not associated with first-phase insulin release (r=0.02, P=0.88; r=0.15, P=0.23, r=0.22, P=0.09, and r=−0.13, P=0.28, respectively) or second-phase pancreatic capacity (r=−0.15, P=0.22; r=0.17, p=0.17, r=0.22, P=0.09, and r=−0.13, P=0.30, respectively). Using multivariate analysis, basal, first-, and second-phase β-cell function predicted elevated metabolic syndrome severity (i.e., Z-score) independent of traditional risk factors (P<0.005; Table 2).
SE, standard error; PCA, principal component analysis; MAP, mean arterial blood pressure.
Discussion
β-cell “health” is affected by a multitude of factors that include family history (i.e., genetic predisposition), IR, body fat, and incretin secretion. 20 –22 Independent of these factors, hyperglycemia and dyslipidemia exacerbate IR, thereby inducing compensatory hyperinsulinemia and/or pancreatic failure over time. 23 The novel finding in this study is that β-cell dysfunction is associated with the severity of metabolic syndrome in these obese adults. Recently, Cubeddu and Hoffmann 5 reported that the absolute number of metabolic syndrome risk factors was associated with a decline in insulin secretion. However, the severity of these risk factors was not taken into account, nor was the impact of metabolic syndrome risk factors on basal versus first- and second-phase glucose-stimulated pancreatic function. Thus, our data extend upon this previous work and demonstrate that poor insulin secretion in the fasting and postprandial state is an important factor contributing to the severity of metabolic syndrome, independent of sex, body fat, glucose abnormalities, dyslipidemia, and blood pressure.
The assessment of insulin secretion in men and women is challenging and varies depending on the degree of IR. The characterization of β-cell function may also differ if viewed in the context of fasting versus orally derived measures of plasma insulin and glucose concentrations. Basal levels only reflect a single complex interaction between glucose and insulin concentrations and cannot provide insight into the ability of the pancreas to respond to rising and falling levels of glucose that typically occur after meal consumption. 16,24 Alternatively, data from the OGTT provides insight into glucose-stimulated insulin release and first- and second-phase pancreatic function. Measurement of first-phase insulin secretion typically represents the exocytosis of previously primed insulin secretory granules, whereas second-phase insulin release reflects the maturation and/or docking of new insulin secretory granules that occur in response to fluctuating glucose concentrations. 25 In this study, basal, first-, and second-phase estimates of β-cell function each correlated with elevated metabolic syndrome severity. Thus, these data suggest that the aggregate of cardiometabolic risk factors comprising metabolic syndrome severity based on ATP III criteria are related to defects in the readily available pool of insulin as well as the processing, docking, and synthesis of new insulin. 25,26
The exact mechanism responsible for poor insulin secretion across the glucose tolerance spectrum is unclear. A “healthy” β-cell responds to IR by changes in both function and mass to maintain normal glucose concentrations. 27 A mismatch between function and mass leads to β-cell dysfunction and subsequently glucose intolerance and type 2 diabetes. Elevated blood lipids are known to impair insulin secretion. 27,28 In the current study, we observed a statistically significant correlation between TGs, total cholesterol, and HDL with the basal derived measures of β-cell function. However, the physiological relevance of this observation is uncertain given the weak correlation. We did not observe a statistically significant univariate correlation between elevated TGs/cholesterol, or reduced HDL and poor insulin secretion estimated from the OGTT. Although we cannot rule out the possibility that lipotoxicity [i.e., elevated free fatty acid (FFA) levels] is an important regulator of basal and postprandial estimates of β-cell function, 29,30 our findings suggest a strong relationship between elevated glucose concentrations and reduced insulin secretion capacity.
Indeed, our findings are consistent with work showing that hyperglycemia is associated with impaired insulin secretion, because adults with glucose intolerance are reported to have lost nearly 50%–80% of their insulin secretion capacity. 4 Interestingly, β-cell function (basal, first-, and second-phase disposition index) was higher in those individuals with prediabetes, compared to those who had metabolic syndrome plus prediabetes (P<0.02; data not shown). Although this supports the notion that metabolic syndrome impairs pancreatic insulin secretion, further work is needed to confirm these findings. From our current work, we are unable to determine whether hyperglycemia per se reduces insulin secretion or if a reduction in β-cell function yields elevated blood glucose concentrations, but the mechanism is likely related to the severity of the disease state, 31 physical activity performed, 8 and nutritional background. 9 In addition, gender differences in metabolic syndrome may also contribute to variation in insulin secretion across the glucose tolerance spectrum, although sex did not influence the relationship between metabolic syndrome Z-score and β-cell function in the current study. 32 Last, it is important to consider the relatively low number of individuals representing different races (i.e., African Americans, Hispanic, etc.) in our study. Given that increased IR and insulin secretion have been documented in nondiabetic African Americans and Hispanics compared with non-Hispanic whites, further work is needed to characterize the role of metabolic syndrome severity across different races. 33 These data, nevertheless, suggest that additional work is needed in men and women to examine the mechanism(s) by which metabolic syndrome severity affects the capacity to release/synthesize insulin versus the change in β-cell mass.
In conclusion, β-cell dysfunction is associated with elevated metabolic syndrome severity, independent of IR, central adiposity, and traditional cardiometabolic risk factors in obese adults. Our data highlight the pancreas as an important organ in the pathophysiology of metabolic syndrome. Future work needs to address the mechanism responsible for the effects of metabolic syndrome severity on the insulin pool that is readily available for release from the β-cell, as well as the processes of synthesis, granule maturation, and exocytosis that contribute to abnormal insulin release. A better understanding of pancreatic function should lead to the design of optimal interventions, including exercise, nutrition, and/or pharmacological treatments for the management and prevention of cardiometabolic disease and T2DM.
Footnotes
Acknowledgments
S.K.M and J.P.K contributed to the study design. S.K.M was primarily responsible for data analysis and statistical integrity. S.K.M, S.F, C.F., M.R., and J.F assisted with data analysis and study organization. S.K.M and J.P.K. wrote the manuscript. We thank the nursing staff for technical assistance. We also thank the dedicated research assistants and participants for their effort. This research was supported by the National Institutes of Health R01 AG12834 (to J.P.K.), and the National Center for Research Resources, CTSA 1UL1 RR-024989, Cleveland, Ohio. S.K.M was supported by an NIH T32 DK007319.
Author Disclosure Statement
No competing financial interests exist.