
Abstract
Epicardial fat (epicardial adipose tissue, EAT) has been implicated in the pathogenesis of coronary artery disease (CAD). The objective of this study was to examine the relationship between EAT and generalized obesity, central or visceral adipose tissue (VAT), and the components of the metabolic syndrome—systolic blood pressure (SBP), triglycerides (TGs), high-density lipoprotein cholesterol (HDL-C), and fasting blood glucose (FBG)—that are linked to CAD. A systematic review of the literature, following meta-analysis guidelines, was conducted until May, 2013, using the search strategy “Obesity” OR “abdominal obesity” OR “metabolic syndrome” OR “metabolic syndrome X” AND “epicardial fat”. Thirty-eight studies fulfilled the criteria. There was a highly significant (P<0.00001) correlation between EAT and body mass index (BMI), waist circumference (WC), or VAT. The correlation between EAT and VAT was significantly (P<0.0001) greater than the correlation between EAT and WC, which in turn was significantly greater than the correlation between EAT and BMI. Overall, EAT was 7.5±0.1 mm in thickness in the metabolic syndrome (n=427) compared to 4.0±0.1 mm in controls (n=301). EAT correlated significantly (P<0.0001) with SBP, TGs, HDL, and FBG, but the strength of the association was less than one-half of the relationship of EAT to indices of obesity. The results of multivariate analysis were less consistent but show a relationship between EAT and metabolic syndrome independent of BMI. In summary, the very strong correlation between EAT and VAT suggests a relationship between these two adipose tissue depots. Measurement of EAT can be useful to indicate VAT. Whereas EAT correlates significantly with each of the components of the metabolic syndrome— SBP, TGs, HDL, or FBG—the magnitude of the relationship is considerably and significantly less than the relationship of EAT to BMI. These data show the strong relationship between EAT and BMI but especially with WC and VAT. They also demonstrate the smaller magnitude of the association of EAT with standard coronary risk factors, related to the metabolic syndrome, and suggest that the unique features of this adipose tissue warrant detailed investigation.
Introduction
E
Methods
Search strategy
A systematic review of the literature was conducted following meta-analysis guidelines and using a preferred reporting system for systematic review and meta-analysis for observational studies. 12,13 A systematic search was conducted until May, 2013, to identify studies that examined the relationship between obesity and EAT. The Medline and EMbase databases were searched using the PubMed and OvidSP platforms. The full electronic search strategy used was “Obesity” OR “abdominal obesity” OR “metabolic syndrome” OR “metabolic syndrome X” AND “epicardial fat” limited to humans. Similar search terms were used when searching OvidSP Medline and OvidSP EMbase. The Cochrane was queried for reviews on EAT.
Eligibility criteria
Studies that met the following criteria were included: (1) An original study published in a peer-review journal, (2) measurement of EAT in persons with or without obesity or the metabolic syndrome, (3) adults (aged ≥18 years), (4) subjects without a secondary cause of metabolic syndrome such as human immunodeficiency virus (HIV), (4) presentation of a univariate correlation between EAT and a measure of body weight or obesity, i.e., body mass index (BMI) or waist circumference (WC) or visceral adiposity/abdominal fat. Duplicate studies, non-English studies, abstracts from unpublished studies, reviews, case reports, and letters were excluded. In a few cases, studies from the same author in the same time frame were included because it was not possible to confirm that they were duplicate studies of the same patient population. Studies of paracardiac fat were excluded from review both because these studies are not on EAT and the potential confusion that might result combining parietal pericardial fat with EAT.
Data extraction
A predefined protocol was used in accordance with recommendations. 12 From each eligible study, patient characteristics and the method of measurement of EAT were recorded systematically. Patient characteristics included average age, sex, correlation with BMI, WC, abdominal VAT, blood pressure, fasting blood glucose (FBG), triglycerides (TGs), and high-density lipoprotein cholesterol (HDL-C). The criteria for the diagnosis of the metabolic syndrome were also recorded.
Outcome assessment
The principal summary outcome measure was the univariate correlation between EAT and BMI, WC, and the components of metabolic syndrome, namely FBG, systolic blood pressure (SBP), TGs, and HDL-C. For each eligible finding, the correlation coefficient, direction of correlation, and significance were recorded. The other outcome measurement was also the measurement of EAT in persons with or without the metabolic syndrome and multivariate analysis relating EAT to metabolic syndrome considering other factors.
Statistical analysis
Meta-analyses of the aggregate patient data were conducted with the Comprehensive Meta-analysis Version 2 (Biostat, Englewood, NJ). From each entry, the study name, sample size, mean and standard deviation, and correlation coefficient were entered. The Fischer z transformation was used to compare the summary correlation coefficients of the different techniques. 14 To assess heterogeneity, the Cochrane Q statistic was calculated. Statistical significance was set as P<0.05.
To determine if any one publication had a disproportionate effect on the summary correlation coefficient, sensitivity analyses were conducted (Comprehensive Meta-analysis Version 2). Each study was sequentially removed and the analysis was repeated. The point estimates of correlation coefficients were compared to the primary result to identify any changes in significance of the correlation.
Results
There were 38 studies that fulfilled the eligibility criteria (Fig. 1). The studies represented were predominantly from countries in Europe, but other countries throughout the world were included (Table 1). There were 26 studies that presented data with the univariate correlation coefficient between EAT and BMI (Fig. 2). Twenty-three studies reported a significant correlation; two studies reported no significant relationship and one was almost significant at the 5% level. Overall there was a highly significant (P<0.00001) correlation between EAT and BMI. The total sample size was 2490 persons.
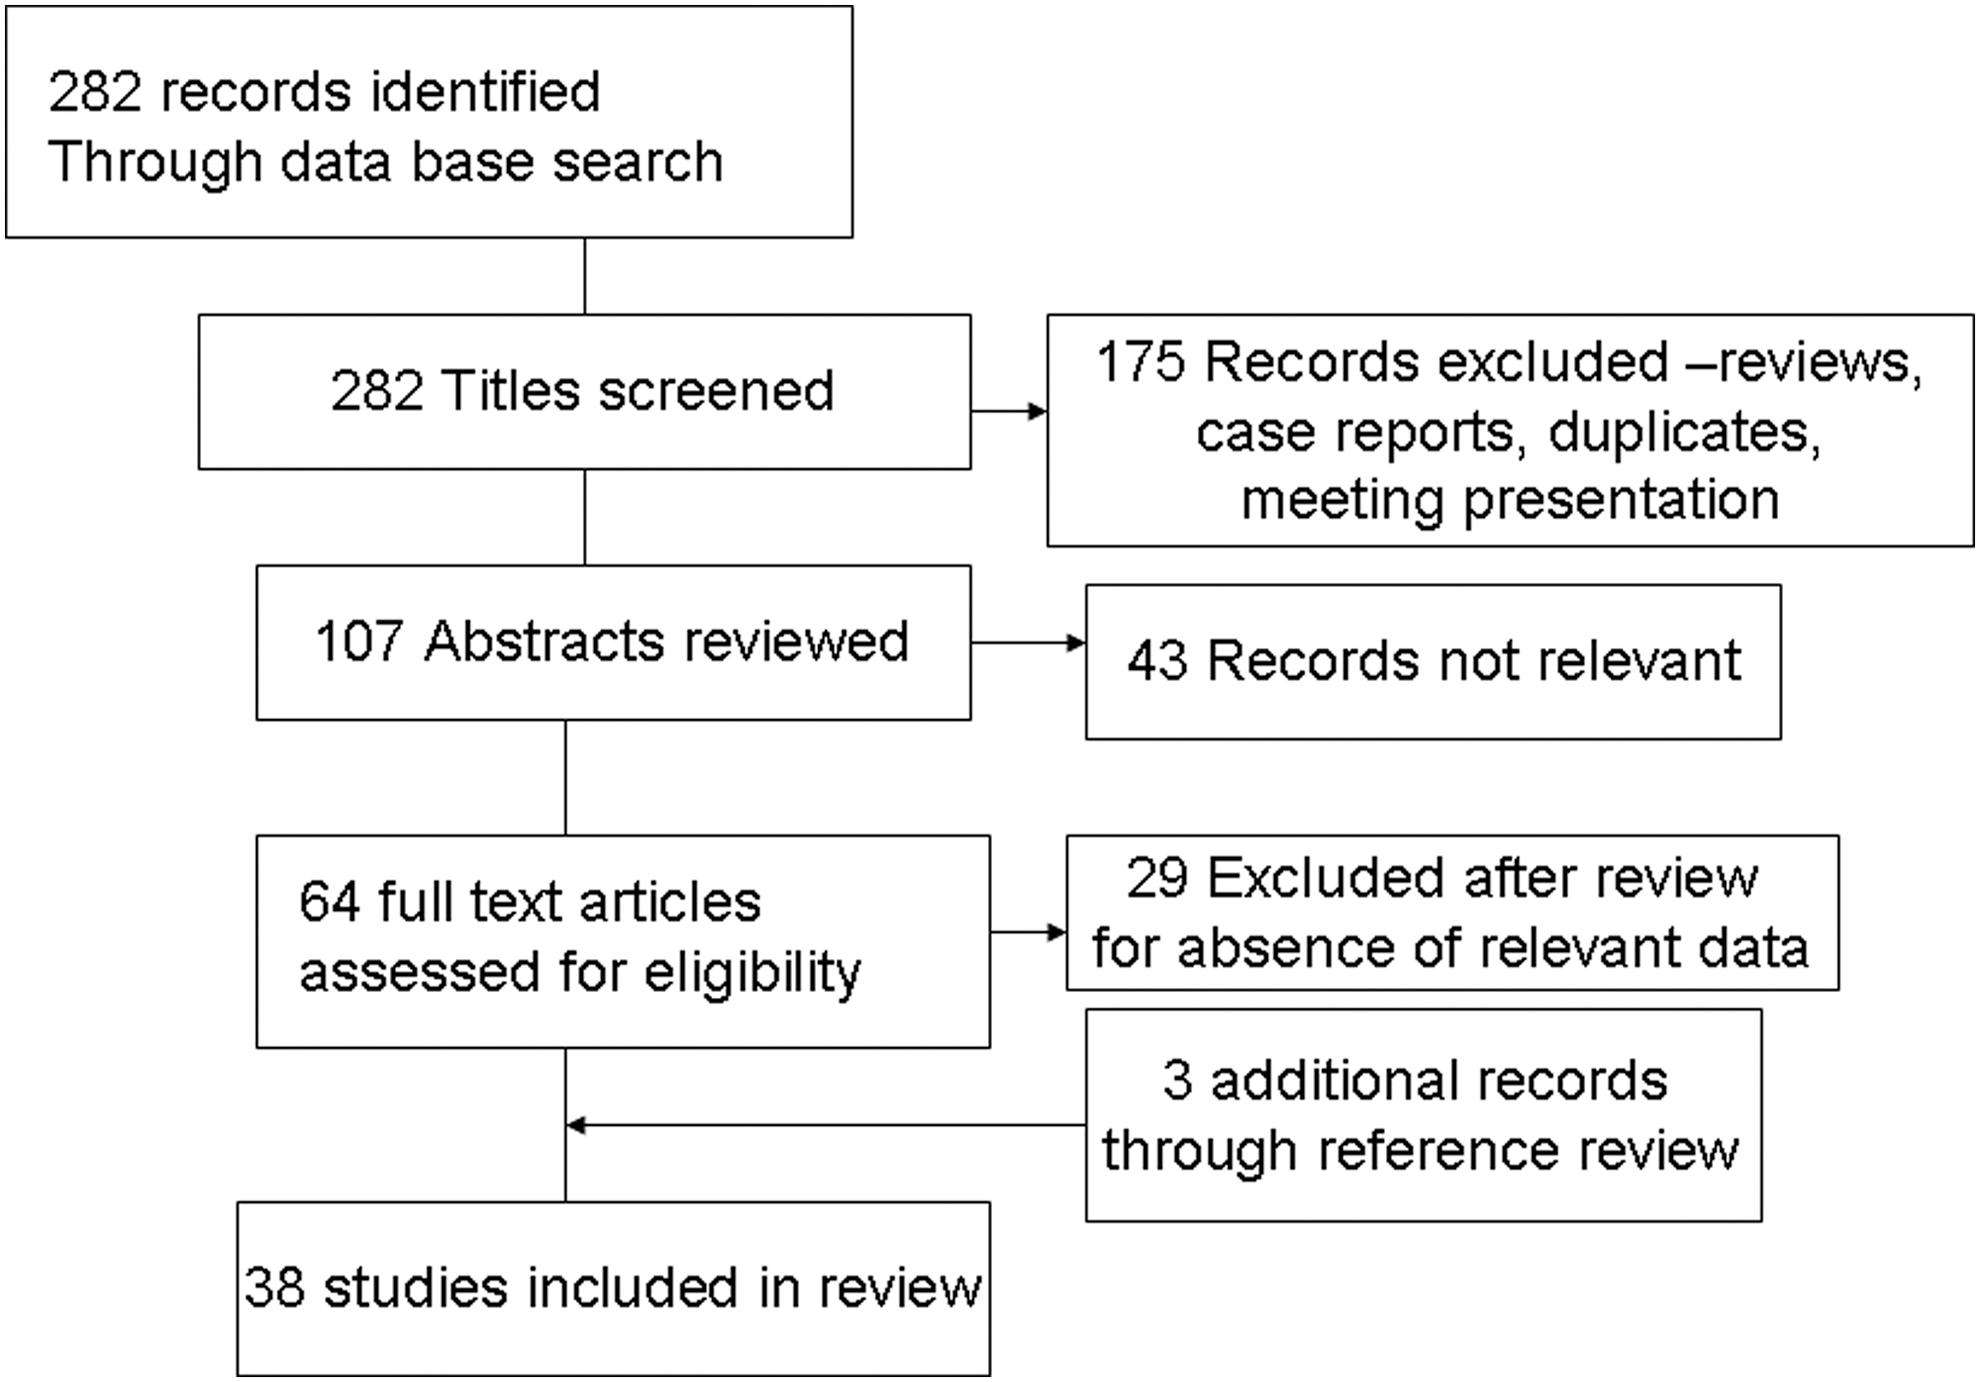
Flow diagram for selection of studies that were included in the meta-analyses.
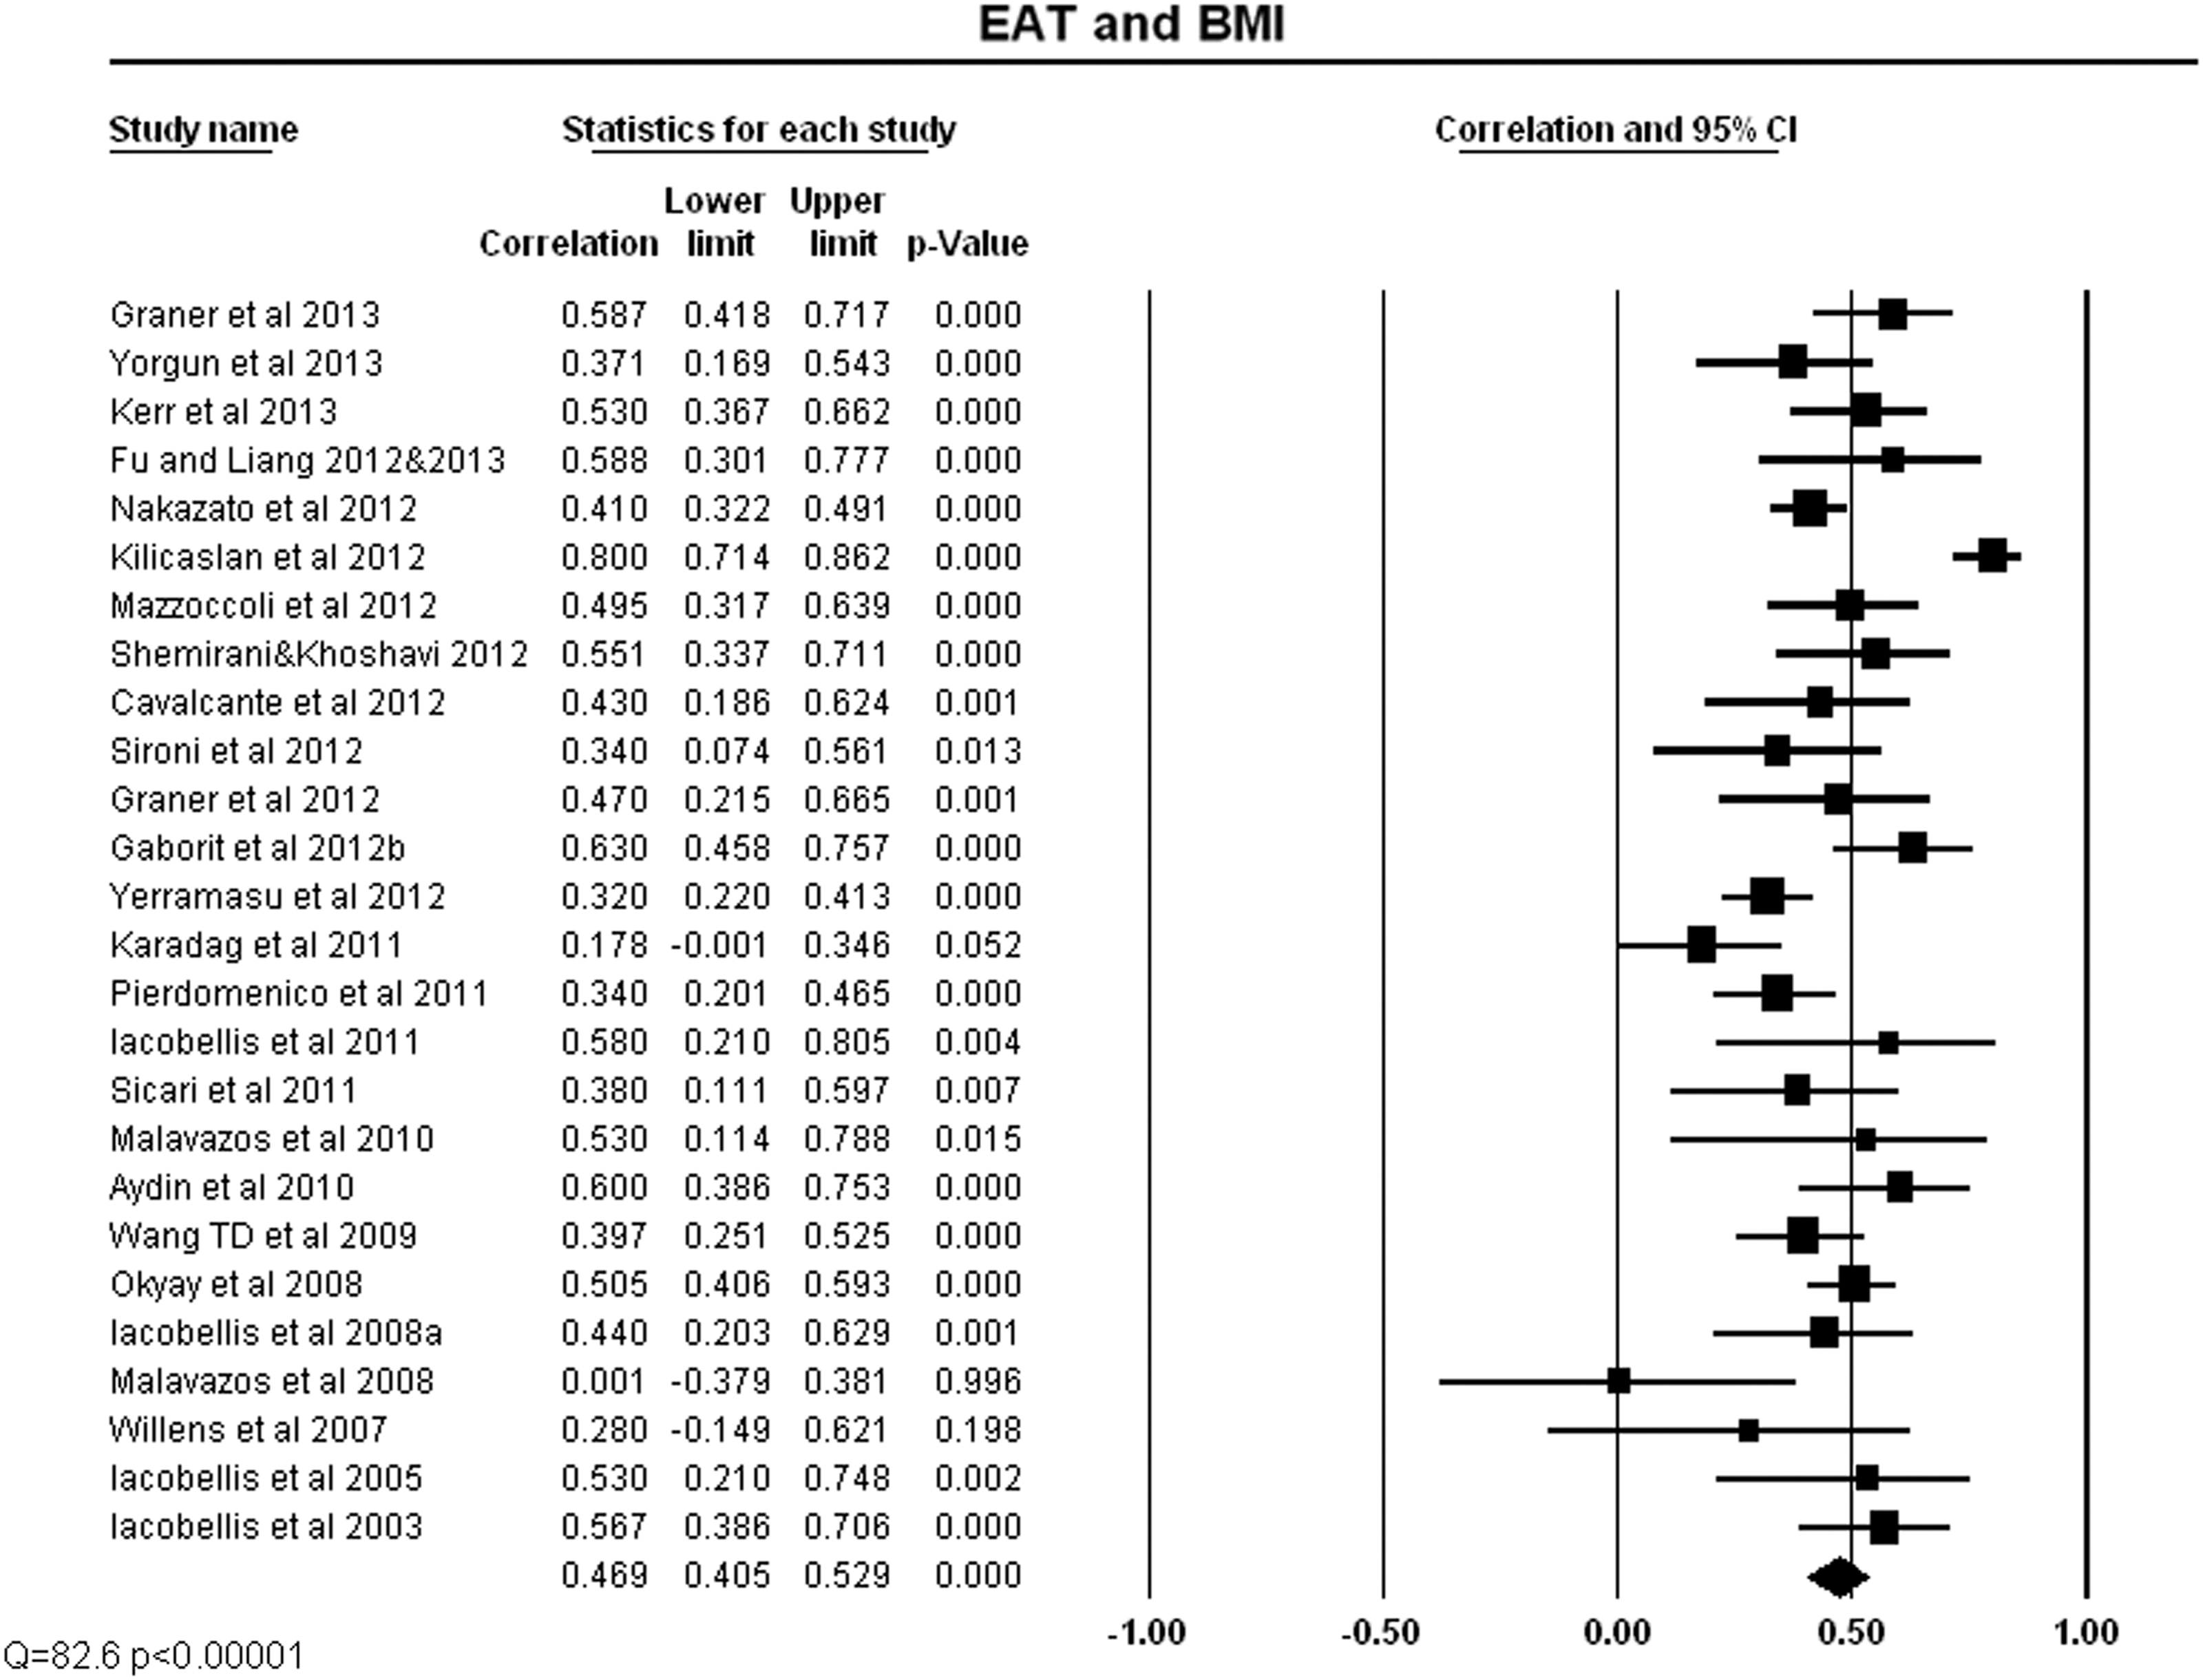
Correlation coefficient and 95% confidence intervals (CI) for each of the studies that evaluated the relationship between epicardial adipose tissue (EAT) and body mass index (BMI)
HIV cases excluded.
MRI, magnetic resonance imaging; CT, computed tomography; NA, not available.
Sensitivity analysis showed that exclusion of any single study from the analysis did not significantly alter the overall findings. In addition, there were four studies that presented the data as a significance level but without correlation coefficients. Four studies reported a significant correlation between EAT and BMI, 15 –17,53 and one study did not find a significant relationship. 18 Thus, 87% (26 of 30) of studies found a significant relationship between EAT and BMI. Considering that there were different methodologies employed for measurement of EAT, the relationship was examined for the 17 studies that had echocardiographic EAT measurements that showed a significant correlation (r=0.474, p<0.0000, n=1171) between EAT and BMI. The nine studies with EAT measured by computed tomography (CT) or magnetic resonance imaging (MRI) (the data were combined because of the smaller number of studies using each alone) also showed a significant (P<0.0001) correlation (r=0.437) between EAT and BMI (n=1319). There was no significant (z=1.16) difference between the correlation of EAT and BMI between the two different approaches measuring EAT, i.e., echocardiography or CT/MRI.
There were 20 studies that presented data with the univariate correlation coefficient between EAT and WC 19 –39 (Fig. 3). Each study showed a significant correlation, so the combination of all studies indicated a highly significant (P<0.00001) correlation between EAT and WC with a total sample size of 2168 persons. Sensitivity analysis showed that exclusion of any single study from the analysis did not significantly alter the overall findings. In addition, there were four studies that presented the data as a significance level, and all four reported a highly significant correlation between EAT and WC. 15 –17,53 Thus, all studies reported a significant relationship between EAT (regardless of the method of its measurement) and WC. The correlation between EAT and WC (r=0.567) was significantly (z=−4.57, P<0.0001) greater than the correlation between EAT and BMI (r=0.469).

Correlation coefficient and 95% confidence intervals (CI) for each of the studies that evaluated the relationship between epicardial adipose tissue (EAT) and waist circumference (WC)
There were 11 studies that correlated EAT and VAT 15,19,23 –25,34,36,38 –42 (Fig. 4). Ten studies presented the data, and each of them found a significant correlation; thus, the combination of all studies indicated a highly significant (P<0.00001) correlation between EAT and VAT. The total sample size was 570 persons. Sensitivity analysis showed that exclusion of any single study from the analysis did not significantly alter the overall findings. In addition, another study that did not present the actual correlation coefficient found a significant relationship between EAT and VAT. 15 The correlation between EAT and VAT (r=0.0.686) was significantly (z=−4.18, P<0.0001) greater than the correlation between EAT and WC. Most studies measuring VAT also measured BMI. Exclusion of two studies, with a sample size of 78 persons, that did not present data for both EAT and BMI or VAT did not alter the relationship between EAT and VAT. VAT was measured primarily by two different methods MRI or CT [including dual-energy X-ray absorptiometry (DEXA)]. The correlation of EAT with VAT was significant regardless of the method of VAT measurement and was significantly (z=−2.59; P<0.01) higher in studies that used CT compared to those that used MRI (r=0.766 vs. 0.648, respectively).
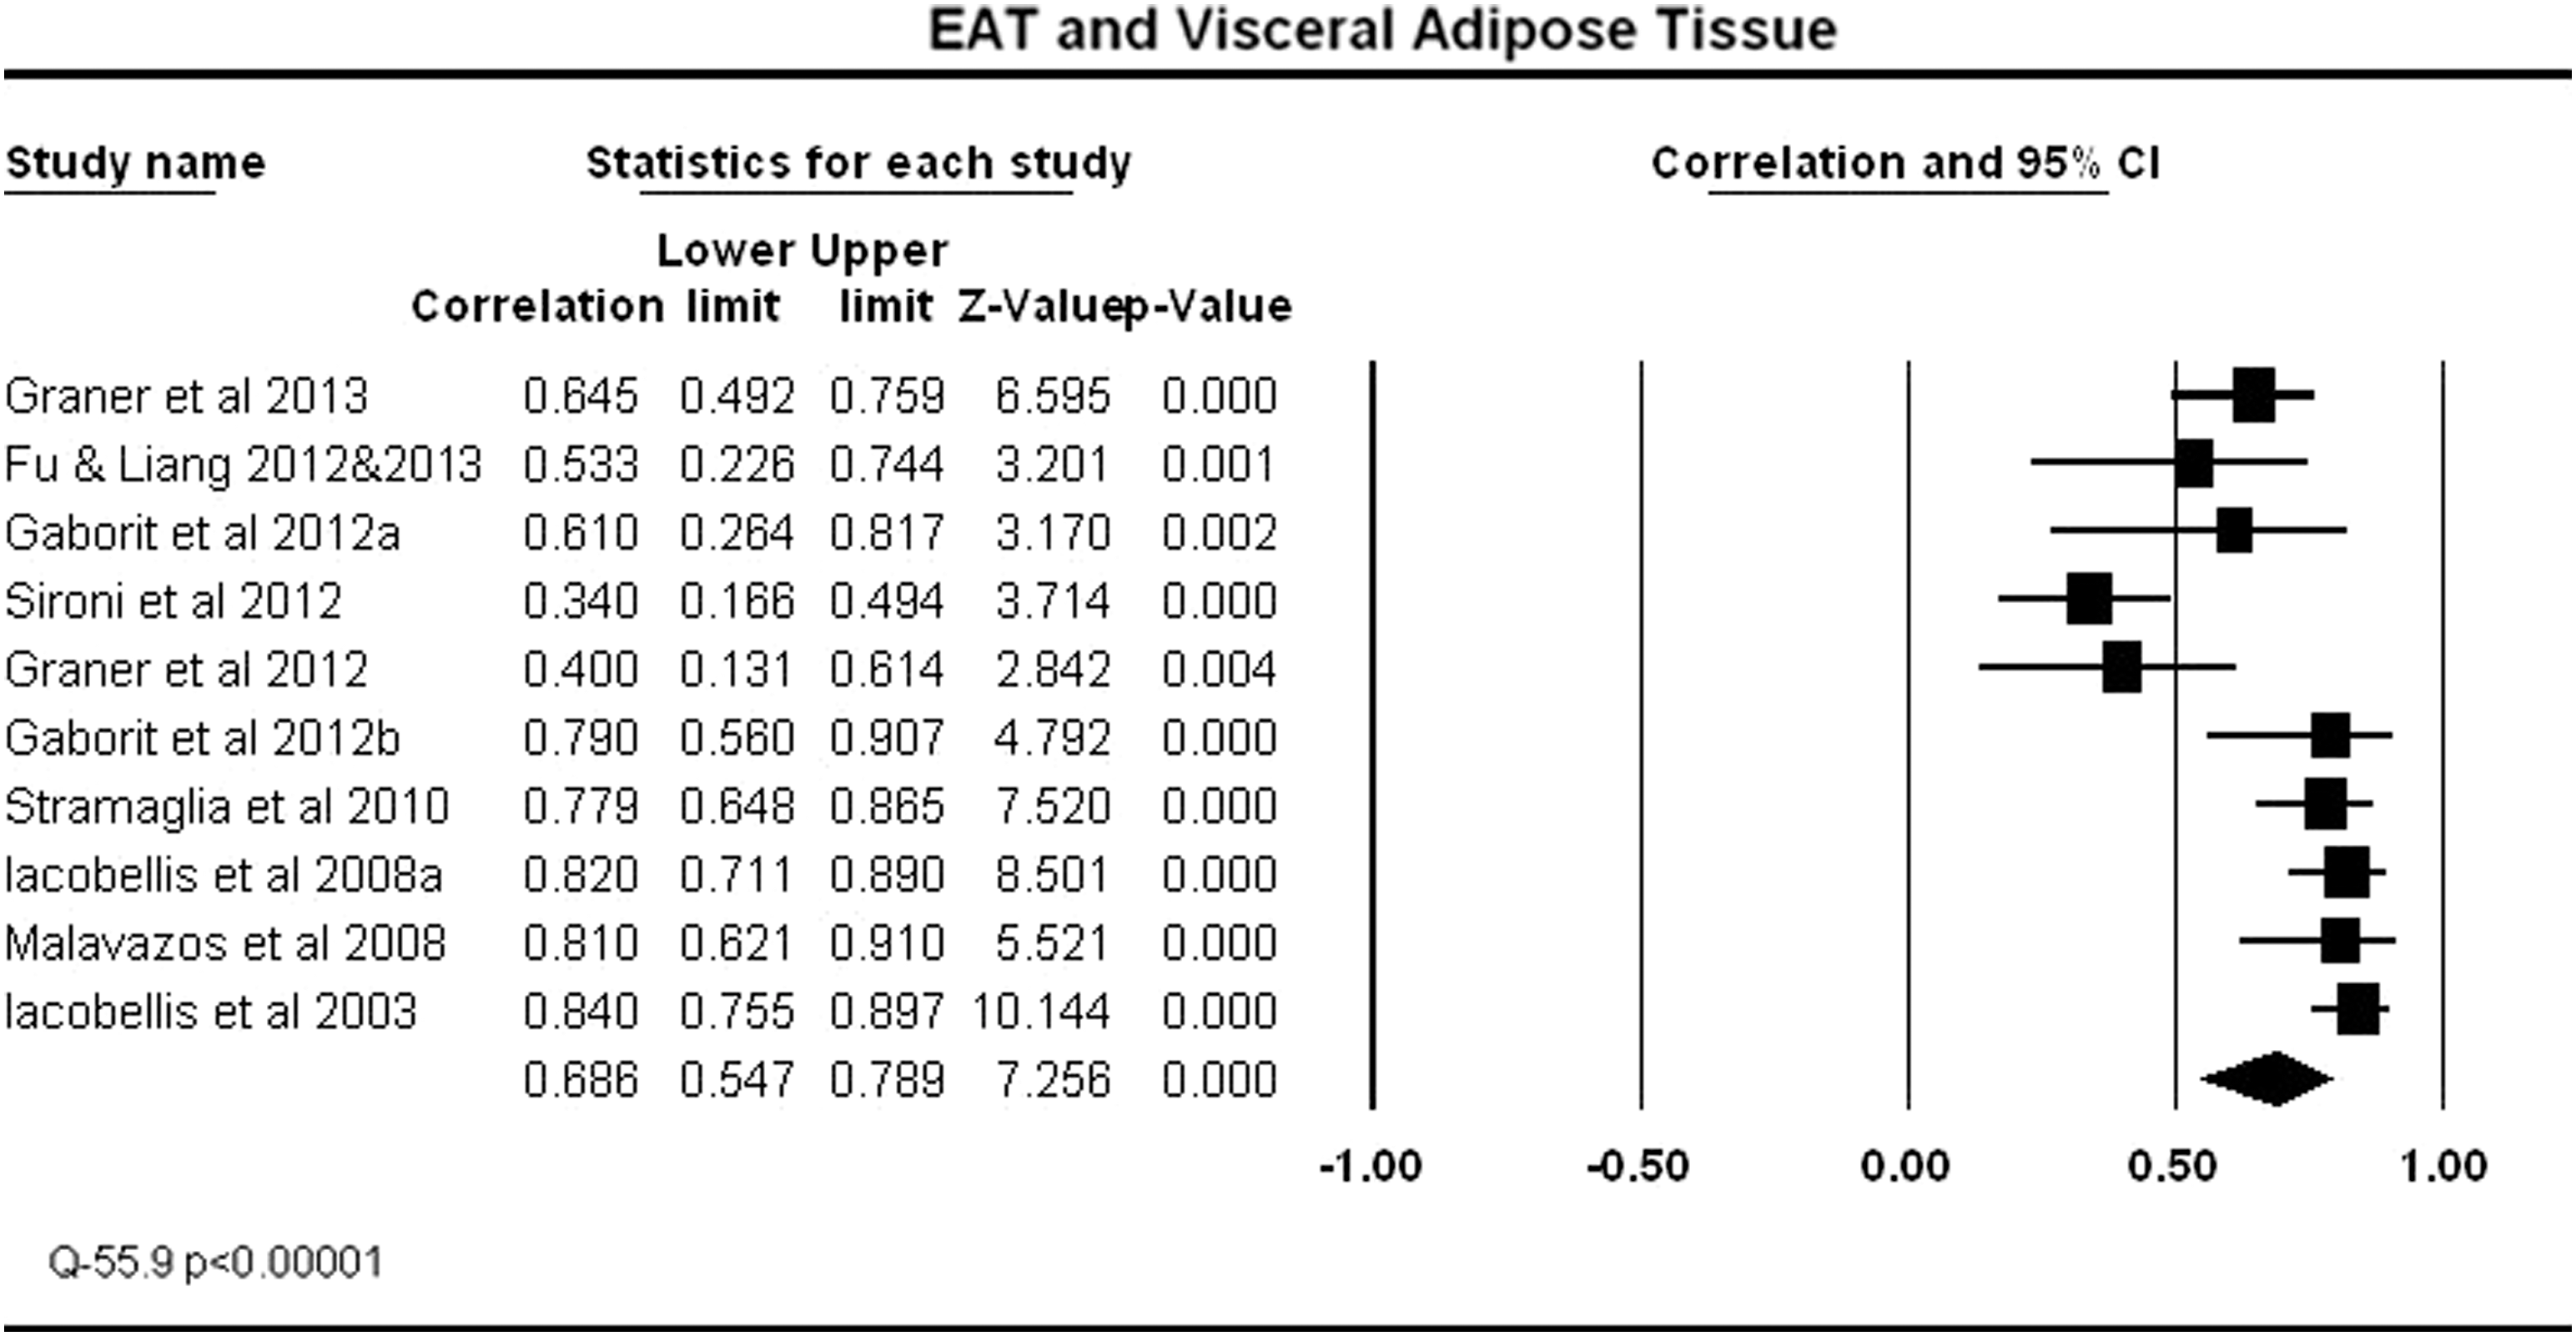
Correlation coefficient and 95% confidence intervals (CI) for each of the studies that evaluated the relationship between epicardial adipose tissue (EAT) and visceral adipose tissue (VAT). The mean correlation coefficient, lower limit, upper limit, and significance level for the entire group are shown in the last line. The Cochrane Q statistic as an assessment of heterogeneity is shown at the bottom left.
There were 11 studies that correlated SBP with EAT (Fig. 5). Eight of the studies showed a significant correlation between EAT and SBP. Overall there was a highly significant (P<0.00001) correlation between EAT and SBP. The total sample size was 1395 persons. Sensitivity analysis showed that exclusion of any single study from the analysis did not significantly alter the overall findings. Although there was a statistically significant relationship between EAT and SBP, the correlation coefficient was not high (r=0.216). The correlation between EAT and BMI was significantly (P<0.001) greater than the correlation between EAT and SBP.

Correlation coefficient and 95% confidence intervals (CI) for each of the studies that evaluated the relationship between epidcardial adipose tissue (EAT) and systolic blood pressure (SBP). The mean correlation coefficient, lower limit, upper limit, and significance level for the entire group are shown in the last line. The Cochrane Q statistic as an assessment of heterogeneity is shown at the bottom left.
There were 15 studies that correlated TGs and EAT (Fig. 6). Eleven of the studies showed a significant correlation between EAT and TGs. The total sample size was 2287 persons and there was a highly significant (P<0.00001) correlation between EAT and TGs, although the correlation coefficient was not high (r=0.292). Sensitivity analysis showed that exclusion of any single study from the analysis did not significantly alter the overall findings.
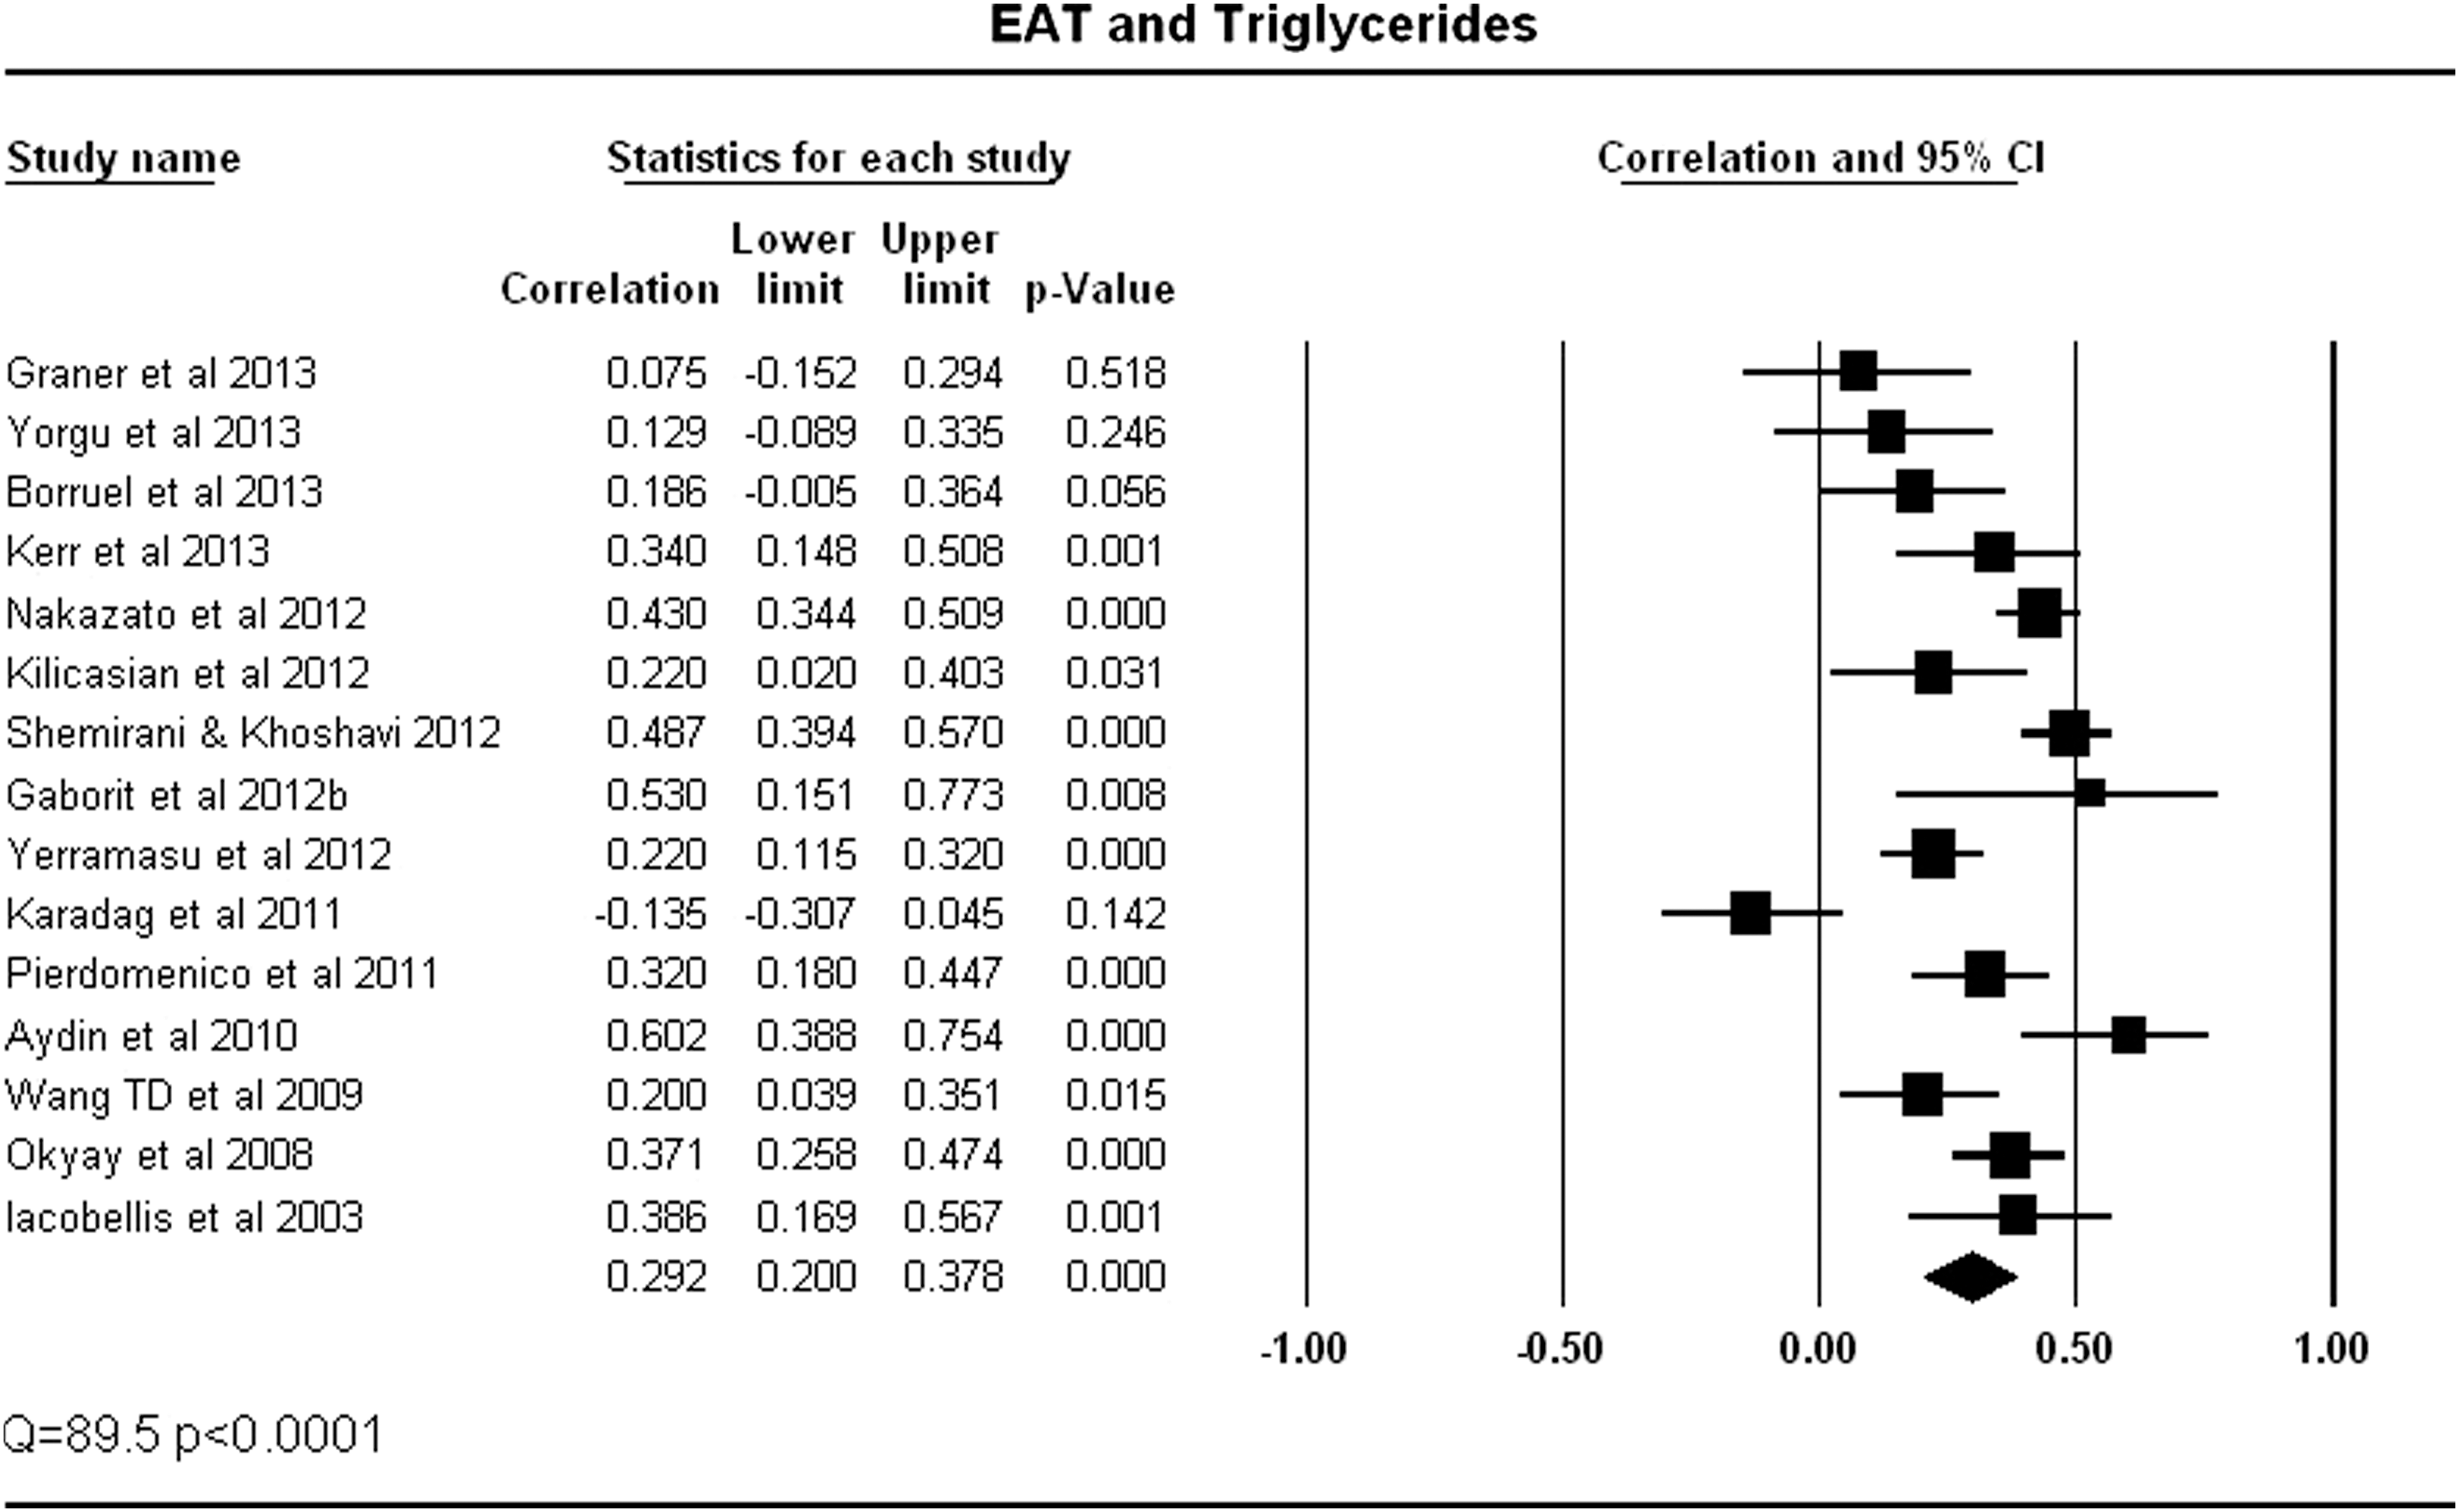
Correlation coefficient and 95% confidence intervals (CI) for each of the studies that evaluated the relationship between epicardial adipose tissue (EAT) and triglycerides. The mean correlation coefficient, lower limit, upper limit, and significance level for the entire group are shown in the last line. The Cochrane Q statistic as an assessment of heterogeneity is shown at the bottom left.
There were 13 studies that correlated HDL and EAT (Fig. 7). The correlation coefficients were always negative, indicating a lower HDL with greater EAT. Nine of the studies showed a significant correlation between EAT, and overall there was a highly significant (p<0.00001) correlation between EAT and HDL. The total sample size was 1749 persons. Sensitivity analysis showed that exclusion of any single study from the analysis did not significantly alter the overall findings.

Correlation coefficient and 95% confidence intervals (CI) for each of the studies that evaluated the relationship between epicardial adipose tissue (EAT) and high-density lipoprotein cholesterol
There were 12 studies that correlated FBG and EAT (Fig. 8). Seven of the studies showed a significant correlation between EAT and FBG. Overall there was a highly significant (P<0.0001) correlation between EAT and FBG with a correlation coefficient (r=0.240). The total sample size was 1412 persons. Sensitivity analysis showed that exclusion of any single study from the analysis did not significantly alter the overall findings. Overall, there was a significant relationship between EAT and FBG, but the proportion of studies that did not find a relationship is larger than the other correlation analysis.
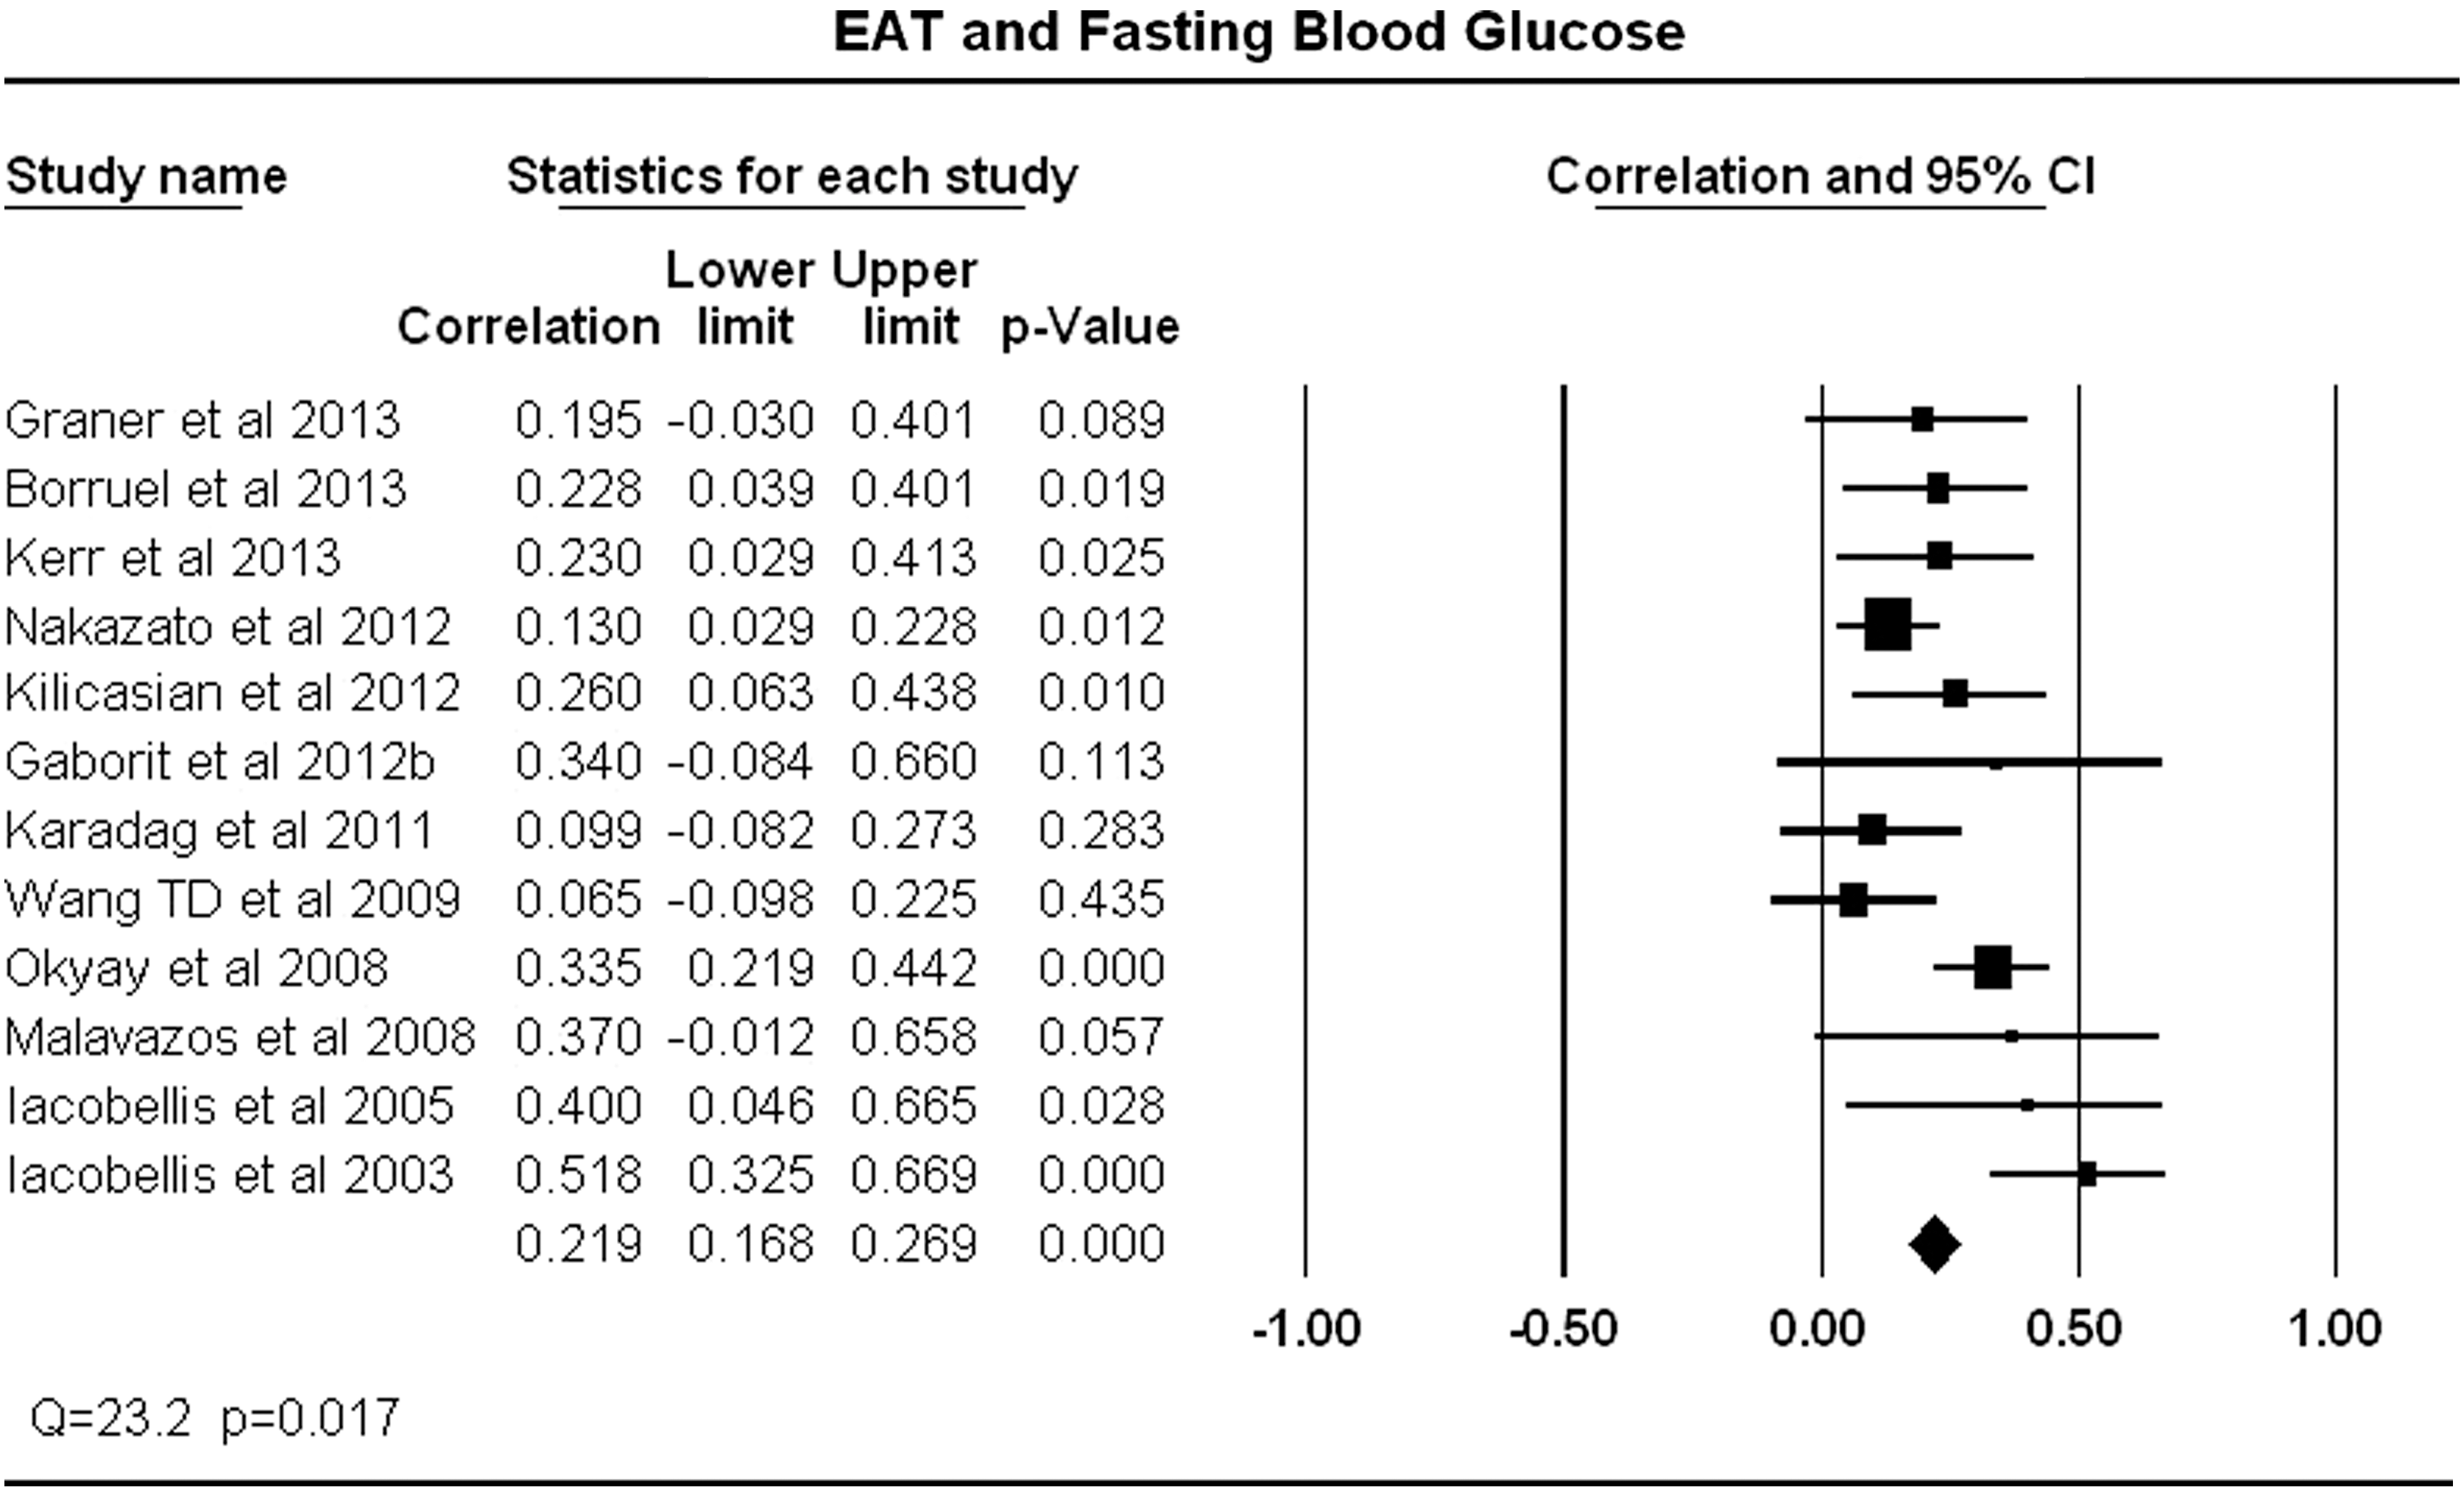
Correlation coefficient and 95% confidence intervals (CI) for each of the studies that evaluated the relationship between epicardial adipose tissue (EAT) and fasting blood glucose (FBG)
EAT in metabolic syndrome
Eighteen studies examined EAT in relation to the metabolic syndrome, with most (82%) using the National Cholesterol Education Program (NCEP) definition 9 and the minority using the International Diabetes or the Harmonized definition of metabolic syndrome 8,43 (Table 1). EAT was compared in persons with or without metabolic syndrome. 33,41,44 –49 Echo-measured EAT was the only measurement used because the units were consistent rather than the variations in EAT measurement of thickness, area, or volume reported by studies using CT or MRI to evaluate EAT. There were six studies that reported mean±standard deviation (SD) and permitted pooling of the data (Fig. 9). One study that reported the median and range (without SD) is included for comparison both alone as well as in combination of studies when considering the mean values only. 47 All studies except one 33 used the NCEP definition 9 ; however, there was no difference in the data for that study. There was more EAT in persons with the metabolic syndrome (n=427) because EAT was 7.5±0.1 mm in thickness compared to 4.0±0.1 mm in controls (n=301). Meta-analysis comparing the SD for the difference showed a highly significant (p<0.000) difference between persons with metabolic syndrome compared to those without metabolic syndrome. Sensitivity analysis showed that exclusion of any single study from the analysis did not significantly alter the overall findings. One study used MRI to measure EAT thickness in the anterior intraventricular groove and found a significantly greater EAT thickness in persons with metabolic syndrome compared to controls. 49 The values for EAT thickness (9.3±2.5 vs. 5.8±1.8 mm) were similar to the studies using echocardiographically measured EAT. 49

Epicardial adipose tissue (EAT) thickness for each of the studies where it was measured by echocardiography in persons with and without the metabolic syndrome. MetS, metabolic syndrome; SD, standard deviation.
Multivariate analysis
The relationship between EAT and metabolic syndrome after adjusting for relevant factors in multivariate analysis is not clear. Studies that asked a limited question in a general population group, namely whether EAT was related to the components of the metabolic syndrome, usually found a significant relationship 32,46,50,51 In contrast, EAT was not related to metabolic syndrome factors in other studies, 26,29,52 e.g., patients with glucose intolerance in one study. 39 Yorgun et al. found in multiple regression analysis that mean EAT thickness correlated with metabolic syndrome, age and BMI but not TGs or HDL. 44 De Vos found a significant independent correlation of EAT with age and WC, but no additional significant relationship between SBP, HDL, TG, or FBG. 53 If the number of variables was expanded to include other factors, such as the presence of diabetes mellitus, its duration as well as other inflammatory markers such as interleukin-6 (IL-6), the strength of the association between EAT and the metabolic syndrome decreased markedly and was not significant 52 (Table 2).
+Not significant in univariate analysis.
WC, waist circumference; BMI, body mass index; IL-6, interleukin-6; LDL-C, low-density lipoprotein cholesterol; CRP, C-reactive protein.
Discussion
This meta-analysis demonstrates convincingly that EAT significantly correlates with the principal clinical indicators of obesity, specifically BMI and WC. Importantly, there is a stronger correlation between EAT and abdominal adiposity, measured by MRI, CT, or DEXA, than with the other indicators of obesity. EAT also correlates significantly with four (nonobesity) components of the metabolic syndrome, specifically FBG, SBP, TGs, and HDL-C. These correlations, however, were not as strong as the correlation between EAT and indices of obesity. Multivariate analysis supports a relationship between EAT and the metabolic syndrome, independent of obesity, but the relationship is not robust.
The majority of studies showed a significant relationship between EAT and BMI, but the few exceptions are worth discussion. The reasons for those exceptions are uncertain, but one possibility is that the relationship is not valid in morbid obesity because two of the studies that failed to find a significant association consisted of persons with morbid obesity. 42,54 This proposed explanation is consistent with the concept that there is a limitation to the space into which EAT can expand, in contrast to the relatively minimal constraints for increases in generalized adiposity. It has been suggested that there is a sex difference in the relationship of EAT to BMI, with a relationship mainly or exclusively in men. 17 That suggestion is not substantiated by this meta-analysis, which showed a significant relationship between EAT and BMI with a sex distribution that was almost equal (55% men). Furthermore the relationship between EAT and BMI was evident even in a study that consisted only of women. 21
Evaluation of the data across studies demonstrated a high correlation between EAT and VAT that was significantly stronger than the relationship between EAT and BMI or WC. This finding has several implications. The data provide compelling evidence for a linkage between the two adipose depots (EAT and VAT). Anatomic similarities in animals, in the absence of detailed embryologic investigation, suggested a common origin during embryogenesis of EAT and VAT. 55 This is an intriguing but as yet unproved suggestion. Data in the present study showing the consistency of the EAT and VAT relationship between studies, as well as the high correlation, strongly suggests that the two fat depots share a commonality of features or characteristics.
The relationship between EAT and VAT was significantly greater than the relationship between EAT and WC. WC can be confounded by subcutaneous fat, which becomes an increasing problem with obese individuals. The higher correlation between EAT and VAT buttresses the argument that measurement of EAT on echocardiography maybe a useful and less expensive method to assess VAT compared to CT, MRI, or DEXA.
EAT was almost twice as thick in persons with metabolic syndrome compared to those without metabolic syndrome. Echocardiographic measurement was used for consistency. The data from some MRI studies support this finding, and indeed the 2:1 ratio was almost identical to the ratio found on MRI. 19 EAT has utility in the diagnosis of metabolic syndrome, and it has been suggested that an EAT 9.5 mm or greater in men and 7.5 mm or greater in women has a high sensitivity and specificity for prediction of metabolic syndrome. 47
VAT has been implicated as playing a major role in production of hypertension, dyslipidemia, and glucose intolerance, which increase cardiovascular risk. 56 The significant relationship between EAT and factors such as blood glucose most likely reflects the association of VAT and insulin resistance or glucose intolerance. 35 The strong correlation between EAT and VAT raises the question of whether EAT is also responsible for the production of the other components of the metabolic syndrome or whether the larger amount of adipose tissue mass in the abdomen is the dominant factor. Until interventions can specifically target only one fat depot, this question will likely be unresolved.
The metabolic syndrome is constructed from several different elements but with slight variations in the diagnostic criteria. 8,9,43 Each of three different metabolic syndrome criteria was used in the studies that comprised this report. Several studies have shown that there is a significant relationship between the greater the amount of EAT and the larger the number of criteria that constitute the metabolic syndrome. 44,51
Some data suggest that the specific location of EAT, i.e., its regional distribution over the heart, may vary in the strength of the association with the metabolic syndrome, with a stronger association evident with EAT on the right and left atrioventricular groove and anterior right ventricle than other areas of the heart. 44 A precise explanation for this possibility, however, is not available.
The limitations of this meta-analysis mainly relate to the nature of the studies evaluated. The kinds of studies vary from the baseline characteristics of morbid obesity persons who are having bariatric surgery to surveys of individuals with normal weight. The spectrum of studies, however, strengthens the ability to extrapolate the data. Second, studies published in non-English languages were excluded from our meta-analysis. However, excluding non-English studies does not materially alter most meta-analyses.
57
Third, the studies did not have a common protocol, such as blood pressure, for collection or reporting of patient characteristics. However, this is a standard issue with meta-analysis. Fourth, the imaging techniques for assessment of EAT vary. The majority, almost two-thirds, of the studies used echocardiography to measure EAT. Thus, here is considerable consistency. Despite the differences in EAT measurement methodology, the results are relatively similar between studies. This is due in part to the similarity in measurement between techniques because CT or MRI correlate well with the echocardiography measurement, the most frequently used methodology in EAT assessment.
49
Nevertheless, there is concern about the accuracy and standardization of EAT measurement both within and between the different imaging modalities, including echocardiography, MRI, and CT. Fourth, although CT provides high spatial resolution and true volume coverage of the heart, there is no standard algorithm for data acquisition, interpretation, and EAT quantification, and data are insufficient regarding the normal distribution of fat volumes in the population, thus cautioning the application of even this technology to EAT measurement.
58
Fifth, it is important to note that a high proportion of the studies included in the meta-analysis were in populations with the metabolic syndrome, obesity, or diabetes. Last
This review focused on EAT and did not include pericardial fat because of the differences in the location of the fat depots and the potential for problems with data interpretation when combining two different fat depots. Nevertheless, it is important to note that in population studies such as the Framingham Heart Study, there is a higher prevalence for all cardiovascular risk factors, including diabetes, low HDL-C, hypertension, and metabolic syndrome in categories of high intrathoracic and pericardial fat deposits. 60 In the Multi-Ethnic Study of Atherosclerosis (MESA) population, pericardial fat was significantly correlated with both BMI and WC and was also correlated with the risk of developing coronary heart disease after further adjustment for BMI and other CVD risk factors. 61
In summary, EAT correlates with the degree of obesity as determined by BMI; however, EAT has a significantly stronger association with visceral adiposity than BMI or WC. EAT correlates significantly with each of the (other) components of the metabolic syndrome— SBP, TGs, HDL-C, or FBG—to a similar extent that is considerably less than the relationship of EAT to BMI. The very strong correlation between EAT and VAT suggests a relationship between these two adipose tissue depots. Echocardiographic measurement of EAT can be useful to indicate VAT. Although EAT correlates significantly with each of the components of the metabolic syndrome (SBP, TGs, HDL-C, or FBG), the magnitude of the relationship is considerably and significantly less than the relationship of EAT to BMI. These data raise the possibility that the association of EAT with CAD cannot be readily explained by standard risk factors, and the unique features of this adipose tissue warrants further investigations.
Footnotes
Author Disclosure Statement
The author declares no conflicts of interest.