
Abstract
Background:
Glycated hemoglobin (HbA1c) has been advocated for the diagnosis of diabetes and prediabetes. Its performance has been commonly assessed in corroboration with elevated fasting plasma glucose (FPG), but not the combination of FPG and 2-hr glucose values. This study assesses receiver operating characteristics (ROC) curves of HbA1c pertaining to the diagnoses of prediabetes and diabetes by FPG and/or 2-hr glucose, and the effects of age, gender, and race.
Methods:
We assessed the utility of HbA1c for diagnosing diabetes and prediabetes among 5395 adults without known diabetes from the National Health and Nutrition Examination Survey (NHANES) 2005–2010.
Results:
Current cutoffs of HbA1c for diabetes (6.5%) or prediabetes (5.7%) exhibited low sensitivity (0.249 and 0.354, respectively) and high specificity in identifying patients diagnosed using both FPG and 2-hr glucose, resulting in large false-negative rates (75.1% and 64.9%). Misdiagnosis rates increased with age and in non-Hispanic whites and Mexican Americans. When HbA1c was combined with FPG for diagnoses, the false-negative rate remained high for diabetes (45.7%), but was reduced for prediabetes (9.2%).
Conclusions:
When assessed against diagnoses using both FPG and 2-hr glucose, HbA1c had low sensitivity and high specificity for identifying diabetes and prediabetes, which varied as a function of age and race. Regarding recently released American Diabetes Association (ADA) and joint European guidelines, it is important to consider that HbA1c values below 6.5% and 5.7% do not reliably exclude the presence of diabetes and prediabetes, respectively. Overall, the data argue for greater use of oral glucose tolerance tests (OGTTs) and both FPG and 2-hr glucose values for diagnosis of diabetes and prediabetes.
Introduction
D
These findings warrant a closer examination of the relationship between HbA1c and the traditional diagnostic parameters, FPG as well as 2-hr OGTT glucose, including an examination of receiver operating characteristics (ROC) curves across gender, ethnicity, and age groups. In particular, the previous evaluations assessing the utility of HbA1c were compared with diagnoses established using FPG only and not the combination of FPG and 2-hr glucose levels. 2-hr glucose values were not measured during NHANES 1999–2004, but are available in a subset of subjects in recently released data from NHANES 2005–2010. We have now examined the associations of HbA1c with FPG and 2-hr glucose across gender, age, and racial/ethnic subgroups, and have employed ROC curves to assess HbA1c as a diagnostic criterion for diabetes and prediabetes in a population without known incidence of diabetes at baseline and who were also screened with FPG and 2-hr glucose.
Methods
Survey and sample
NHANES is a cross-sectional, nationally representative sample of the civilian non-institutionalized US population. The survey is conducted by the National Center for Health Statistics (NCHS) using a complex, stratified, multistage probability cluster design. 14 The NCHS Ethics Review Board approved all NHANES protocols before data collection, and all adult participants provided written informed consent. 14 The participant response rate has consistently been ∼75% for interview and ∼70% for examination at mobile examination centers among adults (≥20 years) for each 2-year survey circle. 15 FPG and insulin were measured (fasting time over 8 hr) in a subsample of the study population. Since 2005, 2-hr plasma glucose levels during a standard OGTT have also been measured in subsamples of subjects, who also provided fasting blood specimens. In this report, we have only analyzed adult (≥20 year) participants without self-reported diabetes and not on antidiabetic medication at baseline and who also had available measurements for HbA1c, FPG (>8 hr fasting), and 2-hr glucose from NHANES 2005–2010.
Variables
Race/ethnicity was self-reported as non-Hispanic white, non-Hispanic black, Mexican American, other Hispanic, and other. Age was categorized into: 20–39 years, 40–59 years, and 60+years based on age at the interview. FPG, 2-hr glucose, and insulin were measured in the morning examination session only. Plasma glucose levels were measured enzymatically, fasting insulin was measured by enzyme-linked immunosorbent assay (ELISA), and HbA1c was determined by high-performance liquid chromatography. HbA1c was standardized to the Diabetes Complications and Control Trial method. 16 Detailed specimen collection and processing instructions are described in the NHANES Laboratory Procedures Manual. 16 FPG values were adjusted using provided regression equations to account for lab method differences following NHANES analytical recommendations. 17,18
We performed ROC curve analysis for the utility of HbA1c as a diagnosis criteria of diabetes or prediabetes, against that diagnosed using the criteria of FPG and 2-hr glucose: Diabetes as FPG ≥126 mg/dL and/or 2-hr glucose ≥200 mg/dL and prediabetes (impaired fasting glucose) as FPG ≥100 mg/dL and/or 2-hr glucose ≥14 mg/dL, but not meeting the criteria for diabetes. 4 The J value to derive Youden Index 19 was calculated as sensitivity+specificity −1.
Statistical analysis
All analyses were conducted according to NHANES Analytic and Reporting Guidelines. 14,20 Standard errors were calculated using Taylor series linearization. Logistic regression models were used to assess the ROC curves for HbA1c to identify patients with diabetes or prediabetes diagnosed by FPG or 2-hr glucose criteria. Area under the (ROC) curve (AUC) for HbA1c and the confidence interval of AUC were calculated based on methods developed by Delong et al. 21 A chi-squared test with 1 degree of freedom was used for comparison of AUCs between subgroups. Statistical significance was determined as a two-sided P<0.05. SAS for Windows version 9.3 (SAS Institute) was used for statistical analysis.
Results
Subjects
The current study is comprised of NHANES enrollees without known diabetes evaluated with FPG, 2-hr glucose, and HbA1c for diagnosis of diabetes and prediabetes. The characteristics of the participants are presented in Table S1
Relationships between HbA1c, FPG, and 2-hr glucose
Using linear regression models
At any given HbA1c level reported, non-Hispanic blacks exhibited notably lower FPG and 2-hr glucose levels, compared with non-Hispanic whites (Fig. 1). Conversely, at any given FPG or 2-hr glucose level, non-Hispanic blacks had much higher HbA1c levels than non-Hispanic whites.
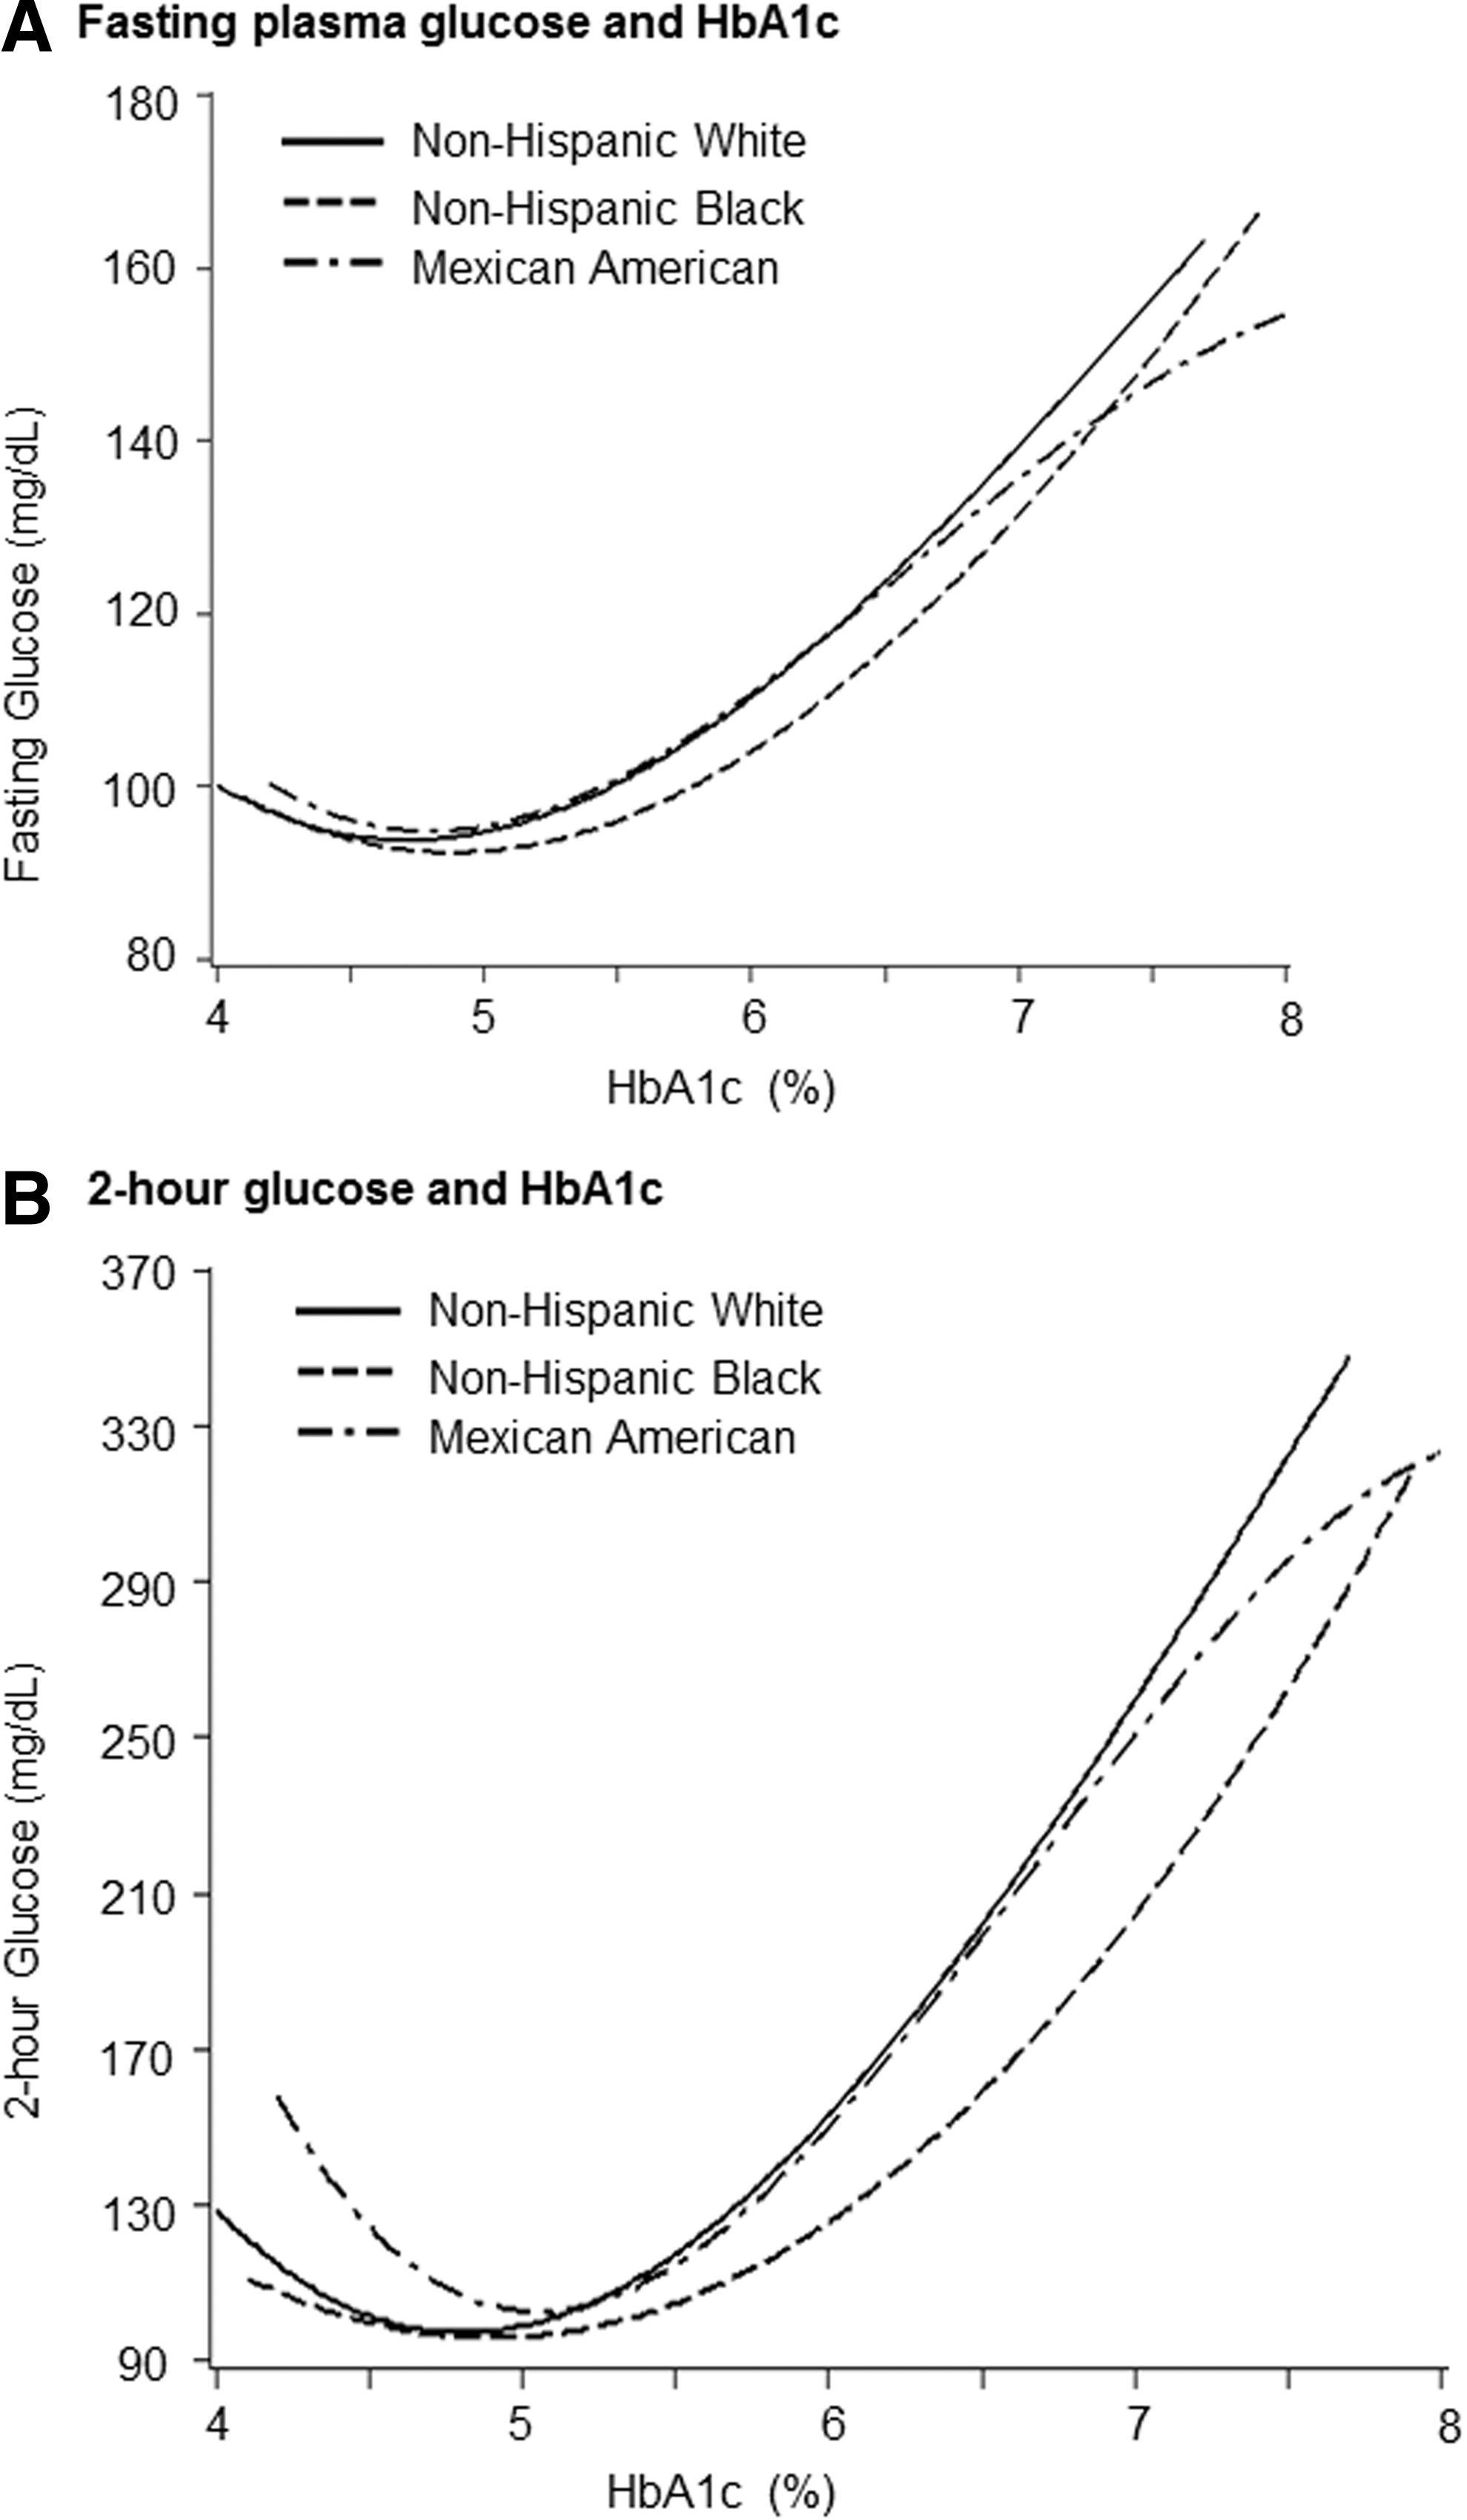
Fasting plasma glucose and 2-hr glucose with glycated hemoglobin (HbA1c) levels among US adults (≥20 years) in National Health and Nutrition Examination Survey (NHANES) 2005–2010.
Diabetes: sensitivity and specificity of diagnosis by HbA1c
ROC curves for HbA1c as the criterion to identify patients with diabetes (who were diagnosed using FPG ≥126 mg/dL, 2-hr glucose ≥200 mg/dL but with FPG <126 mg/dL, or elevated FPG and/or 2-hr glucose values) are shown in Fig. 2. The corresponding sensitivity and specificity values for various HbA1c cutoff values (6.2% to 6.6%) are listed in Tables S2–S5. The area under the ROC curve (AUC) assessing HbA1c utility for the diagnosis of diabetes defined by FPG ≥126 mg/dL was 0.86 (Fig. 2). The sensitivity using the accepted HbA1c cutoff of ≥6.5% in all subjects was low at 0.431, whereas specificity was high at 0.992, with a positive predicted value (PPV) of 0.732 and a negative predicted value (NPV) of 0.973 (Table S2). This analysis employed FPG criteria, which would not identify individuals who were diagnosed with diabetes only by virtue of elevated 2-hr glucose during OGTT. In this regard, in patients with diabetes who had elevated 2-hr glucose ≥200 mg/dL but with FPG <126 mg/dL, the value of HbA1c as a diagnostic test was markedly diminished. The use of HbA1c≥6.5% for diabetes diagnosis (Fig. 2 and Table S3) had an extremely low sensitivity value of 0.055 (specificity 0.995) in identifying patients with diabetes who were diagnosed solely on the basis of elevated 2-hr glucose. We then assessed the ability of HbA1c to identify patients with diabetes who were diagnosed using combined FPG and 2-hr glucose criteria (Table S4). AUC for diabetes (FPG≥126 mg/dL and/or 2-hr glucose ≥200 mg/dL) was 0.81 in all participants (0.79 in men and 0.83 in women), declined with advancing age (P<0.001), and was reduced in non-Hispanic whites compared with non-Hispanic blacks (P=0.01). Using the HbA1c cutoff of ≥6.5%, the sensitivity and specificity were 0.249 and 0.995, respectively, with PPV of 0.819 and NPV 0.930. On the other hand, we also evaluated the ability of HbA1c to identify patients meeting both the FPG criteria and 2-hr glucose criteria for diabetes (Table S5), and observed that AUC (0.921), sensitivity (0.589), and specificity (0.960) were all somewhat improved.
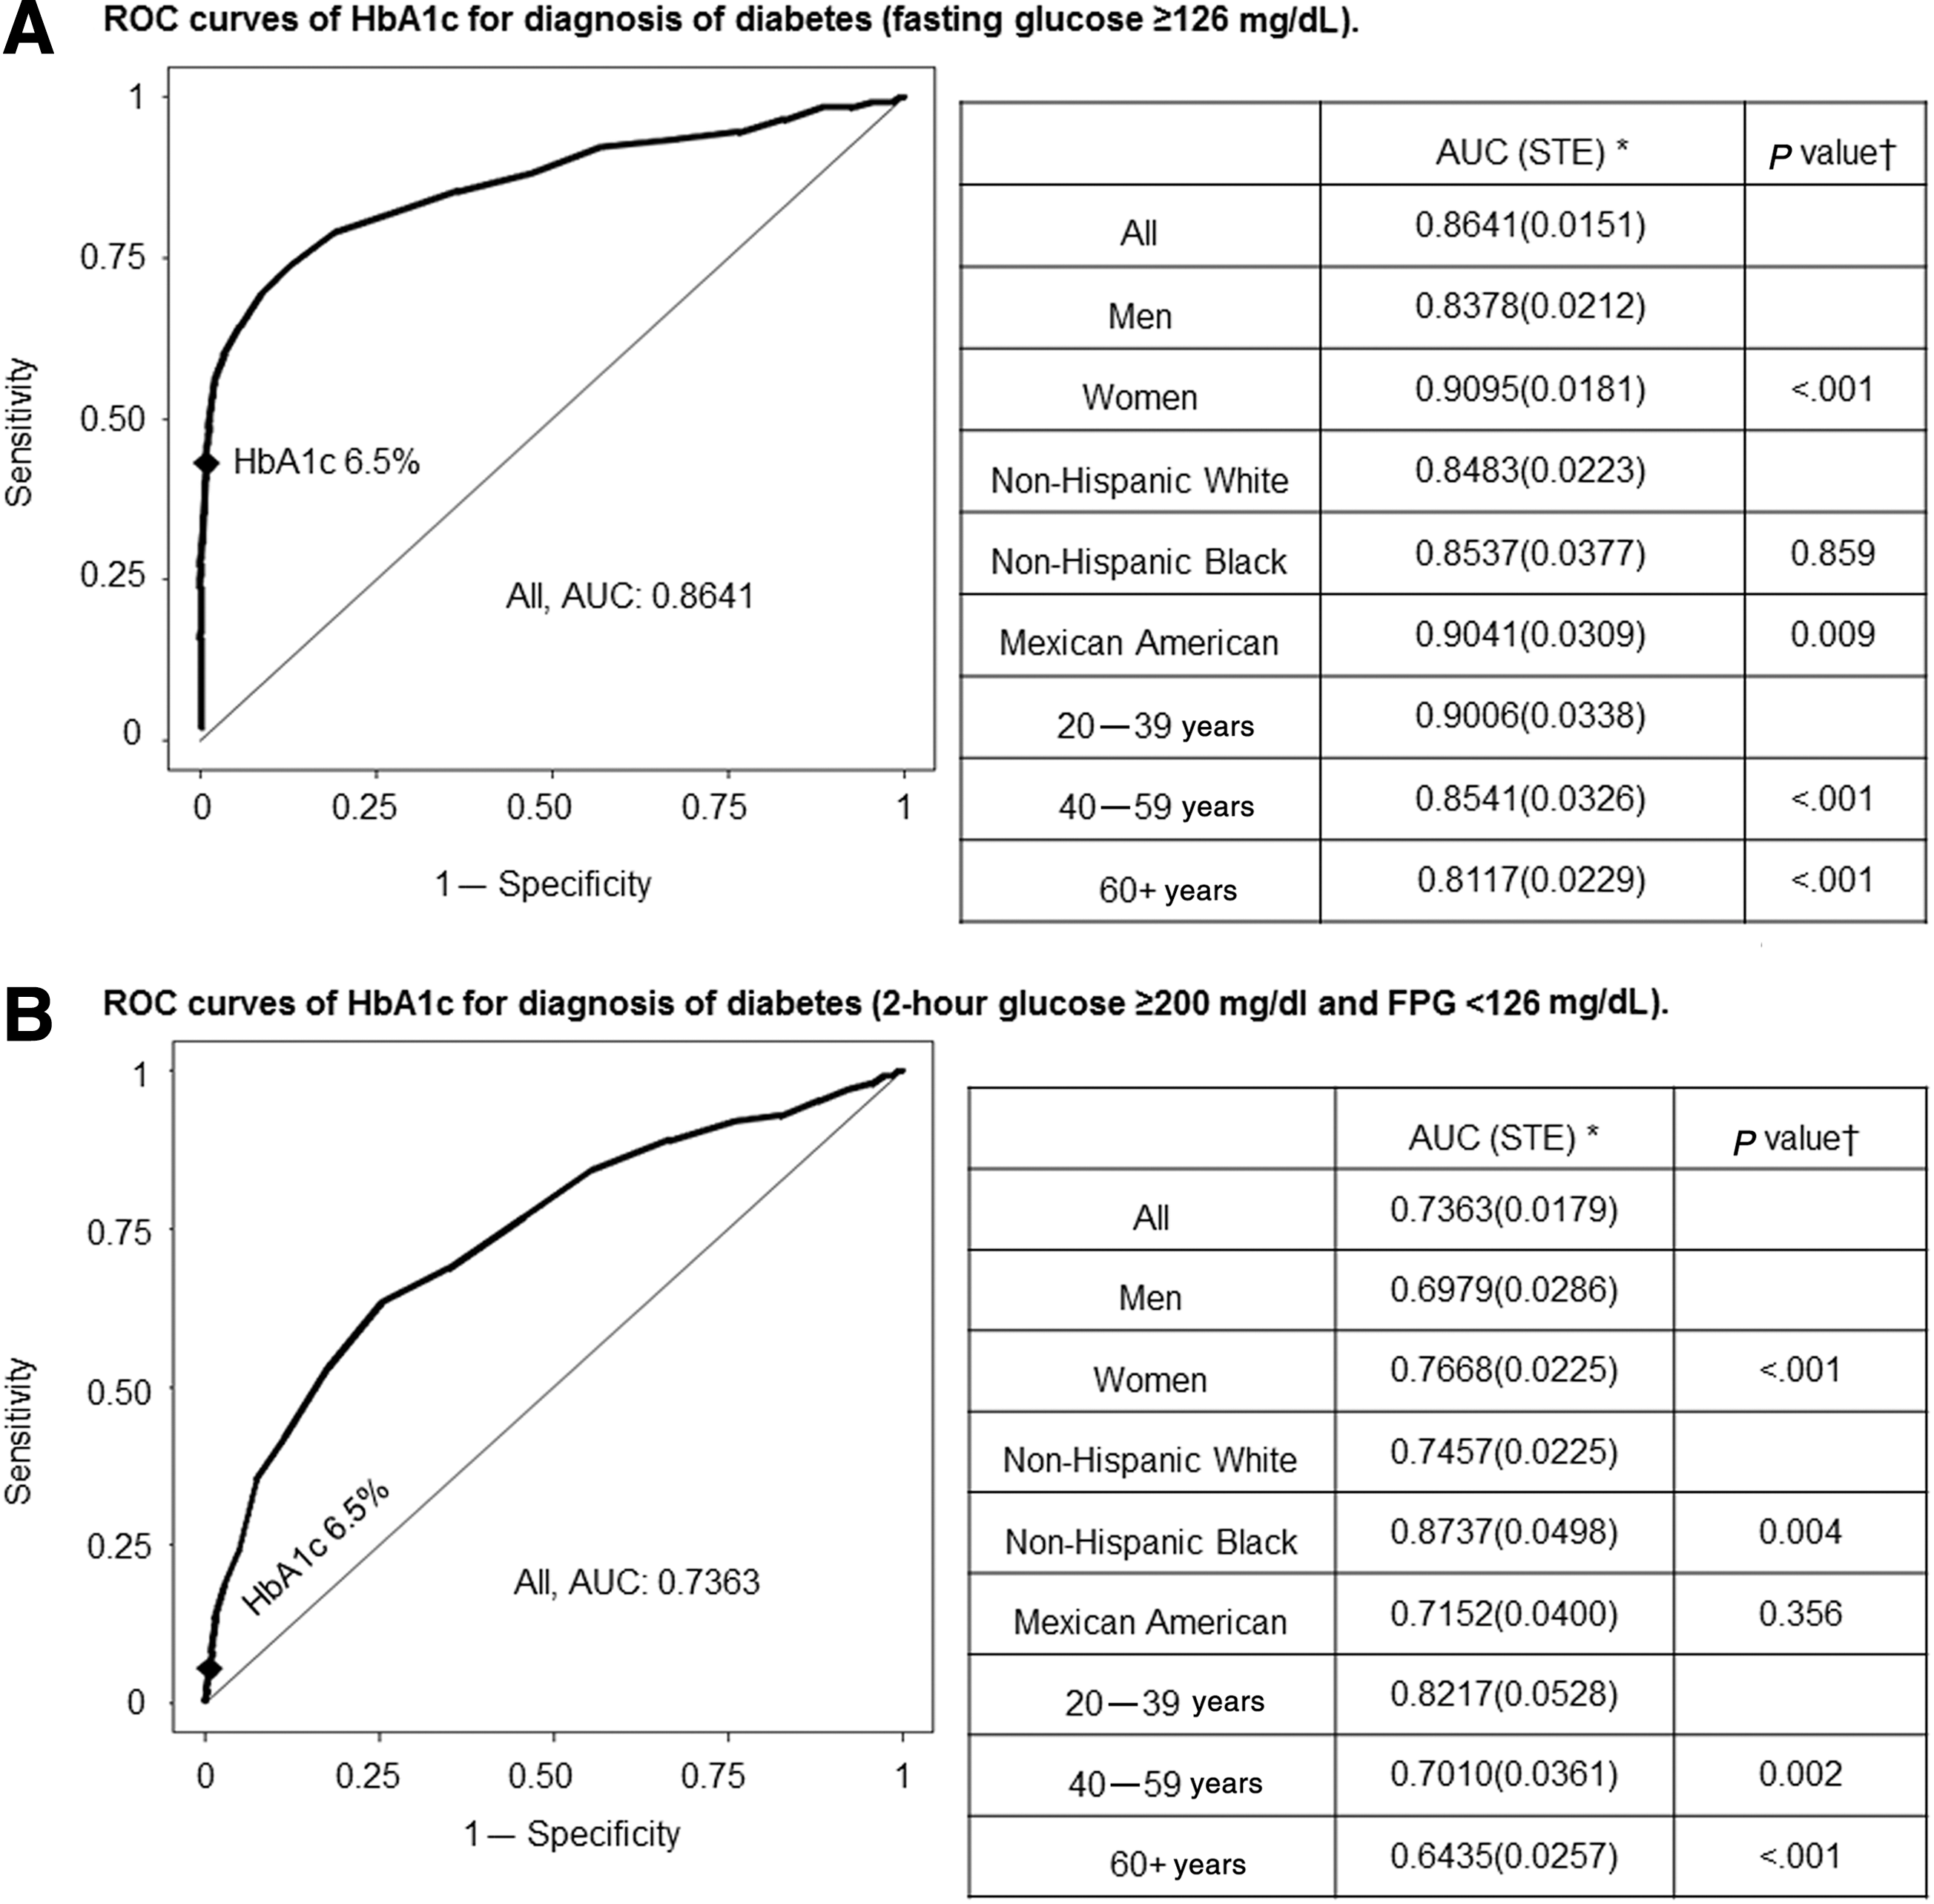
Receiver operating characteristics (ROC) curves of glycated hemoglobin (HbA1c) for diagnosis of diabetes.

Low sensitivity for HbA1c led to a marked underestimation in the prevalence rates for diabetes when compared to the prevalence rates established using FPG and 2-hr glucose (Tables 1 and 2) values. There were also significant effects of age and race on diabetes prevalence rates established using HbA1c compared with those using other glycemic measures. The relative degree of under-diagnosis using HbA1c instead of fasting and/or 2-hr glucose became greater with advancing age and was more marked in non-Hispanic whites and Mexican Americans that in non-Hispanic blacks. When compared with prevalence rates established using FPG, HbA1c≥6.5% underestimated the diabetes prevalence by 52% in non-Hispanic whites (4.8% versus 2.3%) and by 43% in Mexican Americans (5.3% versus 3.0%). When both FPG and 2-hr glucose values were available, use of HbA1c underestimated the diabetes prevalence by 77% in non-Hispanic whites (10.0% versus 2.3%) and by 70% in non-Hispanic blacks (9.9% versus 3.0%).
Note: Prevalence rates (%) are shown in shaded columns. The study population was comprised of adults without known diabetes at baseline drawn from NHANES population 2005–2010 with available measures of fasting plasma glucose (FPG), 2-hr glucose, and HbA1c. HbA1c criteria for diabetes (HbA1c>6.5%), and for prediabetes (5.7%≤HbA1c<6.5%).
Prevalence of true positive diagnosis.
HbA1c, glycated hemoglobin; OGTT, oral glucose tolerance test; FPG: fasting plasma glucose; FNR, false-negative rate=% of missed diagnoses of diabetes or prediabetes compared with referent population of patients diagnosed using both FPG and 2-hr glucose; FPR, false-positive rate=% of patients diagnosed to have diabetes or prediabetes by HbA1c but with normal glucose tolerance status by FPG and 2-hr glucose; DM, diabetes; Pre-DM, prediabetes; NHW, non-Hispanic white; NHB, non-Hispanic black; MEX, Mexican American.
Prevalence in adults without known diabetes.
HbA1c, glycated hemoglobin; FPG, fasting plasma glucose; NHW, non-Hispanic white; NHB, non-Hispanic black; MEX, Mexican American.
If the current cutoff of HbA1c for diabetes was lowered by 0.2% (6.5% to 6.3%) among non-Hispanic whites and Mexican Americans, the prevalence rates of diabetes would be similar to that using FPG criteria, with optimal sensitivity and specificity as indicated by the J value. This was the case in both genders and for all age groups. When stratified by age group (20–39 years, 40–59 year, and 60+years), lowering the current HbA1c cutoff for diabetes by 0.2% in non-Hispanic whites and Mexican Americans consistently provided comparable prevalence rates with FPG along with optimal sensitivity and specificity. However, because HbA1c exhibited poor sensitivity for identifying patients with 2-hr glucose≥200 mg/dL, HbA1c still underestimated the diabetes prevalence, even after lowering the cutoff to 6.3% in non-Hispanic whites and Mexican Americans, when compared with rates using FPG and/or 2-hr glucose for their diagnosis.
Prediabetes: sensitivity and specificity of diagnosis by HbA1c
We also examined the diagnostic value of HbA1c in patients with prediabetes. ROC curves are shown in Fig. 3A–C, and corresponding sensitivity and specificity values are listed in Tables S6–S8. When HbA1c (5.7%≤HbA1c<6.5%) was used to identify all prediabetic patients with impaired fasting glucose (IFG) (100 mg/dL≤FPG<126 mg/dL), the AUC value was 0.67 in all participants (Fig. 3A), which was lower than that observed for diabetes. The AUC was reduced in men (0.64) compared with women (0.70; P<0.001), and in the elderly compared with younger subjects (P<0.001), but was comparable across races. Among all participants, the ability of HbA1c to identify IFG using the cutoff of 5.7% was compromised by low sensitivity (0.383) whereas specificity was higher (0.834). For prediabetes patients with impaired glucose tolerance (IGT) alone (140 mg/dL≤2-hr glucose<200 mg/dL; FPG<100 mg/dL), the HbA1c AUC was very low (0.63), with diminished sensitivity (0.316) but higher specificity (0.855) using the HbA1c 5.7% cutoff. In patients with IFG and/or IGT, the HbA1c AUC was again low (0.67), with poor sensitivity (0.354), using the HbA1c cutoff of 5.7%. The overall prevalence of prediabetes was 43.8% for IFG, and 45.4% for IFG and/or IGT (Tables 1 and 3). The use of HbA1c≥5.7% for diagnosis of prediabetes failed to identify 42% of the patients with IFG and 50% of the patients with IFG and/or IGT, with an overdiagnosis in patients using IGT only (prevalence 16.3% by HbA1c and 10.7% by OGTT). The trends in these discrepancies between prevalence rates established using HbA1c versus glycemic measures applied to both genders and all racial and age subgroups. In non-Hispanic blacks, the prevalence rates for those with IFG and/or IGT were comparable whether established by glycemic measures or HbA1c≥5.7%, and the sensitivity and specificity were optimal at this HbA1c level. However, this did not apply to non-Hispanic whites and Mexican Americans where HbA1c≥5.7% had reduced prevalence rates for patients with IFG and/or IGT. If the current cutoff of HbA1c for prediabetes were lowered by 0.2% units (5.7% to 5.5%) among non-Hispanic whites and Mexican Americans, the prevalence rates of IFG would be similar to those using glucose criteria, with optimal sensitivity and specificity (i.e., J value). This was the case in both genders and all age groups.

Receiver operating characteristics (ROC) curves of glycated hemoglobin (HbA1c) for diagnosis of prediabetes.
Prevalence in adults without known diabetes.
HbA1c, glycated hemoglobin; FPG, fasting plasma glucose; NHW, non-Hispanic white; NHB, non-Hispanic black; MEX, Mexican American; IFG, impaired fasting glucose, 100≤fasting plasma glucose <126 mg/dL; IGT, impaired glucose tolerance, 140≤2-hr glucose <200 mg/dL; IFG+IGT, 100≤fasting plasma glucose <126 mg/dL, and/or 140≤2-hr glucose <200 mg/dL.
Discussion
To examine the performance of HbA1c as a diagnostic test for diabetes and prediabetes, we analyzed data from subjects who were enrolled in NHANES without known diabetes at the time of enrollment over the period of 2005–2010. Whereas many studies have examined the sensitivity and specificity of HbA1c for diabetes diagnosed by FPG, these data allowed us to address this issue using FPG as well as 2-hr glucose for diagnoses of both diabetes and prediabetes. Specifically, this study assessed relationships between HbA1c and FPG (>8 hr fasted) and 2-hr glucose levels across gender, race, and age groups, as well as ROC curves for the ability of HbA1c to identify patients with diabetes and prediabetes diagnosed by FPG and/or 2-hr glucose values.
Relationship between HbA1c and glucose values
Over the range of HbA1c values below 5%, HbA1c did not reflect glycemic differences and was not correlated with FPG or 2-hr glucose. For HbA1c between 5% and 8%, we found that HbA1c levels were strongly associated with FPG and 2-hr glucose. At given HbA1c levels, non-Hispanic blacks had much lower FPG and 2-hr glucose levels than non-Hispanic whites, and conversely, at given values for FPG or 2-hr glucose, non-Hispanic blacks had significantly higher HbA1c levels. These observations confirm previous reports of clear ethnic differences with higher HbA1c levels in blacks than whites at comparable levels of fasting glucose, 8,13,22 –24 and extend this observation to apply to 2-hr glucose levels as well.
ROC curves for HbA1c
Several studies have reported that current HbA1c cutoffs underdiagnose diabetes and prediabetes compared with FPG or 2-hr glucose criteria. 11,12,25 –29 Using data from NHANES 2005–2010, we observed that in our study population the area under the ROC curve for HbA1c to identify diabetes patients who were diagnosed using FPG≥126 mg/dL was 0.86, indicating that HbA1c is an acceptable test to identify diabetes with high specificity. However, the AUC was lower in males than females, decreased as a function of age, and was reduced in non-Hispanic whites compared with non-Hispanic blacks and Mexican Americans. Even so, in these stratified analyses, the AUC never fell below 0.80 in any subgroup of gender, race, or age. However, the HbA1c AUC was significantly reduced when 2-hr glucose values were also employed for diabetes diagnosis. HbA1c performed better in discriminating participants meeting both FPG and 2-hr glucose criteria for diabetes (FPG≥126 mg/dL and 2-hr glucose≥200 mg/dL), and the AUC, sensitivity, and specificity were improved compared to diabetes defined by FPG criteria and/or 2-hr glucose criteria (FPG≥126 mg/dL and/or 2-hr glucose ≥200 mg/dL). The AUC may have been improved if diabetes diagnosis required documentation of multiple elevated fasting glucose levels (i.e., ≥126 mg/dL) based on observations by Selvin et al., 26 who reported that AUC improved for diabetes defined by FPG ≥126 mg/dL on two separate occasions, 3 years apart, compared with diabetes defined by FPG ≥126 mg/dL at baseline.
At the currently recommended HbA1c cutoff of ≥6.5% for diabetes diagnosis, specificity remained above 0.99, and sensitivity was 0.431 for diabetes based on FPG≥126 mg/dL, 0.055 in those patients with diabetes based only on 2-hr glucose ≥200 mg/dL (but with FPG<126 mg/dL), and 0.249 when both FPG and 2-hr glucose were available to make the diagnosis. The low sensitivity led to substantial underdiagnosis of diabetes.
When HbA1c was applied to identify prediabetes, the HbA1c AUC for identifying prediabetes was 0.67 in patients with IFG, 0.63 in patients with IGT only, and 0.67 in patients with IFG and/or IGT. The sensitivity of the HbA1c criterion ≥5.7% remained below 0.4, and the sole application of HbA1c for diagnosis missed ∼40% of patients with IFG or IFG and/or IGT.
Prevalence and false-negative rates: clinical implications
Our current analyses confirmed the discrepancy in prevalence rates for diabetes and prediabetes whether diagnosed by glucose criteria or HbA1c criteria. 12,13 Although there are strong correlations between HbA1c levels and FPG or 2-hr glucose, the use of HbA1c for diagnosis of diabetes (≥6.5%) and prediabetes (≥5.7%) fails to identify a significant proportion of patients among those NHANES enrollees without known diabetes at baseline. The definitive diagnosis of diabetes is operationally based on the use of both FPG and 2-hr glucose values, based on levels that predict progression to glucose intolerance and development of vascular diabetes complications. When both FPG and 2-hr glucose are available, diagnosis by HbA1c alone has a false-negative rate of 75.1% and a false-positive rate of 0.6% for diabetes, and a false-negative rate of 64.9% and false-positive rate of 20.1% for prediabetes (Table 1).
One point of rationale that has been advanced to support the use of HbA1c for diagnosis is that this would improve rates of diagnoses when combined with FPG, with the realization that OGTTs and assessment of 2-hr glucose were more laborious and not being performed with adequate frequency. 6 Therefore, we analyzed the merits of diagnoses when both HbA1c and FPG were available. In comparison with true referent rates based on diagnoses using FPG and 2-hr glucose, the application of HbA1c and FPG led to a false-negative rate of 45.7% for diabetes. Again, misdiagnosis of diabetes increased with age and was more profound in non-Hispanic whites and Mexican Americans than in non-Hispanic blacks. Thus, the combined use of HbA1c and FPG missed the diagnosis of diabetes in almost half the patients in a population without known diabetes at the time of screening. The false-negative rate for prediabetes identified as IFG and/or IGT was 9.2%, and therefore less than that for diabetes.
In the current article, we have assessed the utility of HbA1c in identifying diabetes and prediabetes when the diagnosis is made on the basis of FPG and 2-hr glucose measurements. Although FPG and 2-hr glucose constitute the traditional bases for these diagnoses, this is not to say that they should be considered the gold standard approach. The International Expert Committee pointed out that the level of glycemia that confers increased risk of retinopathy could clearly be established at threshold measurements of FPG, 2-hr glucose, or HbA1c, leading to the conclusion that there is no gold standard as relates to the development of microvascular complications. 30 Nevertheless, we have shown that race significantly affects the relationship of HbA1c to the level of ambient glycemia, and, thus, it is important to understand this limitation in clinical and epidemiological applications of HbA1c measurements. Current guidelines by the American Diabetes Association (ADA) 31 for diagnosing diabetes or prediabetes recommend using any of values of fasting glucose, 2-hr glucose, or HbA1c.
On the basis of our results, many cases will be missed when using only one of these measurements. It is important to consider that HbA1c values below 6.5% and 5.7% do not reliably exclude the presence of diabetes and prediabetes, respectively. To achieve the goal of early diagnosis and management of diabetes, we should use combinations of the three measurements to screen for diabetes and prediabetes. Recently released joint guidelines by the European Society of Cardiology and the European Association for the Study of Diabetes urge health care providers to use HbA1c to diagnose diabetes and to conduct an oral glucose tolerance test if the disease was not diagnosed using HbA1c screening. 32
Our study supports this approach with one caveat; the current data indicate that many cases of diabetes will be missed using HbA1c alone and that follow-up FPG and 2-hr glucose measurements should be done routinely when the clinical index of suspicion is high in patients with HbA1c<6.5%. Some caution, however, should be exercised regarding prediabetes. The diagnosis of prediabetes as it reflects IFG or IGT rests with the measurements of FPG and 2-hr glucose, respectively, and both IFG and IGT are markers that confer high risks for the future development of diabetes that can be largely prevented by early interventions. 33 –37 In fact, guidelines for medical therapy of prediabetes established by the ADA 31 and the American Association of Clinical Endocrinologists 38 are based on the identification of IFG and IGT. Given the high proclivity for missed diagnoses of IFG and IGT, HbA1c should be used with caution when used in the diagnosis of prediabetes in this context.
Strengths of this study include a large nationally representative population (5395) of subjects with no known diabetes from NHANES 2005–2010, in whom FPG, HbA1c, as well as 2-hr glucose values were available. Extensive analyses were done to examine co-variables, including race/ethnicity and age. Clinical relevance was studied by examining all-cause and cardiovascular mortality in subjects with diabetes diagnosed by the different criteria. Our study extends previous studies by included a comparison of diagnosis by HbA1c to 2-hr glucose, in addition to the better-studied comparison to FPG.
This study also has some limitations. NHANES may have sampling and nonsampling errors as in other surveys. FPG and 2-hr glucose were not available on all participants, and the current study was confined to a subset of participants with available data for both FPG and 2-hr glucose in NHANES 2005–2010. We only have single measurements of FPG, 2-hr glucose, and HbA1c in NHANES. Generally, the glucose values used to diagnose diabetes are repeated before the diagnosis is confirmed because repeat determinations, rather than single measurements, are routine practice in clinical settings by health care providers for robust diagnosis, although clinical guidelines do not recommend repeated measurement for diagnosis of diabetes or prediabetes.
Conclusions
In the NHANES cohort enrollees without known diabetes, when compared with diagnoses based operationally on FPG and 2-hr glucose, the use of HbA1c for diagnoses was observed to have low sensitivity and high specificity for identification of patients with diabetes and prediabetes. When assessed against diagnostic rates using both FPG and 2-hr glucose, the utility of HbA1c varies as a function of age and racial group and results in many missed diagnoses when used as the sole diagnostic criterion. Regarding recently released guidelines for diagnosing diabetes and prediabetes that advocate the use of fasting glucose, 2-hr glucose, or HbA1c, it is important to consider that HbA1c values below 6.5% and 5.7% do not reliably exclude the presence of diabetes and prediabetes, respectively. Overall, the data argue for greater use of OGTTs and both FPG and 2-hr glucose values for diagnosis of diabetes and prediabetes.
Footnotes
Acknowledgment
We gratefully acknowledge our funding resources, including the Merit Review program of the Department of Veterans Affairs, National Institutes of Health (DK-038765 and DK-083562), and the UAB Diabetes Research Center (P30-DK079626). All data used in this study were collected by the National Center for Health Statistics Centers for Disease Control and Prevention.
Author Disclosure Statement
The findings and conclusions in this paper are those of the authors and do not necessarily represent the views of the National Center for Health Statistics, or the Centers for Disease Control and Prevention.
W.T.G. is an advisor for Alkermes, Plc., Daiichi-Sankyo, Inc., LipoScience, VIVUS, Inc., Janssen Pharmaceuticals, Bristol-Myers-Squibb/Astra Zeneca, Eisai, Boehringer-Ingelheim, and Novo Nordisk; is a speaker for Merck, Amylin, and Eisai; is a stockholder for Bristol-Myers Squibb Company, Isis/Genzyme, Merck, Pfizer, Inc., Eli Lilly and Company, and VIVUS, Inc,; and has received research support from Amylin Pharmaceuticals, Inc., Merck & Co., and Weight Watchers International, Inc. No competing financial interests exist for the other two authors, FG or DRM.
References
Supplementary Material
Please find the following supplemental material available below.
For Open Access articles published under a Creative Commons License, all supplemental material carries the same license as the article it is associated with.
For non-Open Access articles published, all supplemental material carries a non-exclusive license, and permission requests for re-use of supplemental material or any part of supplemental material shall be sent directly to the copyright owner as specified in the copyright notice associated with the article.