
Abstract
Background:
The activation of the renin–angiotensin system (RAS) has been related to various aspects of metabolic syndrome. The current study evaluated the effects of RAS blockers in a model of diet-induced insulin resistance (IR) and nonalcoholic fatty liver disease (NAFLD).
Methods:
Male C57BL/6 mice were fed a standard chow (SC; 10% lipids, n=15) diet or a high-fat (HF; 50% lipids, n=60) diet for 8 weeks and then treated with aliskiren (HF-A; 50 mg/kg per day, n=15), enalapril (HF-E; 30 mg/kg per day, n=15), or losartan (HF-L; 10 mg/kg per day, n=15) for an additional 6 weeks. We assessed glucose and lipid metabolism, hepatic histopathology, the expression profile of genes and proteins affecting hepatic gluconeogenesis, RAS and insulin signaling, and lipid beta-oxidation and accumulation. The differences between the groups were tested via analysis of variance (ANOVA) and the post hoc Holm–Sidak test.
Results:
All treatments restored the up-regulation of hepatic RAS. The enalapril treatment, but not aliskiren or losartan, was effective in improving leptin, glucose intolerance, IR, hepatic steatosis, and triglycerides and in preventing increased hepatic protein levels of phosphoenolpyruvate carboxykinase (PEPCK), glucose 6-phosphatase (G6Pase), and glucose transporter-2 (GLUT-2). Furthermore, enalapril improved the response to the deleterious effects of the HF diet by upregulating signal transduction through the insulin receptor substrate (IRS) 1/protein kinase B (Akt) pathway, as well as downregulating the protein levels and mRNA expression of peroxisome proliferator-activated receptor-γ (PPARγ), sterol regulatory element-binding protein-1c (SREBP-1c), and fatty acid synthase (FAS).
Conclusions:
Enalapril was the most successful treatment in protecting against hepatic IR and NAFLD by enhancing hepatic insulin action, leptin, and gluconeogenesis and by reducing the lipogenic pathway and lipid accumulation in the liver.
Introduction
M
IR is characterized by the inability of insulin to inhibit hepatic gluconeogenesis by suppressing unidirectional enzymes, namely, phosphoenolpyruvate carboxykinase (PEPCK) and glucose 6-phosphatase (G6Pase). The overexpression of these enzymes could lead to hyperglycemia and hyperinsulinemia, which are key drivers of T2DM. 4 These effects are also associated with impaired insulin action, primarily the insulin receptor substrate (IRS)/protein kinase B (Akt) pathway in the liver. 5
The effect of insulin on liver lipogenesis is mediated through the sterol regulatory element-binding protein-1c (SREBP-1c), which activates key lipogenic enzymes [acetyl-CoA carboxylase (ACC) and fatty acid synthase (FAS)]. 6 In a state of IR, the SREBP-1c is upregulated, thereby promoting de novo lipogenesis and fat accumulation. 3,7 This condition involves peroxisome proliferator-activated receptors (PPAR), which have been identified as lipid and glucose metabolism sensors. 8 PPARα plays a role in controlling the expression of genes such as carnitine palmitoyltransferase-1 (CPT-1), which is involved in mitochondrial beta-oxidation. 9 In contrast, PPARγ activates hepatic lipogenesis pathways and promotes lipid accumulation in hepatocytes. 7
Very few drugs exert effective therapeutic benefits in hepatic IR and NAFLD. However, the identification of an activated renin–angiotensin system (RAS) as a common factor contributing to several disorders of the metabolic syndrome makes the use of the RAS blockers an option through their pleiotropic effects. 10,11 RAS blockers include inhibitors of plasma renin activity that decrease the production of all angiotensin (Ang) derivatives from renin as the initial limiting step in Ang II synthesis; angiotensin-converting enzyme (ACE) inhibitors block the conversion of Ang I to the active peptide Ang II and increase the availability of bradykinin. Ang receptor blockers selectively antagonize type 1 receptors [angiotensin II type 1 receptor (AT1R)]. 11,12
Additionally, the liver is the primary site for the synthesis of circulating angiotensinogen (AGT), and there is evidence for a local RAS within the liver, as in other tissues. 13 Clinical and experimental evidence suggests that the increased activation of both systemic and local RAS is also implicated in liver disease. 14,15 We aimed to compare the effects of inhibiting different components of RAS—renin (aliskiren), ACE (enalapril), and AT1R (losartan) in a mouse model of NAFLD and IR.
Methods
Animals
The local committee for animal experimentation at the State University of Rio de Janeiro approved the experimental protocols. The procedures were performed in accordance with the conventional guidelines for animal experimentation (National Institutes of Health Publication no. 85-23, revised 1996). The animals were housed in a room with controlled temperature and dark–light cycles.
Twelve-week-old male C57BL/6 mice were randomly divided into two nutritional groups and fed for 8 weeks. The two groups differed in diet; there was a standard chow diet group (SC; 10% of energy derived from fats, n=15) and a high-fat diet group (HF; with 50% of energy derived from fats, n=60). The diets were manufactured in accordance with the recommendations of the American Institute of Nutrition (AIN-93M). 16
After the obesity induction period (8 weeks), the HF mice were randomly subdivided into five groups (n=15 each group) for a treatment period of 6 weeks. The drug-treated groups continued to have free access to the HF diet during the entire treatment period (14 weeks). The drugs were mixed into the chow. The five groups were formed as follows: (1) SC, standard chow group; (2) HF, untreated high-fat group; (3) HF-A, HF treated with aliskiren (50 mg/kg per day; Rasilez, Novartis); (4) HF-E, HF treated with enalapril (30 mg/kg per day; Renitec, Merck) (5) HF-L, HF treated with losartan (10 mg/kg per day; Cozaar, Merck).
Metabolic measurements
An oral glucose tolerance test (OGTT) and intraperitoneal insulin tolerance test (IPITT) were performed at the end of the treatment period. The OGTT was conducted by administering a solution of 1.0 gram of glucose/kg via orogastric gavage after 6 hr of starvation. For the IPITT, the mice were starved for 4 hr and then injected intraperitoneally with insulin (0.5 UI/kg). In both cases, blood samples were collected from the tail vein at 0, 15, 30, 60, and 120 min for the determination of glucose levels (Accu-Chek glucometer, Roche). We studied the area under the curve (AUC, in arbitrary units, a.u.) of glucose from 0 to 120 min (GraphPad Prism, CA).
Tissue extraction and biochemistry
The mice were killed after 6 hr of starvation. The blood was collected, and the liver was removed. Several liver fragments from 5 mice per group were fixed in a solution of formaldehyde for 48 hr. The livers of the other mice in the group were snap-frozen and stored at −80°C until gene (n=5) and protein expression (n=5) analyses, as well as the measurement of hepatic triacylglycerol (TAG) levels. The TAG analysis was performed using a colorimetric enzymatic assay kit and measured with an automated spectrophotometer (Bioclin System, MG, Brazil). 17
The fasting plasma was obtained via centrifugation and was used to measure glucose, insulin, glucagon, and leptin levels via a Milliplex mouse metabolic hormone kit, NMHMAG-44K, with Luminex xMAP equipment (Millipore, MA).
Liver histopathology
The formalin-fixed liver was embedded in Paraplast, and 5-μm-thick sections were stained with Hematoxylin & Eosin. Digital images were acquired at random (Leica microscope, Wetzlar, Germany). Fifteen digital images per animal were studied to assess the volume density of liver steatosis by point counting, as previously described. 17
Western blot
The total hepatic proteins were extracted in a homogenizing buffer with protease and phosphatase inhibitors. The proteins were separated using gel electrophoresis, transferred to a nitrocellulose membrane, blocked at room temperature for 2 hr, and then incubated overnight at 4°C with the primary antibodies PEPCK, G6Pase, GLUT2, IRS-1, total Akt, p-AktSer 473, PPARα, SREBP-1c, AGT, ACE, and AT1R. Following incubation with the primary antibody, the blots were incubated with secondary antibodies for 1 hr and then incubated with ECL Western Blotting Detection reagents. Images of the blots were obtained using Bio-Rad's Molecular Imaging ChemiDoc-Systems (Bio-Rad, CA). The blots were stripped and reprobed for β-actin as a loading control for proteins. The Akt phosphorylation levels were normalized to the total Akt.
Real-time reverse-transcriptase polymerase chain reaction
The total RNA was extracted from the liver using TRIzol reagent (Invitrogen, CA). The total RNA was treated with DNase amplification, and the first-strand complementary DNA was synthesized using oligo primers and Superscript-III RT (Invitrogen, CA). Real-time PCR was performed using a Bio-Rad CFX96 cycler and the SYBR Green mix (Invitrogen, CA). The expression of TATA-box–binding protein (TBP) was quantified for all samples via real-time reverse-transcriptase polymerase chain reaction (RT-qPCR) and used for RNA normalization. The relative expression ratio of the mRNA was calculated using the equation 2−ΔΔCt, in which −ΔCT expresses the difference between the number of cycles (CT) of the target genes and the endogenous control. The primers are presented in Table 1.
PPAR, peroxisome proliferator-activated receptor-α and –γ; CPT-1, carnitine palmitoyl-transferase; SREBP-1c, sterol regulatory element-binding protein; FAS, fatty acid synthase; ACE, angiotensin-converting enzyme; AT1R, angiotensin II type 1 receptor; TBP, TATA box–binding protein.
Data analysis
The GraphPad Prism program (La Jolla, CA) was used for statistical analyses. The differences between the groups were assessed using a one-way analysis of variance (ANOVA), followed by the Holm–Sidak post hoc test. A P value ≤0.05 was considered statistically significant.
Results
ACE inhibitor improves leptin and the glucose profile
The AUC values for the plasma glucose levels during the OGTT were significantly increased in the HF (+24%, P<0.01), HF-A (+17%, P<0.05), and HF-L (+19%, P<0.05) groups compared with the control group (Table 2). Additionally, these animals showed hyperglycemia in relation to the SC animals (HF+34%, P<0.001; HF-A+22%, P<0.05; HF-L+21%, P<0.05). The treatment with enalapril ameliorated glucose intolerance, as well as the lower fasting plasma glucose levels compared to those of HF diet-fed mice (−17%, P<0.01; −21%, P<0.001, respectively).
Groups: SC, standard chow; HF, high-fat diet; HF-A, HF treated with aliskiren; HF-E, HF treated with enalapril; HF-L, HF treated with losartan.
Values represent mean±standard error of the mean (SEM), n=8 per group. One-way analysis of variance (ANOVA) and post hoc Holm–Sidak test, P<0.05, when compared with the SC group [a], HF group [b], HF-A group [c], and with the HF-E group [d].
OGTT, oral glucose tolerance test; IPITT, intraperitoneal insulin tolerance test.
In IPITT, the HF (+33%, P<0.01), HF-A (+23%, P<0.05), and HF-L (+21%, P<0.05) mice showed a significant increase in AUC values compared with the SC mice (Table 2). However, the HF-E group showed an AUC lower than that of the HF group (−21%, P<0.01).
The HF (+102%, P<0.0001), HF-A (+56%, P<0.05), and HF-L (+74%, P<0.01) groups showed hyperinsulinemia (in contrast to the SC group). Interestingly, the HF-E mice had lower fasting plasma insulin levels (−30%, P<0.05) than the HF mice (Table 2).
Furthermore, the fasting plasma glucagon levels were higher in the HF (+126%; P<0.001), HF-A (+75%; P<0.05), and HF-L (+108%; P<0.01) mice compared with the SC mice (Table 2). The glucagon in the HF-E group was less elevated than that in the HF group (−43%; P<0.05).
The insulin-to-glucagon ratio was lower in the HF (−29%; P<0.05), HF-A (−28%; P<0.05), and HF-L (−31%; P<0.05) groups than in the SC group, the hepatic glucose output of which is activated by a low insulin to glucagon ratio. Furthermore, this ratio was similar between the HF-E and SC groups (Table 2).
Compared with the SC group, the fasting plasma leptin levels were higher in the following groups: HF (+298%, P<0.001), HF-A (+277%, P<0.01), and HF-L (+259%, P<0.01). Enalapril treatment was able to significantly decrease leptin levels compared to the HF group (−82%, P<0.001; Table 2).
Enalapril ameliorates steatosis and liver lipid accumulation in the HF diet-fed mice
Mild to moderate steatosis was a common finding in all of the groups fed the HF diet (Fig. 1). This accumulation was greater in the HF (+272%), HF-A (+220%), and HF-L groups (+200%) than in the SC group (P<0.0001; Table 2). Only the enalapril treatment returned the liver steatosis levels to levels similar to those of the SC group (Fig. 1), which were 60% less than the levels of the HF group (P<0.0001; Table 2).
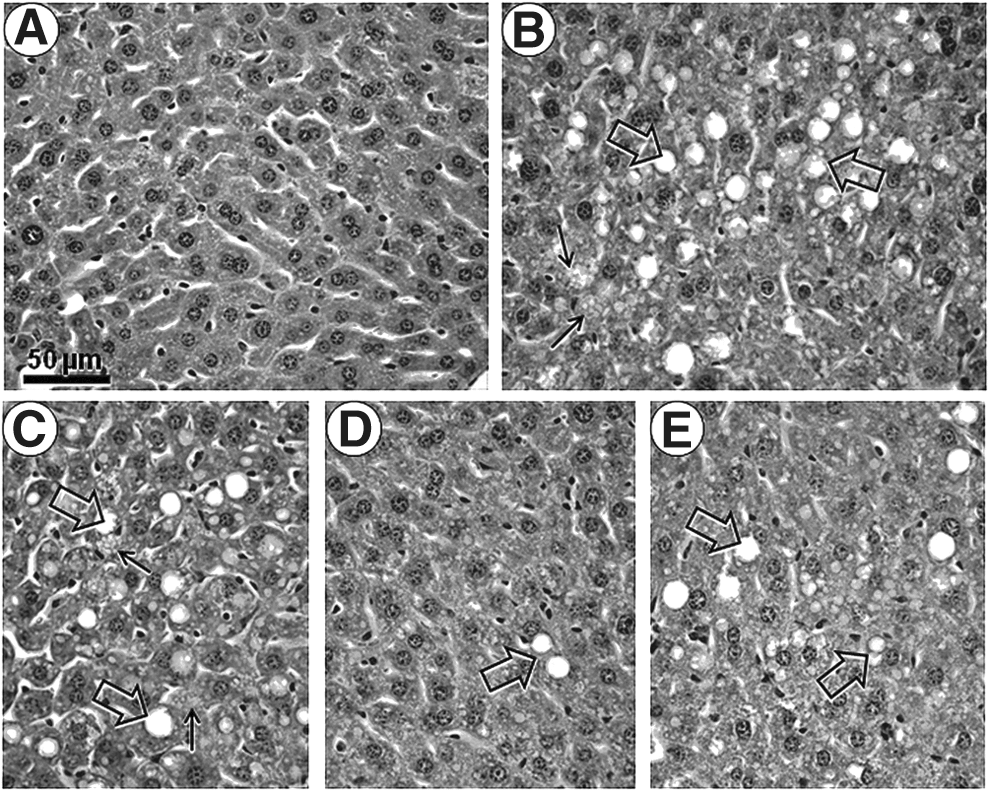
Photomicrographs of liver structure. Representative liver tissue sections were stained with Hematoxylin & Eosin. All photomicrographs have the same magnification. Bar, 50 μm.
The amount of TAG was increased by 57% in the HF (P<0.01), 64% in the HF-A (P<0.01), and 44% in the HF-L (P<0.05) groups compared with the SC group (Table 2). In contrast, treatment with enalapril significantly improved the hepatic TAG (−36% vs. HF group, P<0.01).
Western blot analyses
RAS blockers modulate local RAS components in the liver
As shown in Fig. 2, A and B, all groups fed the HF diet, including the treated groups, significantly increased the protein expression of AGT compared with the SC mice (>+ 70%, P<0.05, in all cases).

Protein level of hepatic renin–angiotensin system (RAS). Western blotting analysis illustration
ACE protein expression was upregulated in the untreated HF (+132%), HF-E (+127%), and HF-L (+128%) groups compared with the SC group (P<0.05 in all cases; Fig. 2A, C). Because the aliskiren treatment inhibits plasma renin activity, the ACE protein expression was lower in the HF-A group (−51%, P<0.05) compared with the HF group.
Western analysis revealed high levels of the AT1R protein in the untreated HF livers; the AT1R protein was 84% higher in the untreated HF livers than in the SC livers (P<0.05; Fig. 2A, D). The expression of AT1R protein in the treatment groups was similar to that of the SC group and different from that of the HF group (P<0.05, HF vs. HF-E; P<0.01, HF vs. HF-L).
ACE inhibitor attenuates an increased gluconeogenesis pathway
The protein level of PEPCK was greater in the HF (+68%, P<0.0001), HF-A (+44%, P<0.05), and HF-L (+51%, P<0.05) groups than in the SC group (Fig. 3A, B). Additionally, the G6Pase (Fig. 3A, C) and GLUT2 (Fig. 3A, D) expression levels were increased in the HF-fed mice compared with SC-fed mice (+46% and +24%, respectively, P<0.01). The PEPCK, G6Pase, and GLUT2 protein levels were similar among the HF-E and the SC groups (Fig. 3), but were all lower than in the HF group (−47%, P<0.0001; −34%, P<0.01; and −22%, P<0.01, respectively).
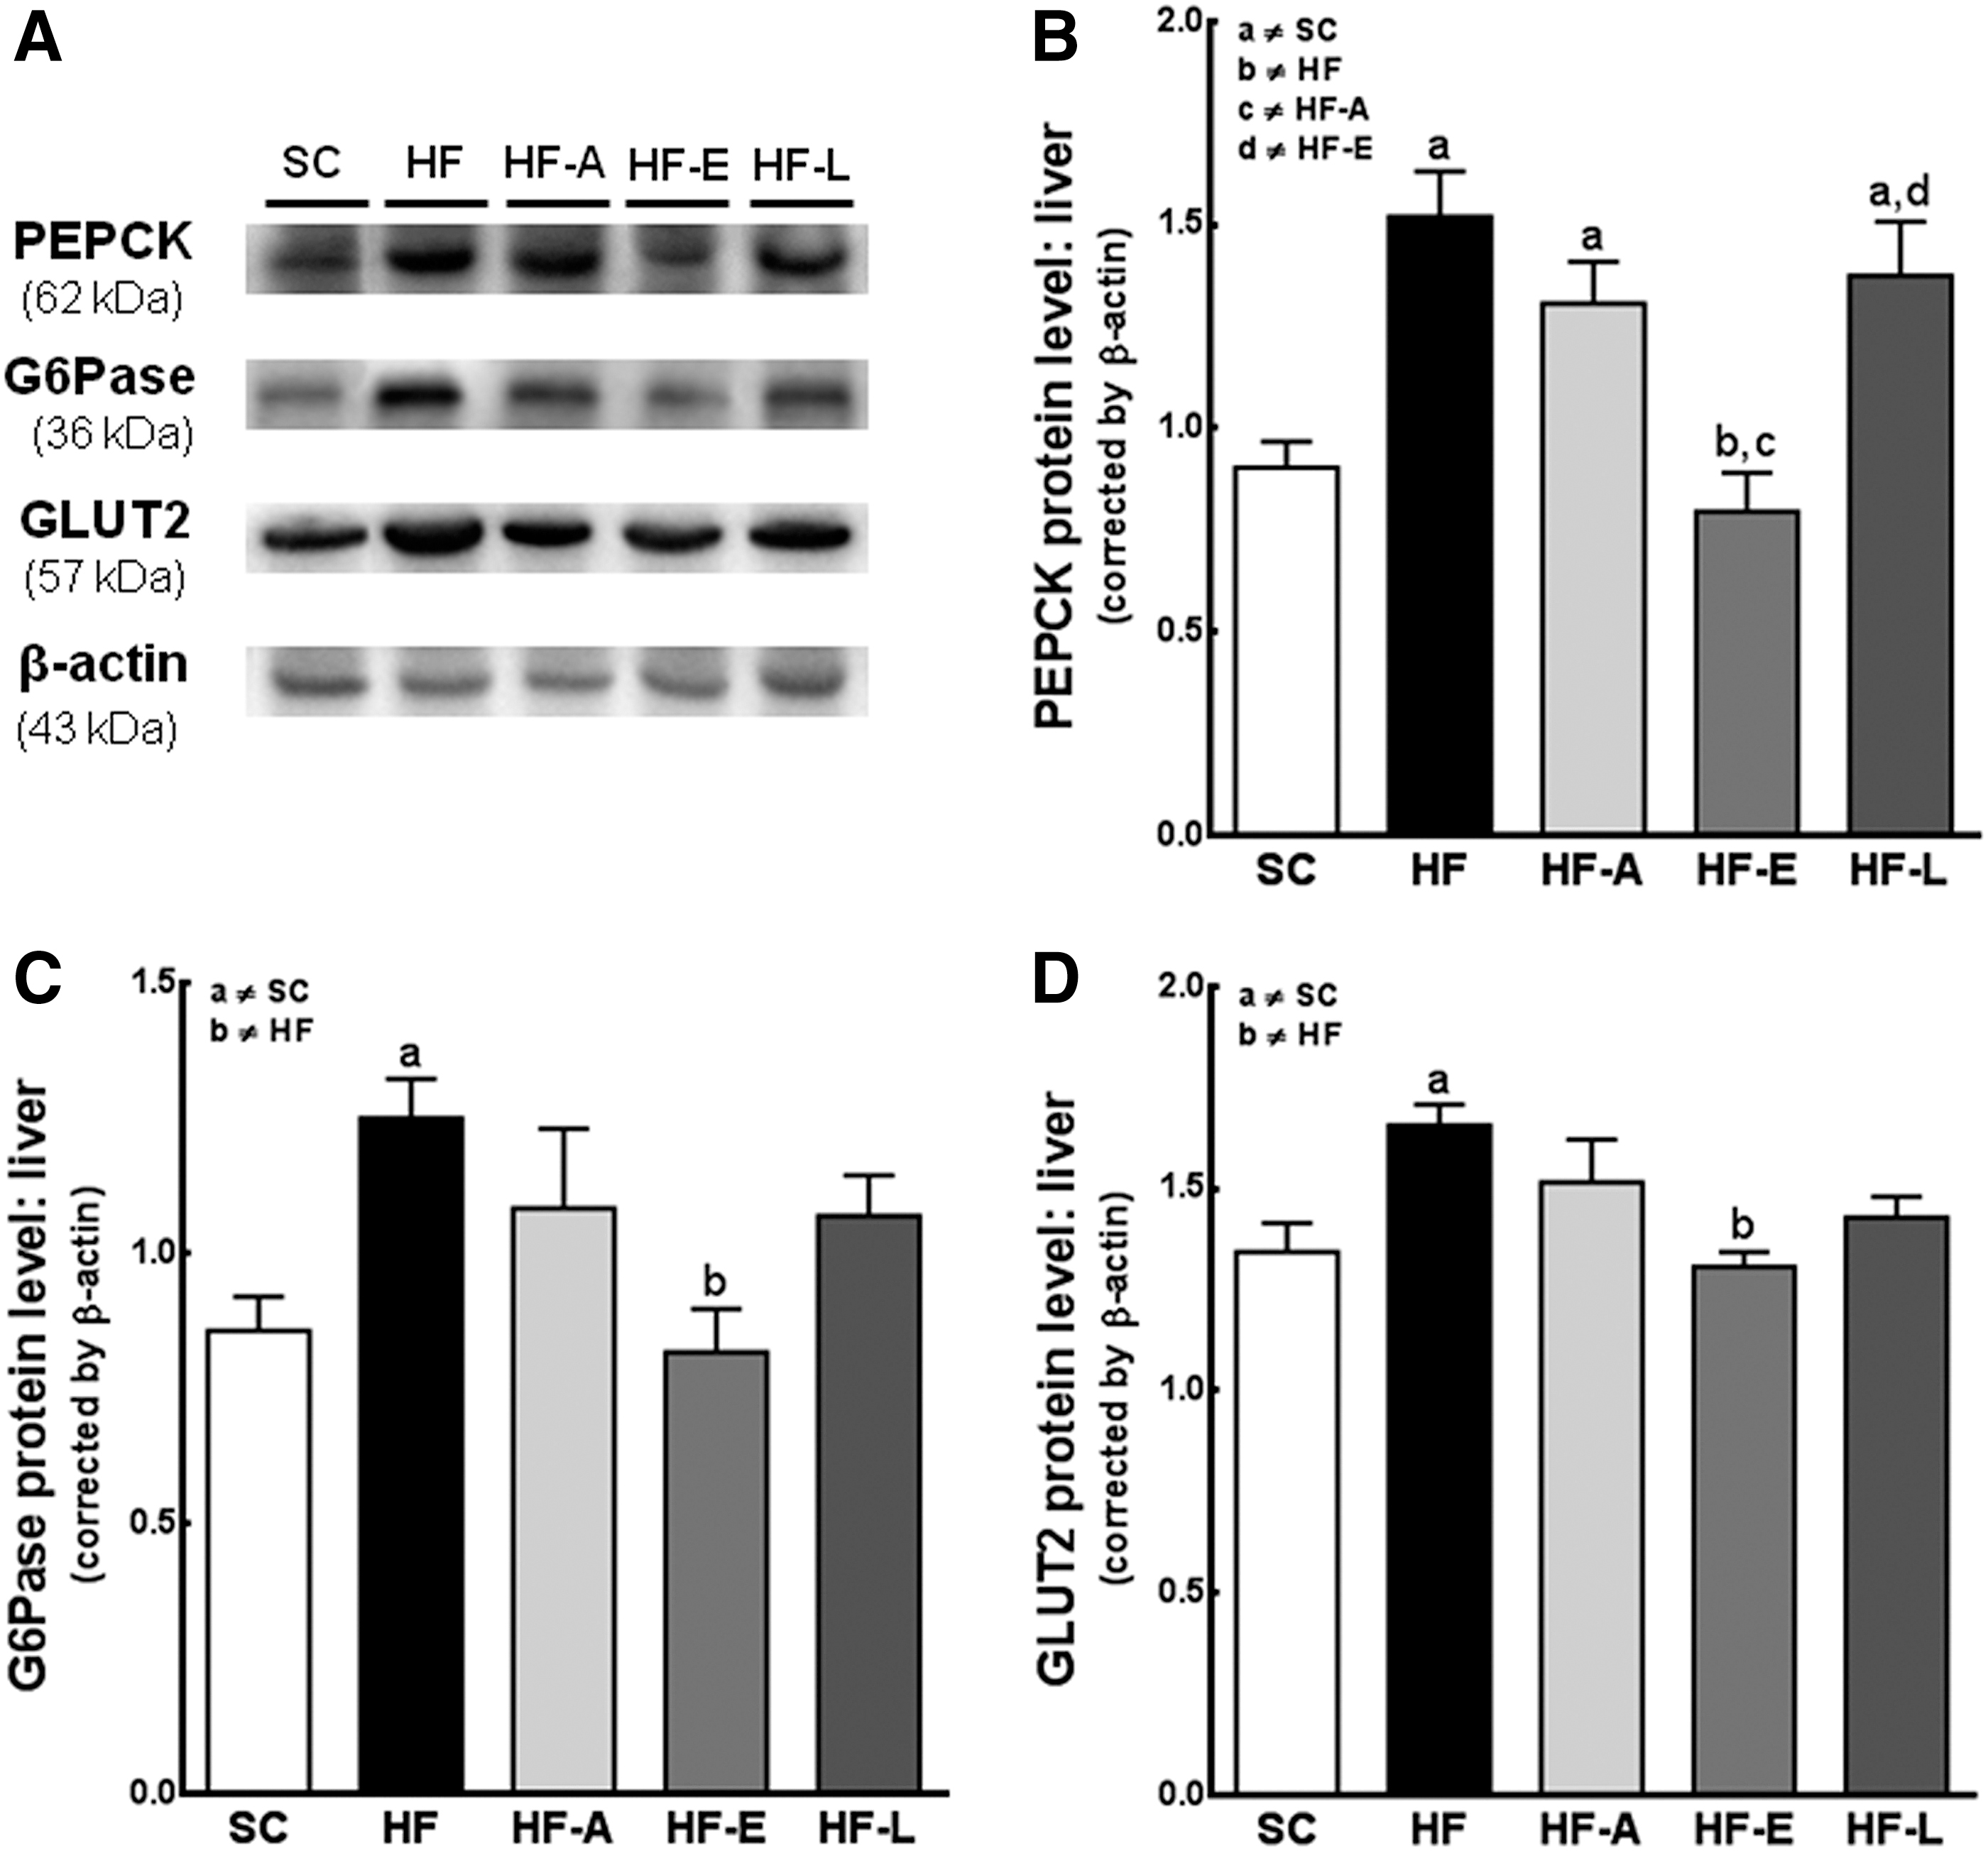
Hepatic glucose output. Representative blots in the liver for gluconeogenesis pathway expression
The SC and HF-E groups have similar insulin signaling pathways
We did not find any differences in the levels of IRS-1 or total Akt between the groups (Fig. 4A–C). The level of p-AktSer473 was lower in the HF (−25%), HF-A (−22%), and HF-L (−25%) groups compared with the SC group (P<0.01, in all cases), but not different between the HF-E and SC groups (Fig. 4A, D).

Insulin signaling pathway. Western blotting analysis illustration
RAS blockers do not affect beta-oxidation but do reduce the lipogenic pathway
The HF diet reduced the levels of PPARα in the untreated HF (−34%), HF-A (−37%), and HF-L (−32%) groups (P<0.05) compared with the control group, whereas the HF-E diet increased the PPARα levels to values similar to those of the controls (Fig. 5A, B). In contrast, the SREBP-1c expression was higher in the HF mice than in the SC mice (+66%, P<0.05) and the HF-E mice (+57%, P<0.05; Fig. 5A, C). The HF-A and HF-L groups had a reduced PPARα to SREBP-1c protein expression ratio, a result similar to that of the HF group (Fig. 5D). All ratios were lower than that of the SC group (P<0.001). Only treatment with enalapril reversed this dysregulation (P<0.001 vs. HF group; Fig. 5D).
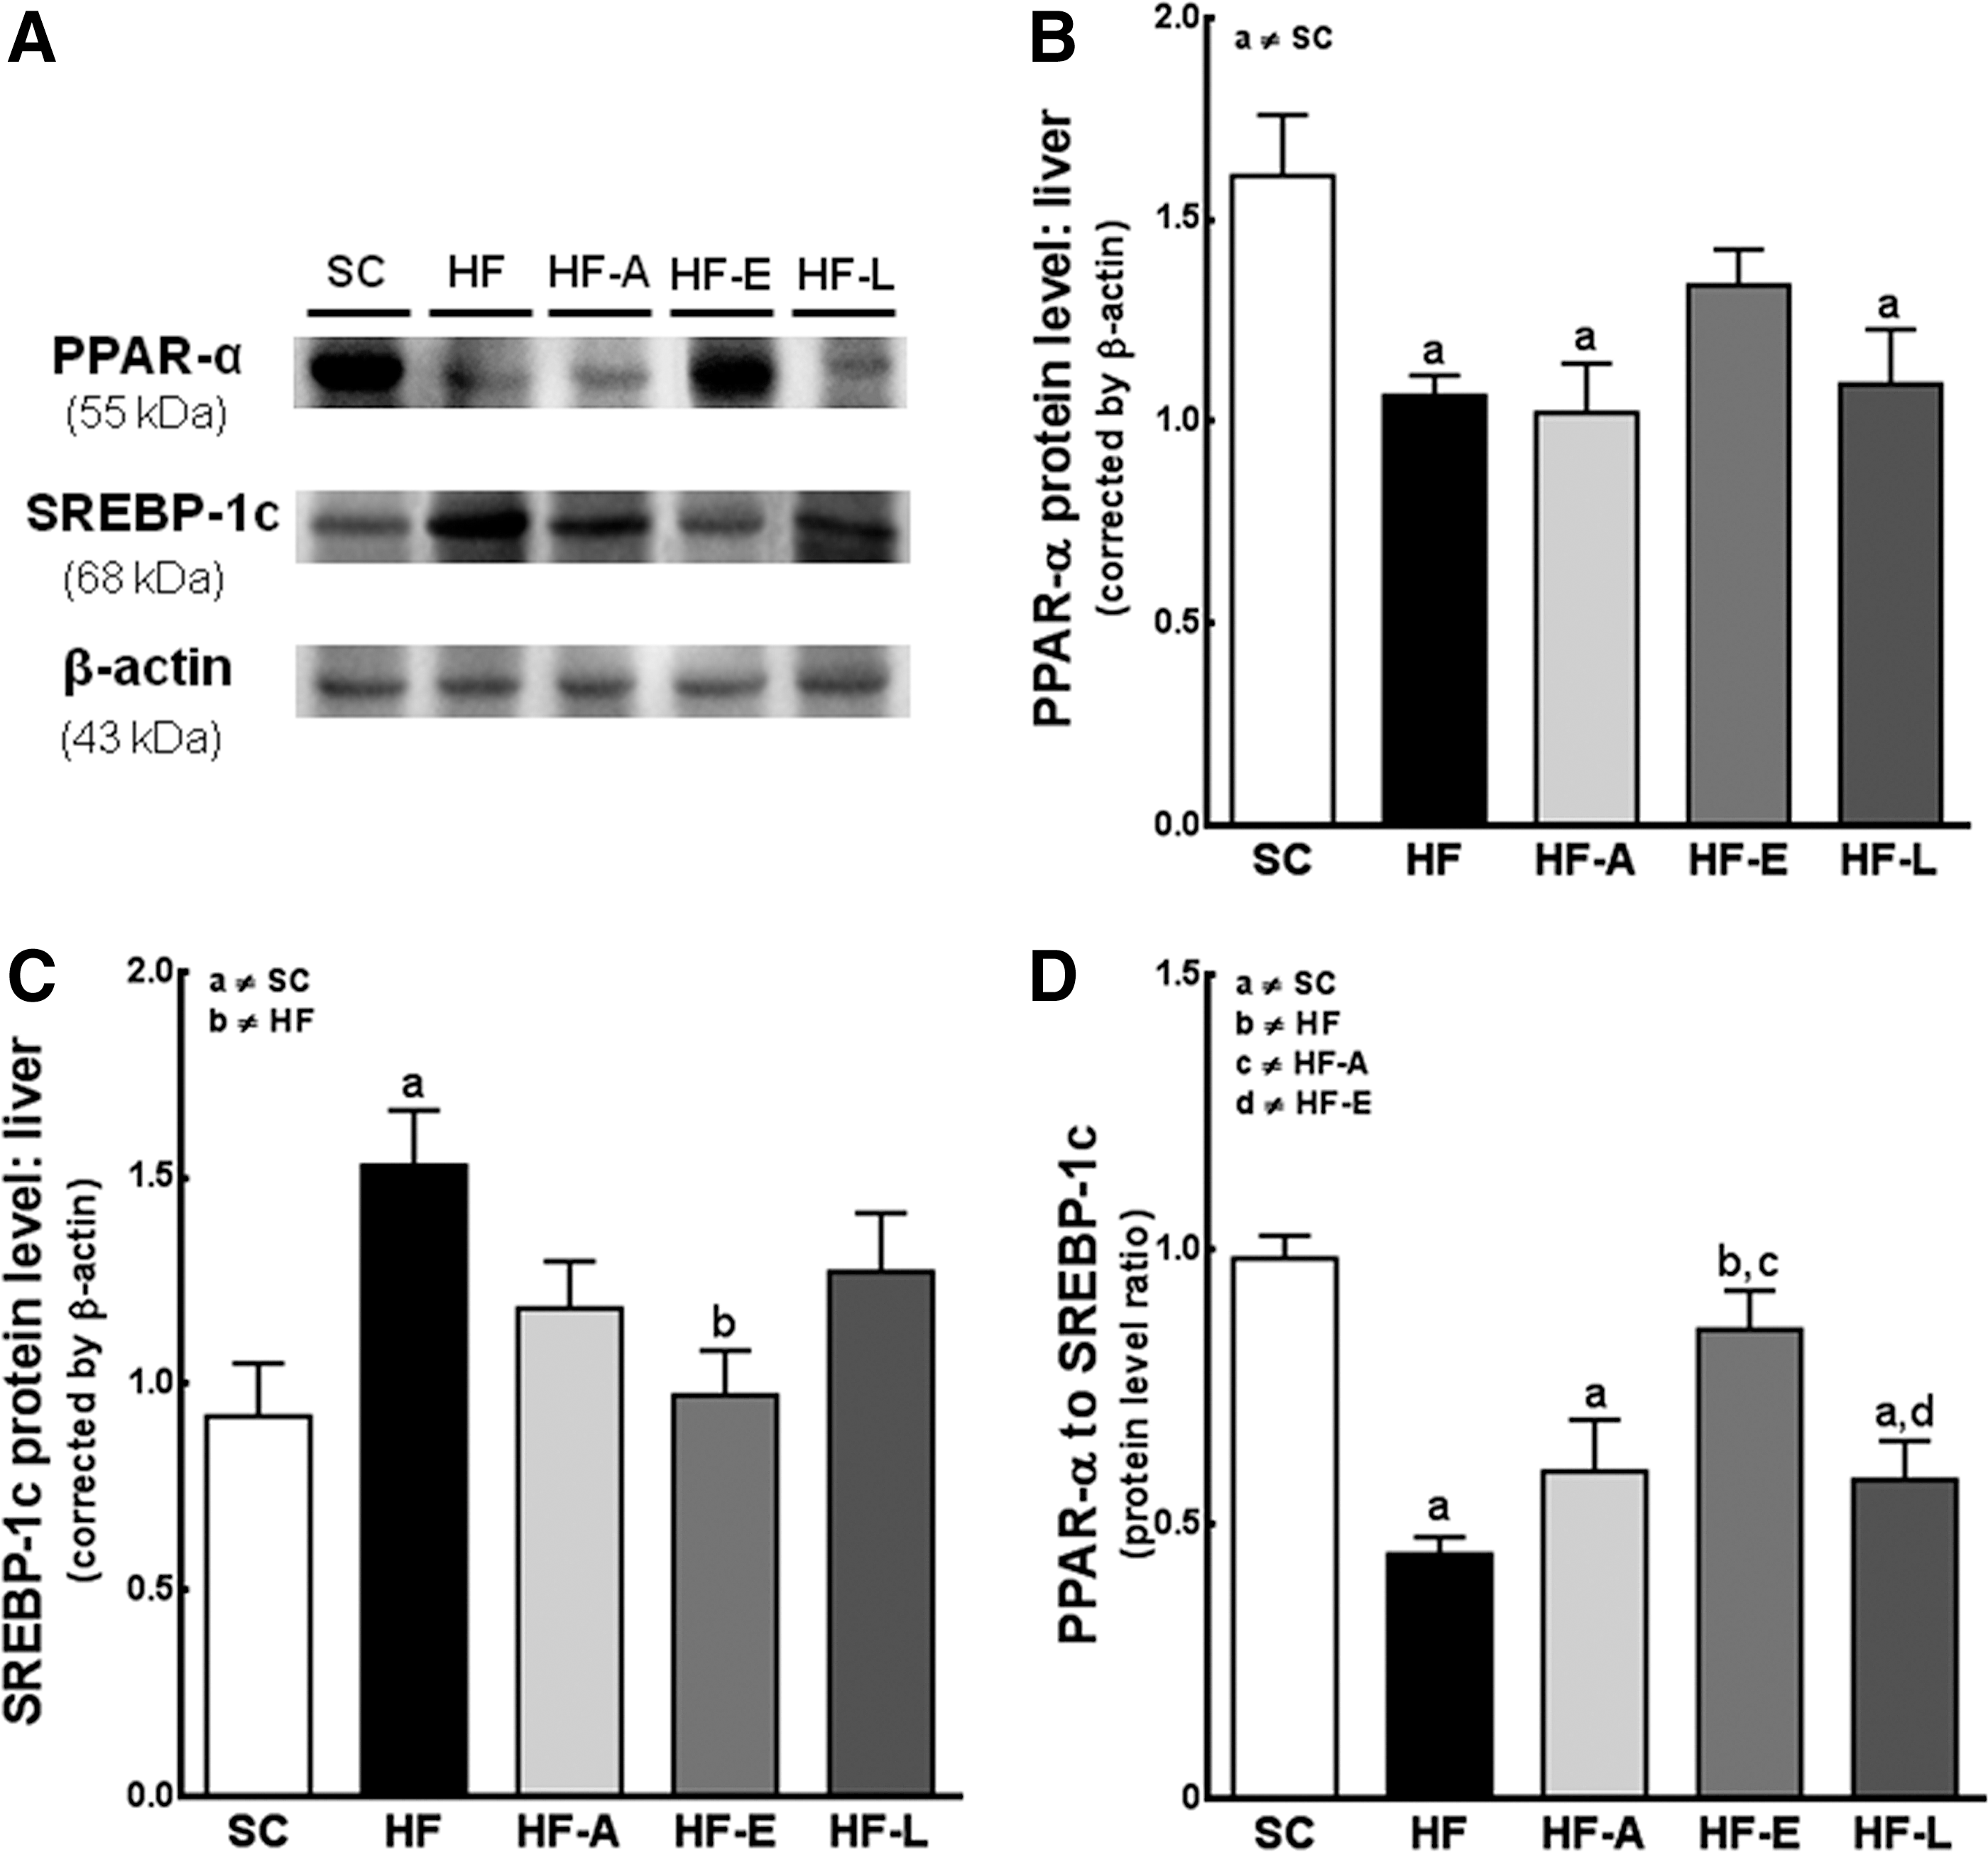
Beta-oxidation and lipogenic pathways. Western blotting analysis
A HF diet up-regulates the mRNA expression of hepatic RAS, impairs beta-oxidation, and increases the lipogenesis mRNA expression
Although the expression of the renin gene was detected in the liver, this expression was low, with the PCR product detectable only after approximately 36 cycles; this change was not statistically significant (Fig. 6A).
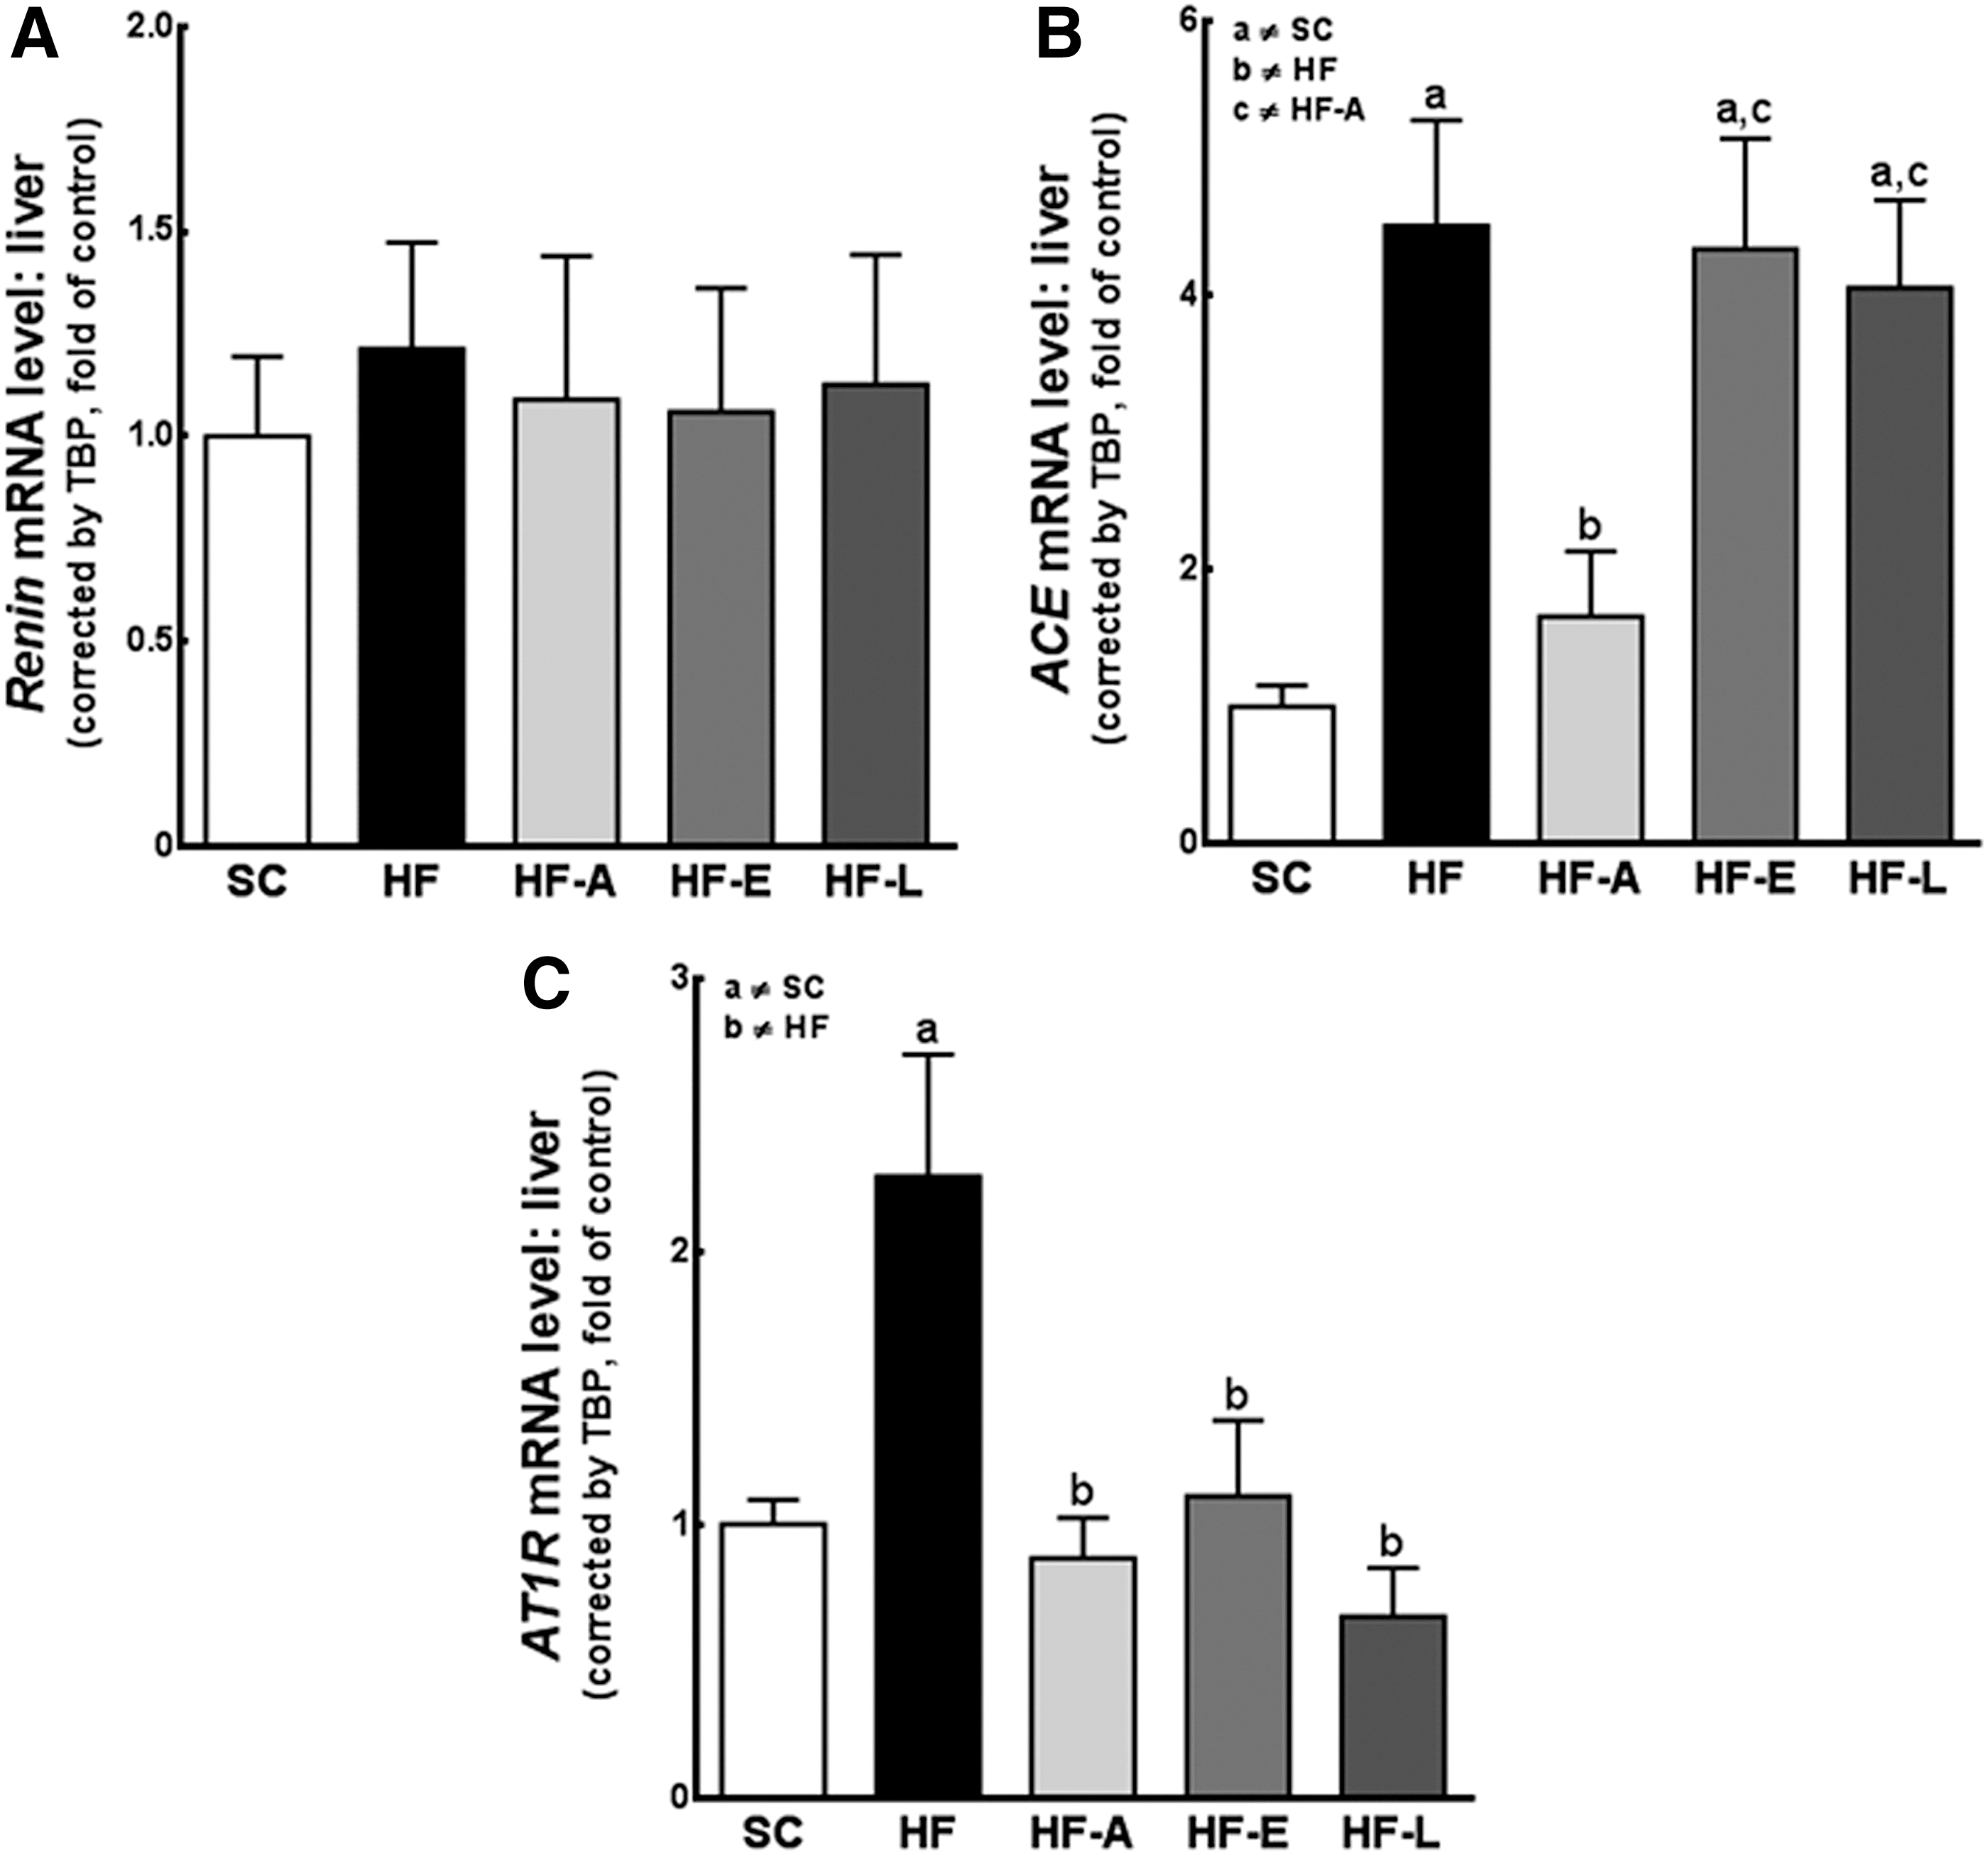
The changes in the gene expression of the renin–angiotensin system (RAS) components in the liver. The hepatic expression of genes encoding Renin
The mRNA expression of ACE in the liver was four-fold higher in the HF (P<0.01), HF-E (P<0.05), and HF-L (P<0.05) mice compared with the SC mice. The decrease in ACE expression in the HF-A–treated group compared with the untreated HF group (P<0.05) was associated with renin activity inhibition by aliskiren (Fig. 6B).
AT1R gene expression increased two-fold in the untreated HF group relative to the SC group (P<0.05); however, the aliskiren, enalapril, and losartan treatments reduced these increases in the HF group (P<0.01, in all cases) to values approaching those of the SC group (Fig. 6C). These results were further confirmed at the protein level via western blotting (Fig. 2).
PPAR-alpha was downregulated in the untreated HF, HF-A, and HF-L groups compared with the SC group (P<0.05; Fig. 7A). All groups presented the same protein levels on western blot (Fig. 5B). Similarly, the mRNA expression of the target gene CPT-1 (Fig. 7B) was also found to be decreased by half in the HF, HF-A, HF-L, and HF-E mice compared with the SC mice (P<0.05).

Gene expression of PPARα
We found a significant (two-fold) increase in the liver PPAR-gamma mRNA levels in the HF and HF-A groups compared with the SC (P<0.05) and HF-E (vs. HF, P<0.01; Fig. 7C) groups.
The HF diet doubled the SREBP-1c mRNA level in the untreated animals compared with the control animals (P<0.05), whereas only treatment with enalapril reversed this increase to values similar to those of the SC animals (vs. HF, P<0.05; Fig. 7D). All groups showed similar protein levels via western blot analysis (Fig. 5C). Similarly, FAS expression was elevated in the HF and HF-L groups compared with the SC (P<0.05) and HF-E groups (vs. HF, P<0.05) (Fig. 7E).
The PPARα/PPARγ gene expression ratios (Fig. 8A) in the HF, HF-A, and HF-L groups were less than half that of the SC group (P<0.001). Only the HF-E group had a ratio that was higher than the untreated HF group (P<0.05) and similar to that of the SC-fed mice (Fig. 8A).

PPARα to PPARγ mRNA ratio
Therefore, compared with the SC diet-fed mice, the PPARα/SREBP-1c mRNA ratio was less than half in the HF diet-fed mice and even lower in the HF-A and HF-L mice (P<0.01 in all cases). The PPARα to SREBP-1c ratios were equivalent in the SC and HF-E mice (Fig. 8B). This result was similar to the PPAR-α/SREBP-1c protein level ratios in all groups (Fig. 5D).
Discussion
To evaluate the mechanisms responsible for the exacerbation of disease in patients with metabolic syndrome, as well as possible pharmacological interventions, we examined the effects of different RAS blockades in a mouse model of diet-induced IR and NAFLD. All treatments significantly restored the upregulation of local RAS in the livers of mice. However, we suggest that treatment with enalapril more efficiently improved glucose tolerance and insulin and leptin sensitivity, reduced hepatic steatosis and TAG accumulation (due to decreased lipogenesis), and normalized both gluconeogenesis and insulin signaling.
The liver is the primary source of circulating AGT, and the plasma concentration of AGT is the rate-limiting step in the RAS. 12 In the current study, we found that hepatic AGT protein expression was significantly increased in mice fed a HF diet. The upregulation of intrahepatic RAS components (AGT, ACE, and AT1R) occurred in response to hepatic IR and fatty liver at the mRNA and protein levels. Despite no differences and very low renin levels in the liver, the conversion of locally generated AGT to Ang I occurred as a result of the uptake of renal renin via circulation. 13
All treatments restored the elevation of intrahepatic RAS components, and each treatment class restored this elevation according to its level of capability. Therefore, we speculate that the more intense attenuations demonstrated by enalapril in IR and NAFLD may not be direct consequences of Ang II-induced regulation via the AT1R of metabolic syndrome–related gene expression. Our results do not immediately indicate that a RAS blockade will suppress the development of hepatic steatosis; however, collectively, these observations suggest that the overactivation of the RAS pathway plays a role in the pathogenesis of NAFLD. 12,13,15 The potential mechanisms of this process were not clarified.
Diet-induced obesity is associated with hyperleptinemia (a proinflammatory adipokine) in proportion to fat size stores and is concomitant with leptin resistance, 18 as indicated for the HF, HF-A, and HF-L groups in our study. Notably, treatment with enalapril decreased the leptin levels (thus reflecting higher leptin sensitivity); this finding is in agreement with the enhanced energy balance control noted by our group 11 and others. 19 –21 In contrast, adiponectin is an anti-inflammatory mediator that improves insulin sensitivity, limits TAG accumulation in the liver, suppresses hepatic glucose output, and was found to be increased in HF diet-fed mice treated with enalapril. 11,22
We observed glucose intolerance (OGTT) and low insulin sensitivity (IPITT) in the mice fed the HF, HF-A, and HF-L diets. The larger incremental AUCs of the plasma glucose indicated that the mice were not able to normalize their hyperglycemia. These effects resulted in hyperinsulinemia and hyperglucagonemia, along with pancreatic islet dysfunction, which determines the course of obesity-related IR and a prediabetic state. 11,23 These parameters were improved only in the HF-E mice, which had characteristics similar to the SC mice, including a regularized insulin-to-glucagon ratio, an indicator of the normalization of hepatic glucose output.
The liver plays a major role in maintaining glucose homeostasis by balancing the production and storage of glucose. 24 Our data indicate the overexpression of PEPCK and G6Pase in the HF-, HF-A–, and HF-L–fed mice, suggesting that increased gluconeogenesis was partially responsible for the perturbation of the whole animal glucose homeostasis in these mice. 5 Furthermore, the HF diet increased the GLUT2 protein levels in the hepatocytes, corroborating with the excessive gluconeogenesis and hepatic glucose output. 17,25 Interestingly, enalapril administration inhibited both G6Pase and PEPCK and restored the GLUT2 protein levels in the liver and pancreas of these animals. 11
Insulin is the most potent inhibitor of gluconeogenesis. 24 HF diet–fed mice showed a decrease in the insulin-stimulated IRS-1/Akt pathway. Despite the lack of statistical differences in the IRS-1 and total Akt protein levels in all groups, animals fed the HF, HF-A, and HF-L diets presented a decrease in insulin-induced Akt serine phosphorylation. The maximal Akt activity is dependent on the phosphorylation status of both the Thr308 and Ser473 residues. 26 AktSer473 was increased in the enalapril-treated mice and was associated with an improvement in the functioning of the insulin-stimulated IRS-1/Akt pathway.
Furthermore, the animals who consumed the HF diet exhibited moderate steatosis (stage 2, >33%), which is typically associated with a low-grade inflammatory state. 27,28 The conventional explanation for hepatic TAG accumulation in these animals is that obesity and IR alter TAG synthesis and transport, which increases the lipolysis rate in the adipose tissue and the transport of free fatty acid (FFA) into the liver. 29 All drug treatments caused a moderate to mild steatosis attenuation (stage 1 steatosis, <33%). 27 However, only treatment with enalapril returned liver steatosis to the levels observed in the SC group. In an effort to understand the molecular mechanisms related to our findings, we evaluated the mRNA and protein expression of several lipogeneses and/or beta-oxidations in the liver.
The mechanism of NAFLD may involve the increased expression of SREBP-1c, FAS, and PPARγ, resulting in an increased de novo lipogenesis. 3,24 The HF-A mice did not experience a reverse in metabolic changes or adverse liver remodeling. Aliskiren only partially enhanced the SREBP-1c and FAS protein and mRNA expression levels. However, the lipogenic pathway was activated in the HF-A groups as a consequence of increased PPARγ expression, 6 occasioning the liver lipogenesis and steatosis. This is in contrast with the observations in the HF-E group, which indicate that enalapril attenuated the increase of SREBP-1c, FAS, and PPARγ. Previous studies have shown that the inhibition of PPARγ could reduce body fat and improve IR. 30 According to our results, as well as the clinical studies of others, 31 losartan had no impact on glucose homeostasis. The HF-L mice failed to decrease lipogenesis despite an apparent improvement in the levels of SREBP-1c and PPARγ mRNA.
PPARα has been shown to play a critical role in the regulation of cellular uptake and the activation and beta-oxidation of FFA; PPARα also inversely correlates with hepatic steatosis. 30 The HF diet in all groups promoted a reduction of PPARα levels, which directly downregulates CPT-1 gene expression, a key rate-limiting enzyme that controls the entry of FFA into the mitochondrial beta-oxidation system. 8,9 We observed that no treatment was effective in increasing beta-oxidation.
The reduced PPARα/SREBP-1c mRNA and protein ratios observed in the untreated HF, HF-A, and HF-L mice are consistent with previous studies in obese subjects. 17,32 These reduced ratios indicate greater SREBP-1c activation with minor PPARα expression, a condition that may favor lipogenesis over FFA oxidation. Although HF-E treatment did not significantly improve PPARα expression levels, the reduction of SREBP-1c was noteworthy (shown via western blot analysis and consistent with the real-time PCR data). Similarly, the PPARα/PPARγ mRNA ratios were significantly decreased in the HF, HF-A, and HF-L mice. In contrast, the HF-E mice showed an increase in this ratio, which counters hepatic lipogenesis.
Therefore, ACE inhibitors may be eligible drugs for reducing the progression of hepatic IR and lipid accumulation, primarily in cases of a concomitant increase in blood pressure. 11 By inhibiting ACE, enalapril also prevents the degradation of bradykinin, which may explain some of the clinical differences between ACE inhibitors and other RAS blockers. 33 In conclusion, the current study provides evidence that enalapril treatment greatly affected IR, protecting the liver against adverse remodeling and metabolic abnormalities. It is clear that enalapril acts via the integration of a number of mechanisms, such as by reducing leptin levels, improving hepatic glucose output (PEPCK, G6Pase, and GLUT2), enhancing insulin signaling (IRS-1/Akt pathway), and reducing lipogenesis via SREBP-1c, FAS, and PPARγ. This ACE inhibitor could provide effective options for preventing complications in patients with T2DM and metabolic syndrome.
Footnotes
Acknowledgments
The authors thank Thatiany Marinho, Michele Soares, Gezileia Lau, and Willian Lannes for their technical assistance. This study was supported by CNPq (grant number E26/110.549/2010, C.A.M.L.) and FAPERJ (grant number 302154/2011-6, C.A.M.L.).
Author Disclosure Statement
No competing financial interests exist.