
Abstract
Background:
The aim of this study was to assess clinical and inflammatory markers in nonalcoholic fatty liver disease (NAFLD) in postmenopausal women with metabolic syndrome.
Methods:
This cross-sectional study included 180 Brazilian women (age ≥45 years and amenorrhea ≥12 months). Metabolic syndrome was diagnosed by the presence of at least three of the following indicators: Waist circumference (WC) >88 cm, triglycerides (TGs) ≥150 mg/dL, high-density lipoprotein (HDL) <50 mg/dL; blood pressure ≥130/85 mmHg; and glucose ≥100 mg/dL. NAFLD was diagnosed by abdominal ultrasound. Participants were divided into three groups: Metabolic syndrome alone (n=53); metabolic syndrome+NAFLD (n=67); or absence of metabolic syndrome or NAFLD (control, n=60). Clinical, anthropometric, and biochemical variables were quantified. The inflammatory profile included adiponectin, interleukin-6 (IL-6) and tumor necrosis factor-α (TNF-α). Data were submitted to statistical analysis using a Tukey test, analysis of variance (ANOVA), chi-squared, Pearson correlation, and logistic regression (odds ratio, OR).
Results:
Women with metabolic syndrome+NAFLD, abdominal obesity, high glucose, and insulin resistance by HOMA-IR were compared to women with metabolic syndrome alone and controls (P<0.05). High values of IL-6 and TNF-α and low values of adiponectin were observed among women with metabolic syndrome alone or metabolic syndrome+NAFLD when compared to controls (P<0.05). In multivariate analysis, the variables considered as risk of NAFLD development were: High systolic blood pressure (SBP) [(OR 1.02, 95% confidence interval (CI) 1.0–1.04]; large WC (OR 1.07, 95% CI 1.01–1.13); insulin resistance (OR 3.81, 95% CI 2.01–7.13); and metabolic syndrome (OR 8.68, 95% CI 3.3–24.1). Adiponectin levels reduced NAFLD risk (OR 0.88, 95% CI 0.80–0.96).
Conclusion:
In postmenopausal women, metabolic syndrome, abdominal obesity, and insulin resistance were risk markers for the development of NAFLD, whereas higher adiponectin values indicated a protection marker.
Introduction
N
The NAFLD physiopathology development model is known as the “two-hit model.” 13 The first hit is determined by peripheral IR. The second hit comes from oxidative stress as a result of progressive accumulation of fat in the cytoplasm of hepatocytes. It has been suggested that cytokines, hyperinsulinemia, and lipid peroxidation could possibly be etiological factors that trigger oxidative stress. 13,14 On the basis of this theory, NAFLD development occurs as the result of multiple hits, and the initial hit is a defect in the metabolism of free fatty acids (FFA). 2 The increase of FFA as the result of obesity and IR has an accepted role that triggers hepatic damage and steatosis directly. 13,15 On the other hand, FFA metabolism alteration is probably the main factor involved in dysglycemia and dyslipidemia associated with metabolic syndrome. 16
Adipocytokines are molecular mediators associated with visceral obesity. It seems these mediators play a key role in the modulation of insulin signaling and in the inflammatory cascade, two fundamental conditions for hepatic fat accumulation. 17 Visceral adipose tissue is metabolically active and capable of functioning as an endocrine organ, secreting adipocytokines that have a major role in the regulation of sensitivity to insulin. Dysfunctional visceral fat is related to increased secretion of proinflammatory cytokines, such as the tumor necrosis factor-α (TNF-α) and interleukin-6 (IL-6) and decreased adiponectin secretion that boosts IR. Hence, visceral fat has a crucial role in IR and NAFLD pathogenesis. 3,15 Given the key role of IR in metabolic syndrome pathogenesis, NAFLD could be considered the hepatic manifestation of metabolic syndrome. 18
Data in the literature are scarce and show high variation in the incidence of NAFLD in postmenopausal women, ranging from 15% to 57%. 7,19,20 Just as there are few data related to the association of NAFLD with metabolic syndrome in postmenopausal women, despite its well-known CVD risk factor, which is the main cause of death in women. Therefore, it is important to recognize NAFLD, a common cause of chronic hepatic disease, especially in postmenopausal women with metabolic syndrome. Considering this context, the objective of this study was to evaluate clinical and inflammatory markers of NAFLD in postmenopausal women with metabolic syndrome.
Materials and Methods
Patients and measurements
This was a clinical, analytical, comparative, cross-sectional study. A population comprised of postmenopausal women aged 45–70 years attended a public outpatient center in southeastern Brazil from January, 2011, to August, 2012. Sample size was calculated based on the mean values of adiponectin in NAFLD patients (8.1±5.1 μg/mL) and in the control group (11.0±5.3 μg/mL), as shown in the study by Lemoine et al. 21 Considering the difference between these values, an estimate of the minimum sample size for a confidence coefficient of 90% and a margin of error of 5% would be 50 participants per group. Women whose last menstruation occurred at least 12 months prior to this study and were ≥45 years old were included. The exclusion criteria were addiction to alcohol >20 grams of ethanol/day, liver disease (hepatitis B and C, cholestatic disease, hepatic tumors), use of medications that affect hepatic metabolism (amiodarone, tamoxifen, glucocorticoids, diltiazem, methotrexate, valproic acid, antiretroviral drugs), bariatric surgery, history of acquired immunodeficiency syndrome (AIDS), chronic inflammatory disease, autoimmune diseases or cancer, and morbid obesity. The participants were divided in three groups based on the presence or absence of metabolic syndrome and/or NAFLD: The metabolic syndrome alone group (n=53); metabolic syndrome with NAFLD group (n=67); and absence of metabolic syndrome or NAFLD group (control, n=60). Figure 1 shows the study structure for the group of 180 women who were included in the study. Informed consent was obtained from all participants, and the study was approved by the Research Ethics Committee of Santa Casa Hospital of Belo Horizonte.
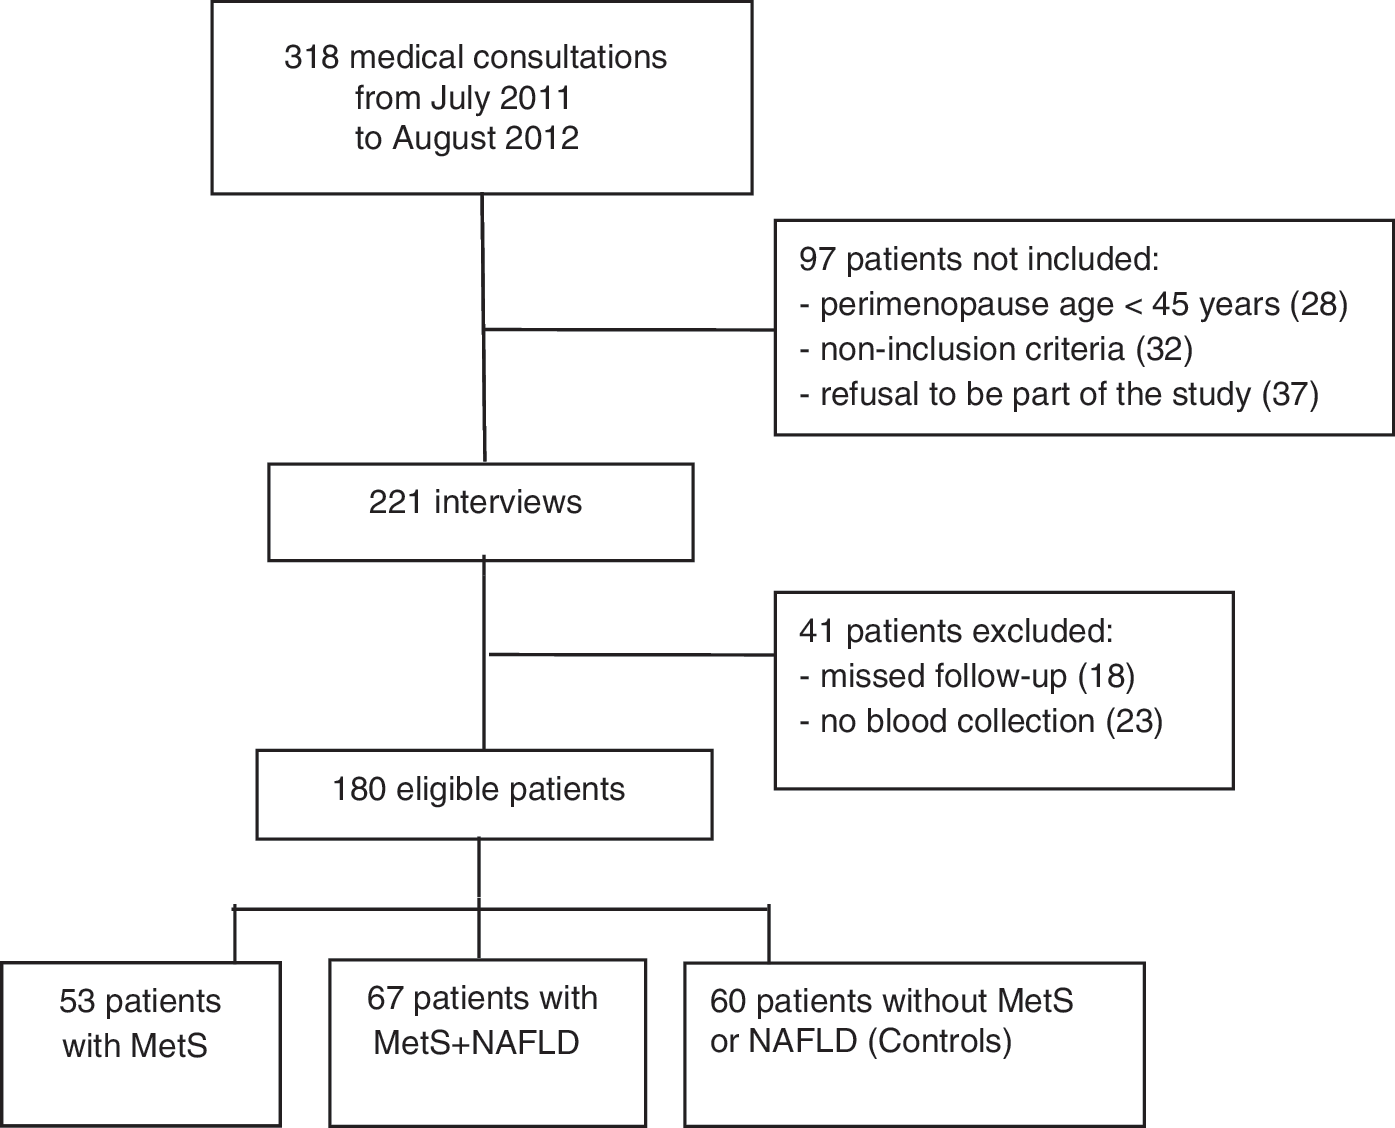
Flow chart of women included in the study. NAFLD, nonalcoholic fatty liver disease; MetS, metabolic syndrome.
All participants were interviewed individually and the following data were collected: Age, time since menopause, parity, current smoking, use of hormone therapy (HT), history of newborn >4 kg, hypertension, and diabetes. Blood pressure was measured by using a standard aneroid sphygmomanometer on the right arm with the patient in the sitting position after a 5-min rest. Smokers were defined as women who reported a smoking habit regardless the number of cigarettes. Women who practiced aerobic physical exercises of moderate intensity for at least 30 min, five times/week (150 min/week) or resistance exercises three times a week were considered to be active. Women who fulfilled three or more diagnostic criteria recommended by the US National Cholesterol Education Program Adult Treatment Panel III (NCEP ATP III) 22 : Waist circumference (WC) >88 cm, TGs ≥150 mg/dL, high-density lipoprotein cholesterol (HDL-C) <50 mg/dL, blood pressure ≥130/85 mmHg, and fasting glucose ≥100 mg/dL or undergoing treatment were considered to be affected by metabolic syndrome.
Anthropometric data included weight, height, body mass index (BMI=weight/height2), and WC. BMI was defined according to the World Health Organization system (2002): <25 kg/m2 as normal, 25–29.9 kg/m2 as overweight, and≥30 kg/m2 as obesity. WC was measured at the midpoint between the lowest rib and the top of the iliac crest. Measurements were taken by a single evaluator. WC exceeding 88 cm was considered large. 22
Blood samples were collected from each subject after a 12-hr fast. Samples were submitted to biochemical analysis immediately after centrifuging, and an aliquot was frozen and maintained at −80°C until cytokine profiles readings were done. Analyses of TGs, total cholesterol (TC), HDL-C, glucose, alkaline phosphatase (AP), aspartate aminotransferase (AST), alanine aminotransferase (ALT), and gamma-glutamyl transferase (GGT) were performed with an automated analyzer Model Vitros 950® using a dry-chemistry colorimetric method (Johnson & Johnson®, Rochester, NY). Low-density lipoprotein cholesterol (LDL-C) was calculated using the formula by which TC is subtracted from the sum of HDL-C and TGs divided by 5. The values considered to be optimal were: TC <20 mg/dL, HDL-C ≥50 mg/dL, LDL-C <100 mg/dL, TGs <150 mg/dL, and glucose <100 mg/dL.
A solid-phase chemiluminescent immunoassay, Immulite System® (DPC®, USA) was used to quantify and assess insulin and hepatitis B and C with an automatic analyzer setup in the quantitative reading mode. Normal insulin concentration ranged from 6.0 to 27.0 μIU/mL, hepatitis B–hepatitis B surface antigen (HBsAg) <0.05 IU/mL, and hepatitis C–anti-hepatitis C virus (HCV) <0.09 IU/mL. To assess IR, a method based on statistical measurement of two plasma components (insulin and glucose) was used. Homeostasis model assessment of insulin resistance (HOMA-IR) was calculated by the formula: Insulin (mU/mL)×glucose (mg/dL)/405. IR was defined as a HOMA-IR value >2.7. 23
Adiponectin, TNF-α, and IL-6 concentrations were determined by a 5-hr solid phase enzyme-linked immunosorbent assay (ELISA), immunoassay (Human Adiponectin, Human TNF, High Sensitivity Human IL-6, Quantikines Kits, R&D® Systems, Minneapolis, MN) according to the manufacturers' instructions. Intra- and interassay variation coefficients were <7%. Analytical sensitivity according to the manufacturers of the kits was: Adiponectin=0.079–0.891 μg/mL, TNF-α=0.5–5.5 pg/mL, and HS IL-6=0.016–0.111pg/mL.
Fasting patients were submitted to hepatic assessment by abdominal ultrasound early in the morning. The following ultrasound images were obtained: Sagittal view covering the liver right lobe and ipsilateral kidney; transversal view of the liver and spleen left lateral segment; liver and spleen transversal view; and some altered echotexture focal areas. Liver fatty infiltration was graded qualitatively in four degrees according to subjective evaluation and by contrasting echogenic features of hepatic parenchyma, renal cortex, and spleen: Zero degree, not observed; degree I, mild steatosis (<30% of the liver compromised); degree II, moderate steatosis (from 30% to 60%); degree III, severe steatosis (>60%). 24 Ultrasound equipment (Toshiba Nemio XG®, Toshiba, USA) with a 3.5-MHz linear transducer was used. All ultrasound exams were performed by the same physician, expert in hepatic pathology, who had no knowledge of the patients' data.
Statistical analyses
Quantitative (average and standard deviation) and categorized (frequency and percentage) variables were set in tables according to each group. Complete randomized design [analysis of variance (ANOVA)] was applied in the comparison of clinical, anthropometric, and biochemical variables between groups followed by a Tukey test for variables with symmetrical or normal distribution. The same design was employed for variables with asymmetrical distribution adjusted by gamma distribution followed by a Tukey test or by a Wald multiple comparison test. The association between categorized or qualitative variables was analyzed by a chi-squared test or Fisher exact test, depending on the analyzed parameter. Multivariate analysis was performed by binary logistic regression taking into account a significance level of P<0.05 and a 95% CI. Furthermore, the calculation of the respective OR considered the group of women with NAFLD as the response compared to women without NAFLD set as baseline to draw possible associations between NAFLD risk (dependent variable) and variables that influence AST risk (independent variables) adjusted to age and weight. All clinical and laboratorial variables were tested by the multiple logistics regression adjustment model using the stepwise procedure for the variables that presented significant differences. Only statistically significant results are shown. Spearman correlation was used to assess associations between adiponectin (values in quartiles) and the presence of NAFLD. Statistical tests were bilateral with a 5% significance level. Statistical Analysis System (SAS, v. 9.2) was used to perform the analyses.
Results
Comparison of clinical and laboratory features among postmenopausal women affected by metabolic syndrome alone, metabolic syndrome+NAFLD, and the control group is shown in Table 1. The groups were homogeneous for age, time since menopause, parity, and TC, LDL, AP, and AST values (P>0.05). BMI mean values in women affected by metabolic syndrome+NAFLD were compatible with obesity (31.5 kg/m2), statistically higher than the control group (26.1 kg/m2) (P>0.05) with no difference in relation to women with metabolic syndrome alone (29.5 kg/m2). The largest WC values were measured in women affected by metabolic syndrome+NAFLD (P<0.01) (Table 1). HDL-C mean values were significantly higher in the control group when compared to the two other groups (P<0.01). TG values in women affected by liver disease were higher in relation to the other groups (P<0.05). In the metabolic syndrome+NAFLD group, glucose and insulin mean values were significantly higher when compared to the other groups (P<0.01). The values of the HOMA-IR test for this group were compatible with IR (>2.7). In the assessment of liver function markers, GGT and ALT showed a significant difference between groups that was higher in women affected by NAFLD (P<0.05). In women with metabolic syndrome alone or associated with NAFLD, adiponectin levels were the lowest, whereas IL-6 and TNF-α levels were the highest when compared to the control group (P<0.05) (Table 1).
Values are expressed as mean (SD).a,aSignificantly not different between groups.a,b,cSignificantly different between groups (P<0.05; analysis of variance (ANOVA) or gamma distribution, followed by Tukey test.
NAFLD, nonalcoholic fatty liver disease; SBP, systolic blood pressure; DBP, diastolic blood pressure; BMI, body mass index; WC, waist circumference; HDL-C, high-density lipoprotein cholesterol; LDL-C, low-density lipoprotein cholesterol; HOMA-IR, homeostasis model assessment of insulin resistance; AP, alkaline phosphatase; GGT, gamma-glutamyl transferase; AST, aspartate aminotransferase; ALT, alanine aminotransferase; IL-6, interleukin 6; TNF-α, tumor necrosis factor-α.
No significant differences between groups were observed with regard to smoking, physical activity, and current HT (Table 2). Incidence of hypertension and diabetes among women affected by metabolic syndrome alone or associated with NAFLD was greater when compared to the control group. Hypertension was detected in 60.4% of the women affected by metabolic syndrome alone and 64.2% of those with liver disease and diabetes at 18.0% and 23.9%, respectively. In the control group, 33.3% of the women were hypertensive, and there were no cases of diabetes (P<0.05).
Values are expressed as numbers (%).
Significantly different between groups (P<0.05; chi-squared test).
Significantly different between groups (P<0.05; Fisher exact test).
NAFLD, nonalcoholic fatty liver disease; HT, hormone therapy.
Ultrasound showed that 37.2% (67/180) of the eligible patients had hepatic steatosis. The presence of moderate and/or severe steatosis was detected in 38 women (21.1%). In multivariate analysis, clinical and laboratory variables that could pose risks of NAFLD development were high SBP, increased ALT, large WC, IR, and the presence of metabolic syndrome. Even after adjustments in age and weight, which are potential confounding factors, all the variables mentioned above remained as risk factors for the development of NAFLD. Conversely, adiponectin was considered a protector factor (Table 3).
Only the results statistically significant were presented; the other variables are not significant.
Significantly different (P<0.05<0.05; logistic regression).
Adjusted for age and weight.
NAFLD, nonalcoholic fatty liver disease; OR, odds ratio; CI, confidence interval; SBP, systolic blood pressure; WC, waist circumference; ALT, alanine aminotransferase; HOMA-IR, homeostasis model assessment of insulin resistance.
It was shown that women who were not affected by liver disease presented higher adiponectin levels when compared to those affected by steatosis (P=0.0003) (Table 4). Also, a negative correlation was observed between adiponectin and the presence of NAFLD (r=−0.308; P<0.0001). By associating adiponectin values with ultrasound findings, it was shown that mean values were higher (11.45 μg/mL) among women whose ultrasound exam was normal in comparison with those who presented moderate and/or severe steatosis (7.6 μg/mL) (P<0.05) (data not shown). In the correlation between adiponectin (log) and clinical and laboratory variables (Fig. 2), a significant negative correlation was observed between adiponectin (log) and WC (r=−0.243, P=0.001), TGs (r=−0.303, P<0.0001), and HOMA-IR (r=−0.267, P=0.003); there was a positive correlation of adiponectin with HDL-C (r=0.206, P=0.005). Serum adiponectin concentration decreased with an increase in the number of features of metabolic syndrome (P<0.05). Conversely, serum IL-6 and TNF-α concentrations steadily increased in women exhibiting more features of the metabolic syndrome (P<0.05) (Table 5).
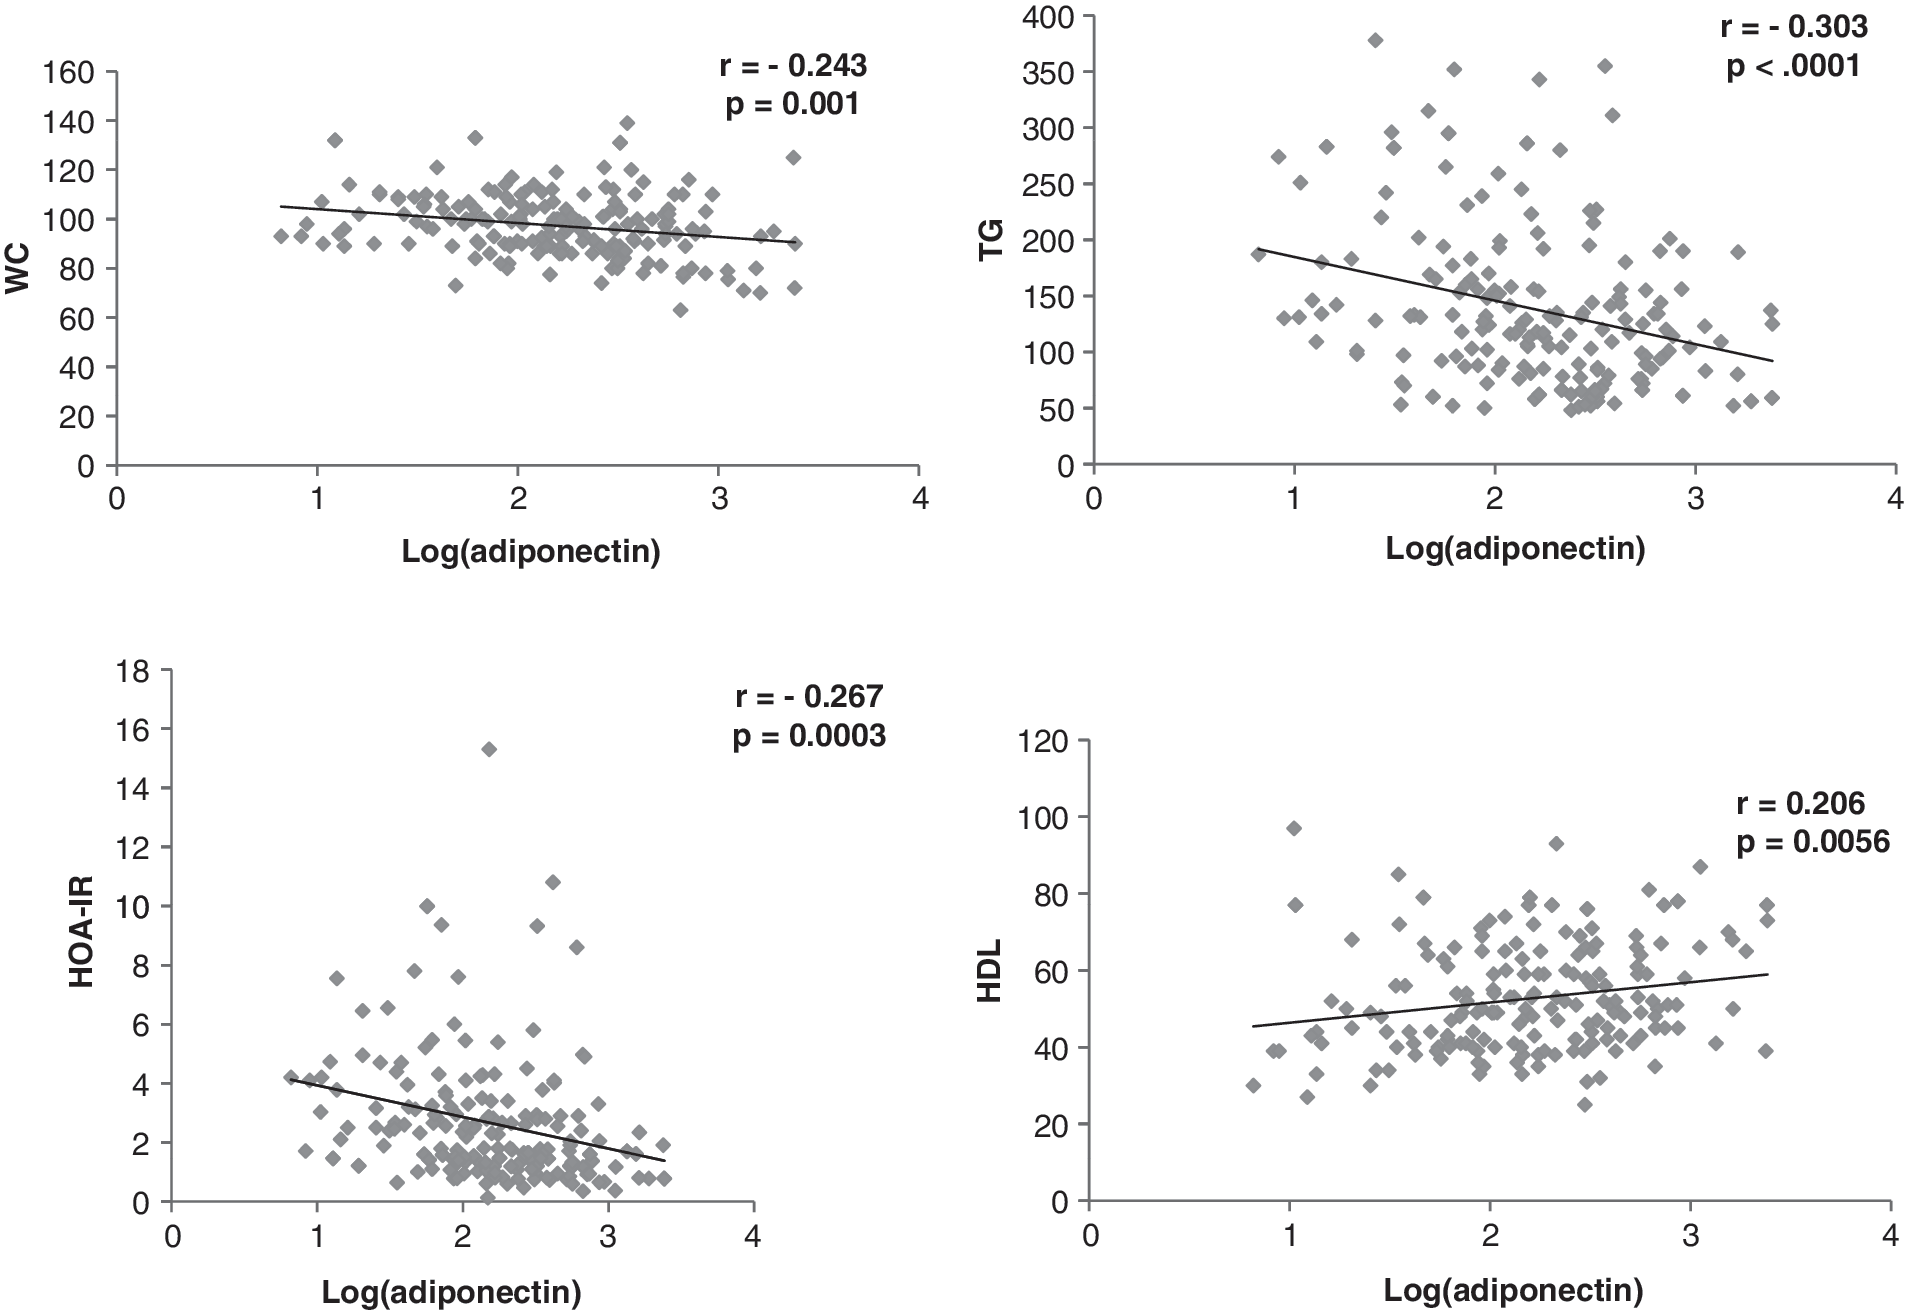
Correlation of adiponectin (log) with waist circumference (WC), triglycerides (TGs), homeostasis model assessment of insulin resistance (HOMA-IR), and high-density lipoprotein cholesterol (HDL-C) in 180 postmenopausal women. (*) P<0.05 (Pearson correlation).
Values expressed in numbers (%).
Significantly different between groups (P<0.05; chi-squared test).
NAFLD, nonalcoholic fatty liver disease.
Data are presented as mean±standard deviation (SD).
P<0.05; generalized linear model with gamma distribution followed by Wald multiple comparison test.
Significantly not different between groups.
Significantly different between groups.
IL-6, interleukin 6; TNF-α, tumor necrosis factor-α.
Discussion
In this study, the presence of metabolic syndrome, abdominal obesity, and IR were risk markers for NAFLD development, whereas high adiponectin values were a protective marker. These results suggest the importance of liver evaluation in postmenopausal women with metabolic syndrome. It should be emphasized that in this study, NAFLD diagnosis occurred in the absence of any other suggestive symptoms related to liver disease and was detected in 37.2% of postmenopausal women. These data agree with the 20%–40% incidence of the disease found in population studies that included both sexes. 1,4 The relationship between age and menopausal condition in NAFLD was the object of a study carried out with 1829 Japanese women submitted to hepatic ultrasound. The study results showed that 6% of premenopausal women, 14% (50–59 years old) and 18.9% (60–80 years old) of postmenopausal women were diagnosed with NAFLD. Age, metabolic syndrome presence, and weight gain were independent risk factors. 7 These data are in accordance with the actual research.
NAFLD increases with age, and its prevalence is higher among 40- to 49-year-old women and after menopause, suggesting that metabolism of sex steroid hormones may play a role in NAFLD pathogenesis. 3 This higher prevalence in postmenopausal women may be related to physiological changes in response to hypoestrogenism and changes in body composition. 5,6 After the onset of menopause, weight gain and changes in body fat distribution are frequent. There is increased fat deposition in the trunk due to relative hypoestrogenism and hyperandrogenism. 25 Abdominal obesity is metabolically different from gynecoid obesity given its higher lipolysis rates with negative repercussions on the lipid profile (increased FFA and TGs). 13,15 Moreover, abdominal obesity contributes to the development of insulin resistance, type 2 diabetes mellitus, dyslipidemia, and consequently metabolic syndrome, important risk markers for CVD, which is the leading cause of mortality in postmenopausal women. 12
NAFLD is consistently associated with obesity in 60%–95% of the cases, diabetes in 28%–55%, and dyslipidemia in 27%–92%. 15 In our study, 42.2% of the women were considered obese and 78.6% presented high values of WC (>88 cm). The high incidence of abdominal obesity is due to the fact that the group of postmenopausal women is specific. 25 We conducted a previous study with 368 postmenopausal women in which an increment in WC was observed in 62.5% of the participants, and 39.6% were diagnosed with metabolic syndrome. 11 Evidence of NAFLD and metabolic syndrome association can be demonstrated through the fact that patients affected by hepatic steatosis present risk factors that are included in the metabolic syndrome diagnostic criteria. 26 A cross-sectional study in which 304 patients of both sexes with NAFLD were assessed showed that 53% of the patients were affected by metabolic syndrome. Moreover, in those patients affected by steatohepatitis, metabolic syndrome incidence was higher (88%), indicating that it is a risk factor for liver disease. 27 In a study carried out with 26,527 patients of both sexes, the incidence of NAFLD among women was 15.6% and the occurrence of metabolic syndrome in this group was 33.8%. Among women who did not present hepatic steatosis, only 10.6% were affected with metabolic syndrome. 19
In the current study, it was observed that high SBP, IR, and abdominal obesity were considered risk variables for NAFLD development, as well as metabolic syndrome criteria. Therefore, the presence of metabolic syndrome was an indication of its strong association with NAFLD (OR=8.68) in concordance with the literature, despite the scarcity of studies aimed specifically at postmenopausal women. 20,28 A population of both sexes with an age range between 15 and 85 years was the object of a Spanish multicentric study. The authors found a high association between NAFLD and metabolic syndrome in women (OR=6.73). 8 In another study, the presence of metabolic syndrome in 392 postmenopausal Japanese women was also deemed as a risk factor (OR=4.87) for NAFLD development. 7
Our results are in accordance with the literature with regard to IR's central role in NAFLD and metabolic syndrome. 13,15 IR in the adipose tissue is essential to increase the flow of FFA to the liver. 3,17 An increase in FFA increase triggers direct hepatic damage by raising oxidative stress through the activation of inflammatory pathways. 29 In the current study, the assessment of inflammatory markers demonstrated that patients with metabolic syndrome alone or associated with NAFLD presented high levels of IL-6 and TNF-α and decreased levels of adiponectin when compared to healthy disease-free patients. At the present time, there are no data in the literature regarding inflammatory profile assessment aimed at postmenopausal women affected by metabolic syndrome and NAFLD that would allow comparison of the results of the current study. It seems that adiponectin has an anti-inflammatory effect, whereas IL-6 and TNF-α exert proinflammatory effects on the hepatic tissue. 30,31 A prospective study assessed the inflammatory profile and its relation with visceral adiposity in 69 North American women who were followed from the premenopausal (45–55 years) up to the postmenopausal (49–60 years) phase. Intra-abdominal fat gain at menopause onset was negatively correlated to adiponectin. No correlation was found with regard to IL-6 and TNF-α. 6 In the present study, despite the higher values of IL-6 TNF-α in women with MetS alone or associated with NAFLD that is displayed in the inflammatory profile, no association with liver disease itself was observed.
We observed a negative association between adiponectin values and NAFLD in postmenopausal women affected by metabolic syndrome that is consistent with previous studies. 32 –34 By comparing lower adiponectin values detected in patients with NAFLD in the current study to values in patients who were not affected by hepatic steatosis, it may be concluded that the adiponectin–NAFLD negative association could have been triggered by the absence of the protein protective effect on the liver. A recent meta-analysis has shown that adiponectin values in patients of both sexes with NAFLD were significantly lower when compared to those patients who were not affected by hepatic disease. 35 In this research, it was observed that women whose ultrasound diagnosis indicated moderate and/or severe hepatic steatosis presented adiponectin values (7.6 μg/mL) lower than those whose ultrasound image was normal (11.45 μg/mL), regardless the presence or absence of metabolic syndrome. Hypoadiponectinemia might have an important role in the physiopathology progression of NAFLD. 35
The data in this study may be limited due to its cross-sectional design. This limitation prevents drawing causality inferences about the population in general, as well as the biased record concerning ingestion of alcoholic beverages that was only assessed by interview. Another study limitation was related to the use of ultrasound imaging as a diagnostic method for hepatic steatosis, given its operator-dependent nature and low sensitivity with regard to low degrees of steatosis and patients with morbid obesity. 4,36 In our study, the interviews were carried out by two trained professionals, and all ultrasound exams were performed by a sole specialized evaluator; patients with BMI >40 kg/m2 were excluded. Meta-analysis has shown that abdominal ultrasound is the most reliable technique for the detection of NAFLD when compared to histology and other imaging techniques, such as tomography and resonance. Moreover, ultrasound imaging presents sensitivity of 84.8% and specificity of 93.6% for the detection of steatosis with hepatic infiltration above 20%–30%. It is the method of choice for NAFLD tracking in population studies and the everyday clinic. 37 Risk factors and noninvasive diagnostic markers are relevant and must be identified, given that they avoid invasive procedures that are expensive and pose risks to the patients. 38
This study's most important point is the research on metabolic syndrome and NAFLD and inflammatory markers, specifically in postmenopausal women, a group considered to be at risk due to both diseases. Following a global trend, weight excess in Brazilian women has increased from 28.7% in 1974–1975 to 48% in 2008–2009, and obesity has doubled from 8% to 16.9%. 39 In the present study, allied to obesity and IR, NAFLD was found in 37.2% women with no suggestive signs of liver disease. Thus, gynecologists need to be alert with regard to the initial diagnosis and how this group of women affected by NAFLD should be approached. This is an opportunity to introduce therapeutic measures, encouraging weight loss, physical activity practices, and making healthy changes in dietary habits. The impact of the first contact of the gynecologist with the patient will reflect in the quality of life and lengthened life span of postmenopausal women, as well as the costs of public health as the result of NAFLD diagnosis.
In conclusion, as shown in the present study, postmenopausal women affected by metabolic syndrome, centralized obesity, insulin resistance, and hypoadiponectin are subject to high risk of developing NAFLD. These results suggest the importance of liver evaluation in postmenopausal women with metabolic syndrome.
Footnotes
Acknowledgment
No funding was received for this study.
Author Disclosure Statement
The authors declare that there are no relevant conflicts of interest, nor commercial, nor proprietary, nor financial in the products or instruments described in this article.