
Abstract
Non–high-density lipoprotein (non-HDL-C) is the best predictor of coronary artery disease and stroke. Studies have shown that weight loss decreases non-HDL-C levels. However, whether diet-induced weight loss in individuals with and without metabolic syndrome causes a reduction in non-HDL-C levels remains unclear. We investigated the effects of weight loss on non-HDL-C levels in 34 middle-aged obese men with and without metabolic syndrome classified using National Cholesterol Education Panel Adult Treatment Panel III criteria (metabolic syndrome, n=17; non–metabolic syndrome, n=17). We conducted a 12-week dietary intervention using a low-carbohydrate, -fat, and -protein diet to reduce body weight. A significant decrease in body weight and body mass index in both groups was observed. However, the non-HDL-C level after weight loss was significantly decreased in the metabolic syndrome group (151.9±6.8 to 131.4±6.2 mg/dL, P<0.01) but not in the non–metabolic syndrome group (152.1±8.2 to 141.2±8.1 mg/dL, P>0.05). Levels of apolipoprotein AII and B, but not AI, were similarly decreased in both groups (P>0.05). Pearson correlation analysis showed that the change in non-HDL-C levels in the metabolic syndrome group was strongly associated with levels of total cholesterol, fasting insulin, and alanine and aspartate transaminase, as well as homeostatic model assessment index, diastolic blood pressure, and maximal oxygen uptake (P<0.05). These results demonstrated that diet-induced weight loss without physical activity decreases non-HDL-C levels, an important factor associated with changes in cardiorespiratory fitness and insulin sensitivity, in obese individuals with metabolic syndrome.
Introduction
N
Patients with diabetic dyslipidemia and related conditions such as central obesity and metabolic syndrome often have elevated TG and low HDL-C levels. A recent study showed that metabolic syndrome was associated with increased non-HDL-C levels. 6 Moreover, higher non-HDL-C levels were associated with the severity of cardiovascular events. In general, weight loss in the management of obesity and metabolic syndrome has been used as a tool for cardiometabolic prevention. However, there is little to no information about the effect of weight loss on non-HDL-C levels in individuals with and without metabolic syndrome.
Some studies have revealed that apolipoprotein B (ApoB100) and LDL-C are associated with a higher CV risk than non-HDL-C. 7 –9 In addition, the ApoB100-to-ApoA1 ratio is strongly related to risk of CVDs, such as myocardial infarction and stroke. 10,11 Thus, it is of importance to analyze the changes occurring in non-HDL-C and ApoB100 levels during weight loss.
Cardiorespiratory fitness, as measured objectively by a maximal, symptom-limited exercise tolerance test on a bicycle ergometer has been used to monitor the strongest predictors of mortality in men. 12 Previous studies showed significant positive correlations with maximal oxygen uptake (VO2max) and HDL-C levels. 13 Certain studies have also reported the relationship between non-HDL-C levels and physical activity. 14,15 However, few studies have been conducted regarding whether weight loss could improve the levels of serum lipoproteins such as non-HDL-C in obese men with metabolic syndrome.
Insulin resistance has been associated with obesity-related metabolic disorders and metabolic syndrome, which also promotes the risk of CVD events. Hyperinsulinemia with insulin resistance is associated with an unfavorable lipid profile, i.e., high levels of TGs and low levels of HDL-C. 16 In addition, non-HDL-C levels increased in patients with type 2 diabetes melliltus (T2DM) with insulin resistance compared to controls. 17
The purpose of this study was to investigate the effects of weight loss on non-HDL-C levels in middle-aged obese men with and without metabolic syndrome. In addition, this study assessed whether the change in non-HDL-C level was associated with changes in cardiorespiratory fitness and insulin resistance during weight loss.
Materials and Methods
Participants
The volunteers recruited through advertisements were healthy, were not consuming any medication known to alter glucose and lipid metabolism, and were reportedly free of any diagnosed CVD. We also removed individuals who were unable to perform an exercise test for exercise tolerance (n=4) and orthopedic problems (n=3). The nature, purpose, and potential risks of the study were explained to all the subjects, and voluntary informed written consent was obtained from all subjects before participation in the study. This study was conducted in accordance with the guidelines proposed in The Declaration of Helsinki and the study protocol was reviewed and approved by the Ethics Committee, University of Tsukuba, Japan.
Anthropometric measurements
Height was measured on a wall-mounted stadiometer (TBF-215; Tanita, Tokyo, Japan). Body height was measured to the nearest 0.1 cm using, and body weight was measured to the nearest 0.01 kg using calibrated electronic digital scales (TBF-215; Tanita, Tokyo, Japan) in light clothing and without shoes. Body mass index (BMI) was calculated by weight (kg) divided by height (m2). Waist circumference (WC) was measured at the level of the umbilicus in lightly clothed participants in the standing position. The mean of two consecutive records was used as the measured value.
Diet regimen and physical activity
Prior to starting the intervention, to determine dietary intake, three 24-hr dietary records were conducted on randomly selected day at baseline and at week 12. All participants also kept daily food diaries during the 12-week intervention period and learned about daily nutrition through lectures every week and counseling by the dietitian to encourage weight loss. The food data of the dietary records by experienced dieticians were converted to energy and nutrient data, and the data were analyzed using the Eiyoukun software (Kenpakusya, v. 4.0, Tokyo, Japan). Physical activity was measured by a single-axis pedometer (Lifecorder, Suzuken Co. Ltd., Nogoya, Japan) with previously well-described doubly labeled water 18 and a metabolic chamber. 19 The available subject's data (age, sex, height, and body weight) were entered into the accelerometer for the basal metabolic rate. This accelerometer was designed to detect acceleration along the vertically calculated total energy expenditure from the product of the step rate, acceleration, and basal metabolic rate.
Cardiorespiratory fitness
The participants underwent a maximal graded exercise test on a cycling ergometer (818E, Monark, Stockholm, Sweden) to evaluate cardiorespiratory fitness (VO2max). In specific, following a 2-min warm-up at 0 watt (W); starting at 15 W, workload was increased every 1 min by 15 W until volitional exhaustion. During the test, ventilation and expired gases were measured using an automated gas exchange measuring system (Oxycon α system, Mijnhardt, Breda, The Netherlands), and heart rate was constantly observed during exercise using an electrocardiogram (ECG) monitor (DynaScope, Fukudadenshi, Tokyo, Japan). For diagnosis of VO2max, exercise testing was stopped for any of the following reasons: (1) A rating of perceived exertion >18, (2) if the men achieved >90% of age-predicted maximal heart rate or if the men were too fatigued by pedaling on the bicycle, (3) typical chest discomfort, (4) severe arrhythmias, or (5) more than 1 mm of horizontal of downsloping ST segment depression.
Biochemical analysis
Blood pressure was measured after at least a 20-min rest period using a mercury manometer (Sankei, Japan). Systolic blood pressure (SBP) and diastolic blood pressure (DBP) were both recorded with the average of two measurements separated by at least a 3-min interval. The fasting blood samples in the overnight-fasted state were collected from the antecubital vein into tubes containing either sodium fluoride/EDTA for glucose or into tubes containing no additive for lipids and insulin. Blood samples were put into 8-mL tubes (Venoject II, TERUMO, Tokyo, Japan) containing thrombin- and heparin-neutralizing agents. The tubes were immediately centrifuged at 3000 rpm for 10 min at 4°. For insulin resistance, homeostasis model assessment of insulin resistance (HOMA-IR) was calculated according to the following equation, as described previously 20 : Insulin (μU/mL)×fasting glucose (mg/dL)/405. Plasma TG concentrations were determined by the enzymatic colorimetric method, and plasma free fatty acid was measured by the colorimetric method. Concentrations of ApoAI, ApoAII, and ApoB100 were measured in serum by using immunoturbidimetric assays. LDL-C was calculated according to the Friedewald formula. 21 The inter- and intraassay coefficients of variation were <5% for all blood parameters.
Statistical procedures
All values are presented as the mean±standard error (SE). The data were analyzed using the SPSS 20.0 version for Windows package (SPSS Inc., Chicago, IL). The normality of distribution of the variables was assessed using the Shapiro–Wilks test, and they were used as dependent and independent variables. The Student t-test was used to analyze difference the baseline. A paired t-test was used to analyze change before and after. To analyze the interaction (2 group×2 time) between groups, two-way analysis of variation with repeated measures was performed. Pearson correlation coefficient analysis was used to determine the relationships between the variables. All two-tailed P values less than 0.05 were referred as demonstrating a statistically significant difference.
Results
No participants dropped out of this study during 3-month weight loss. Anthropometric characteristics, dietary record data, and physical activities of subjects before and after a 12-week weight loss intervention are summarized in Table 1. Body weight (approximately minus 7 kg in both groups), percent body fat, and BMI were significantly decreased after weight loss. Moreover, although total caloric intake during the regimen was significantly decreased for both groups (P<0.05), total energy expenditure by walking (pedometer readings) and other physical activities was not different in either group (P>0.05). Also, prevalence of metabolic syndrome significantly decreased in the metabolic syndrome group but not in non–metabolic syndrome group during the 3-month weight loss program, as shown in Table 1.
Data are expressed as the mean (standard error).
Paired t-tests were used to analyze change in parameters before and after weight loss (* P<0.05, ** P<0.001).
Student t-test was used to compare means of parameters between the non-metabolic syndrome and metabolic syndrome groups († P<0.05).
Baseline levels of glucose, SBP, HDL-C, and TGs were significantly different in both groups (P<0.05). Despite differences in these biomarkers of metabolic syndrome, the changes in visceral adipose tissue (VAT) and subcutaneous adipose tissue (SAT) area were not different in either group, as shown in Table 2. Changes in HDL-C and non-HDL-C during weight loss were significant for the group with metabolic syndrome, but not for the non–metabolic syndrome group (Fig. 1). In the metabolic syndrome group, changes in non-HDL-C levels were well correlated with changes in body fat levels (r=0.542, P=0.025). There were no associations between non-HDL and VAT, SAT, and VAT/SAT for each group at baseline. However, there was a significant association between change in non-HDL-C and change in VAT in non–metabolic syndrome group (r=0.541, P=0.025). On the other hand, during weight loss intervention, there was significant association between non-HDL-C and SAT in the metabolic syndrome group (r=0.548, P=0.023). However, there were no associations between change in non-HDL-C and change in VAT/SAT for each group.
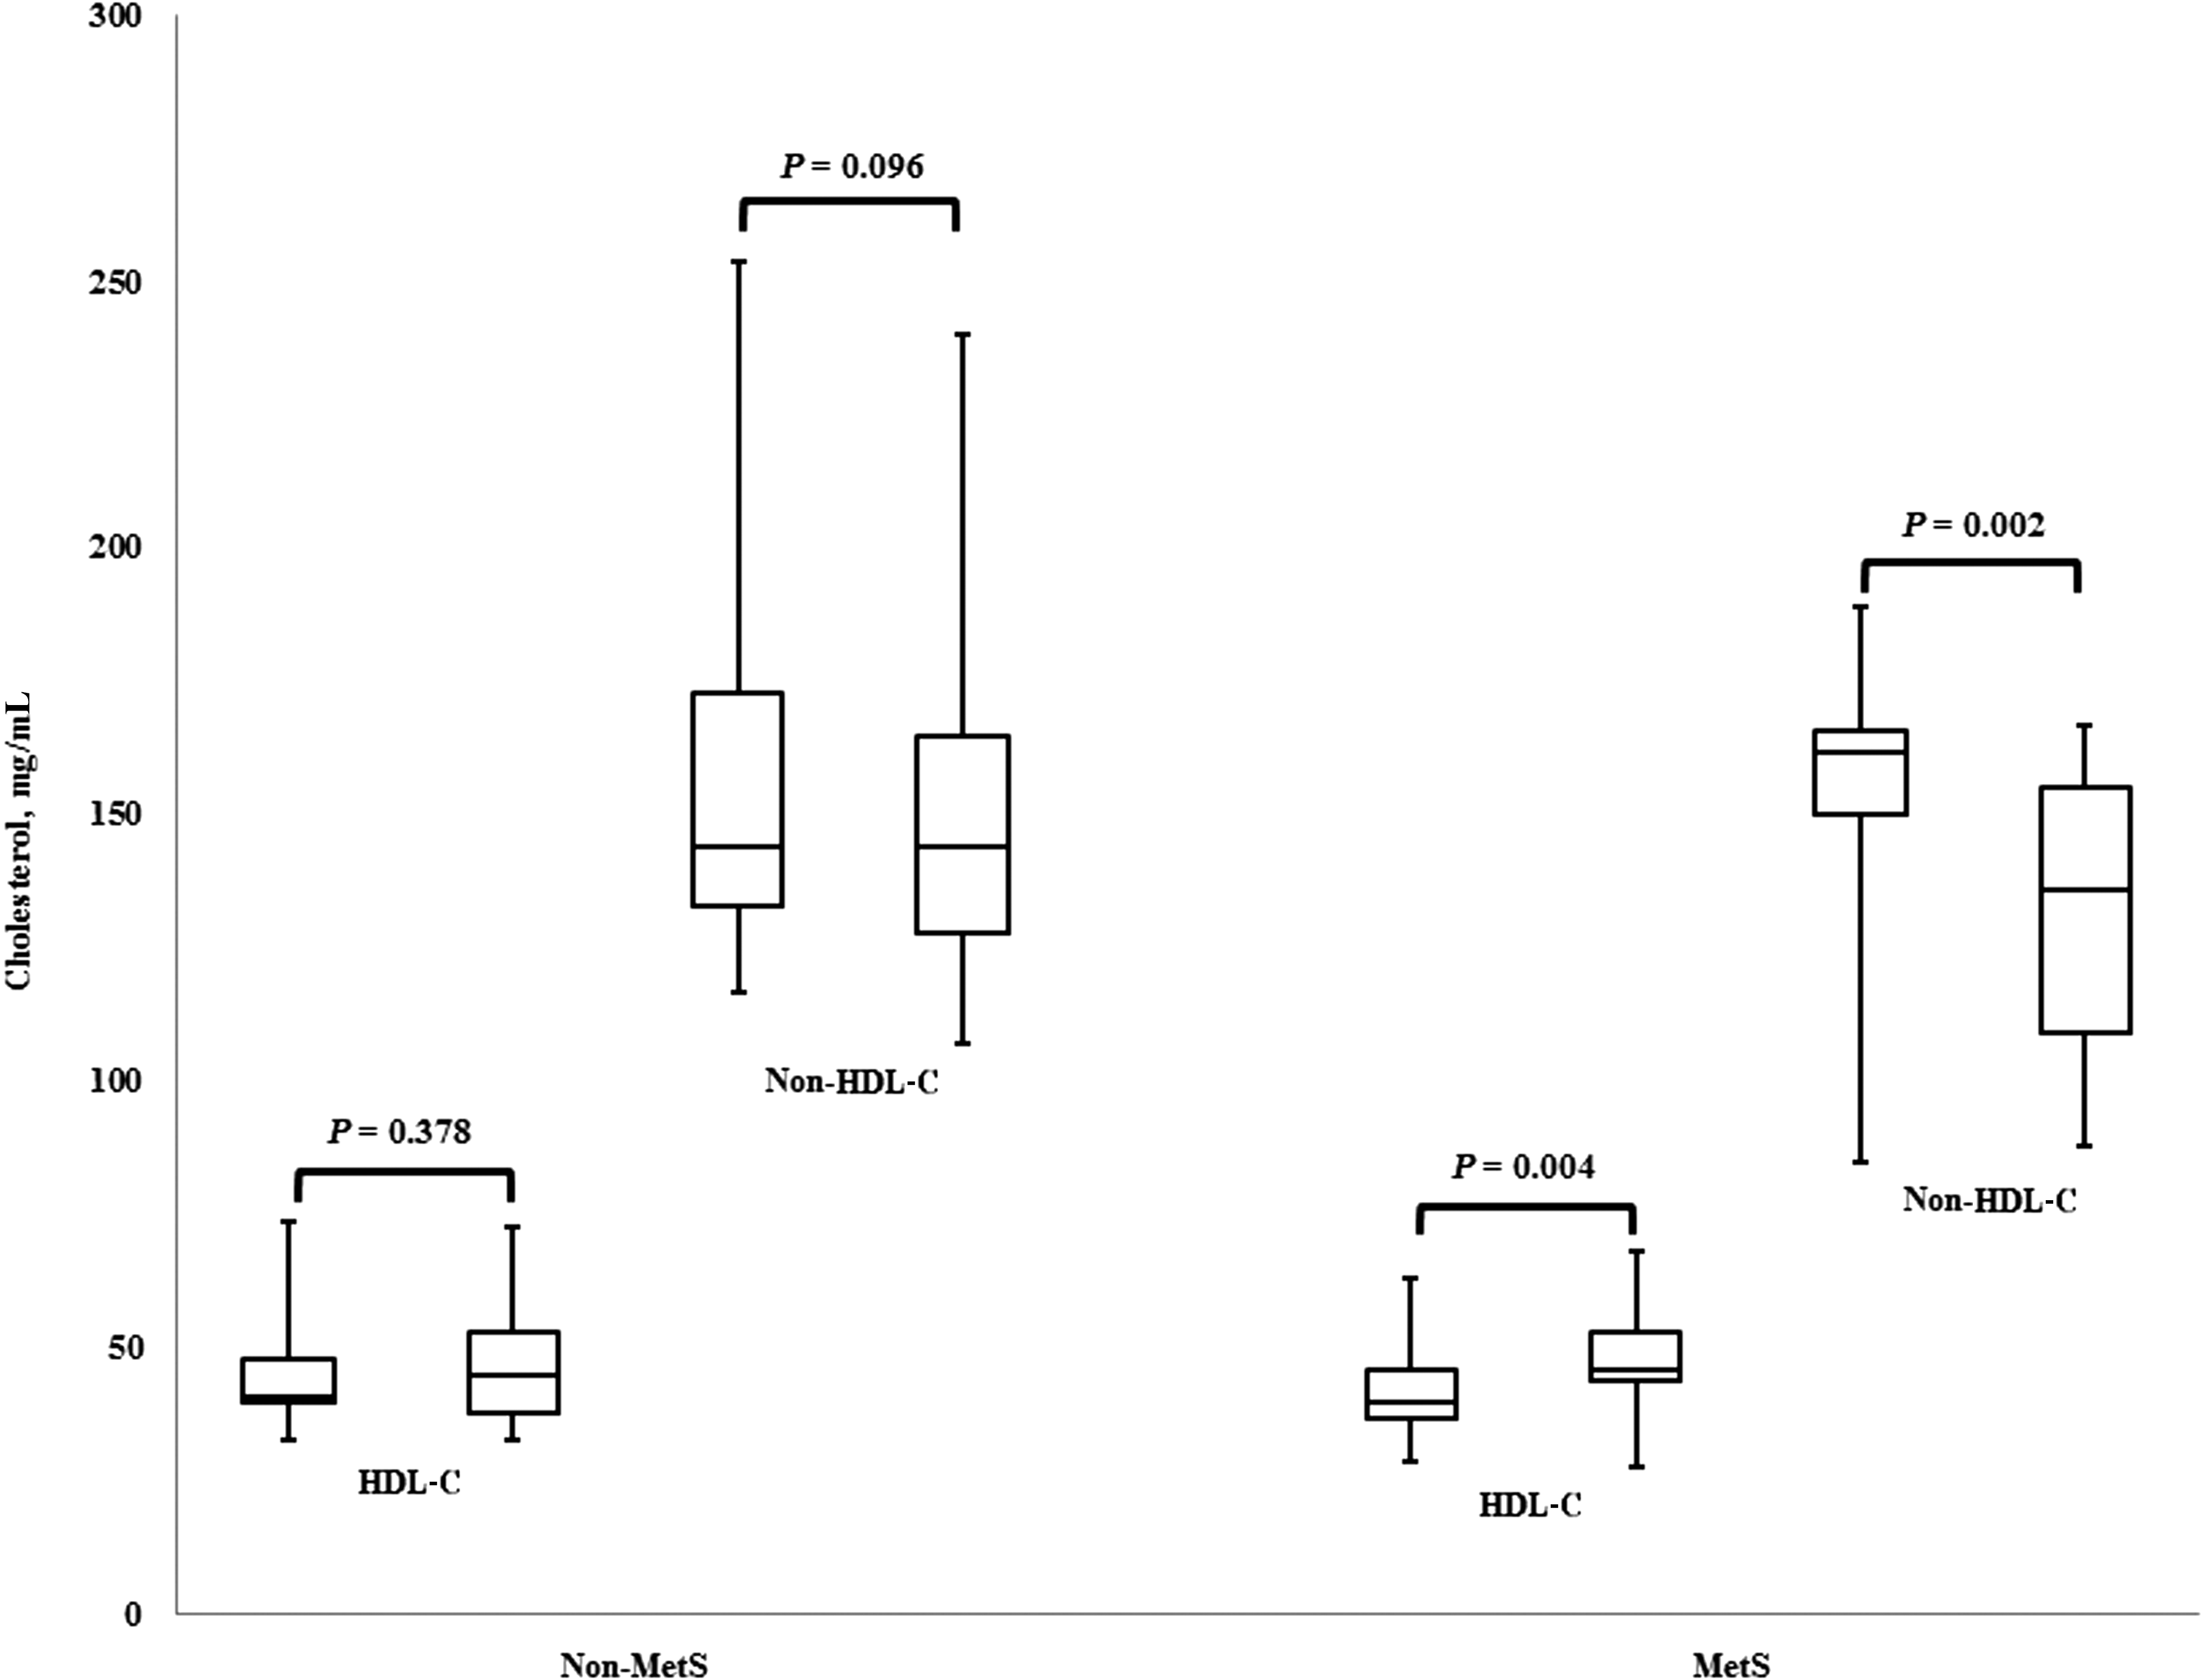
Box plots representation of changes in non–high-density lipoprotein cholesterol (HDL-C) and HDL-C in obese men with and without metabolic syndrome (MetS) after a 12-week, moderately low-calorie diet weight loss program. Each parameter shows pre (left) and post (right), respectively. The inner line indicates the median and the white square indicates the mean. The vertical segments out of the box represent the minimum and the maximum values.
Data are expressed as the mean (standard error).
Paired t-tests were used to analyze change in parameters before and after weight loss (* P<0.05, ** P<0.001).
Student t-test was used to compare means of parameters between the non-metabolic syndrome and metabolic syndrome groups († P<0.05).
HOMA, homeostasis model assessment; TG, triglyceride; LDL-C, low-density lipoprotein cholesterol; AST, aspartate aminotransferase; ALT, alanine aminotransferase; γ-GTP, gamma-glutamyl transpeptidase; VAT, visceral adipose tissue; SAT, subcutaneous adipose tissue.
Levels of ApoAII and ApoB100, but not ApoAI, were significantly decreased in both groups (P<0.05) during weight loss (Fig. 2). However, the Apo100-to-Apo1 ratio was significantly reduced in the metabolic syndrome group (0.812±0.05 to 0.724±0.05, P<0.01) but not in the non–metabolic syndrome group (0.765±0.06 to 0.710±0.05, P=0.104). In the ratio of non-HDL-C to ApoB, the non–metabolic syndrome group significantly changed the 1.506±0.01 to 1.556±0.02 ratio (P=0.009). On the other hand, the metabolic syndrome group did not significantly change the 1.542±0.02 to 1.548±0.02 ratio (P=0.807) during weight loss. Pearson correlation coefficient analysis showed that changes in non-HDL-C levels were strongly correlated with changes in ApoB100 levels (r=0.920, P<0.01) in the metabolic syndrome group. After weight loss, the change in the non-HDL-C level was strongly associated with changes in aspartate transaminase (r=0.609, P=0.009) and alanine transaminase (r=0.708, P=0.001), respectively.
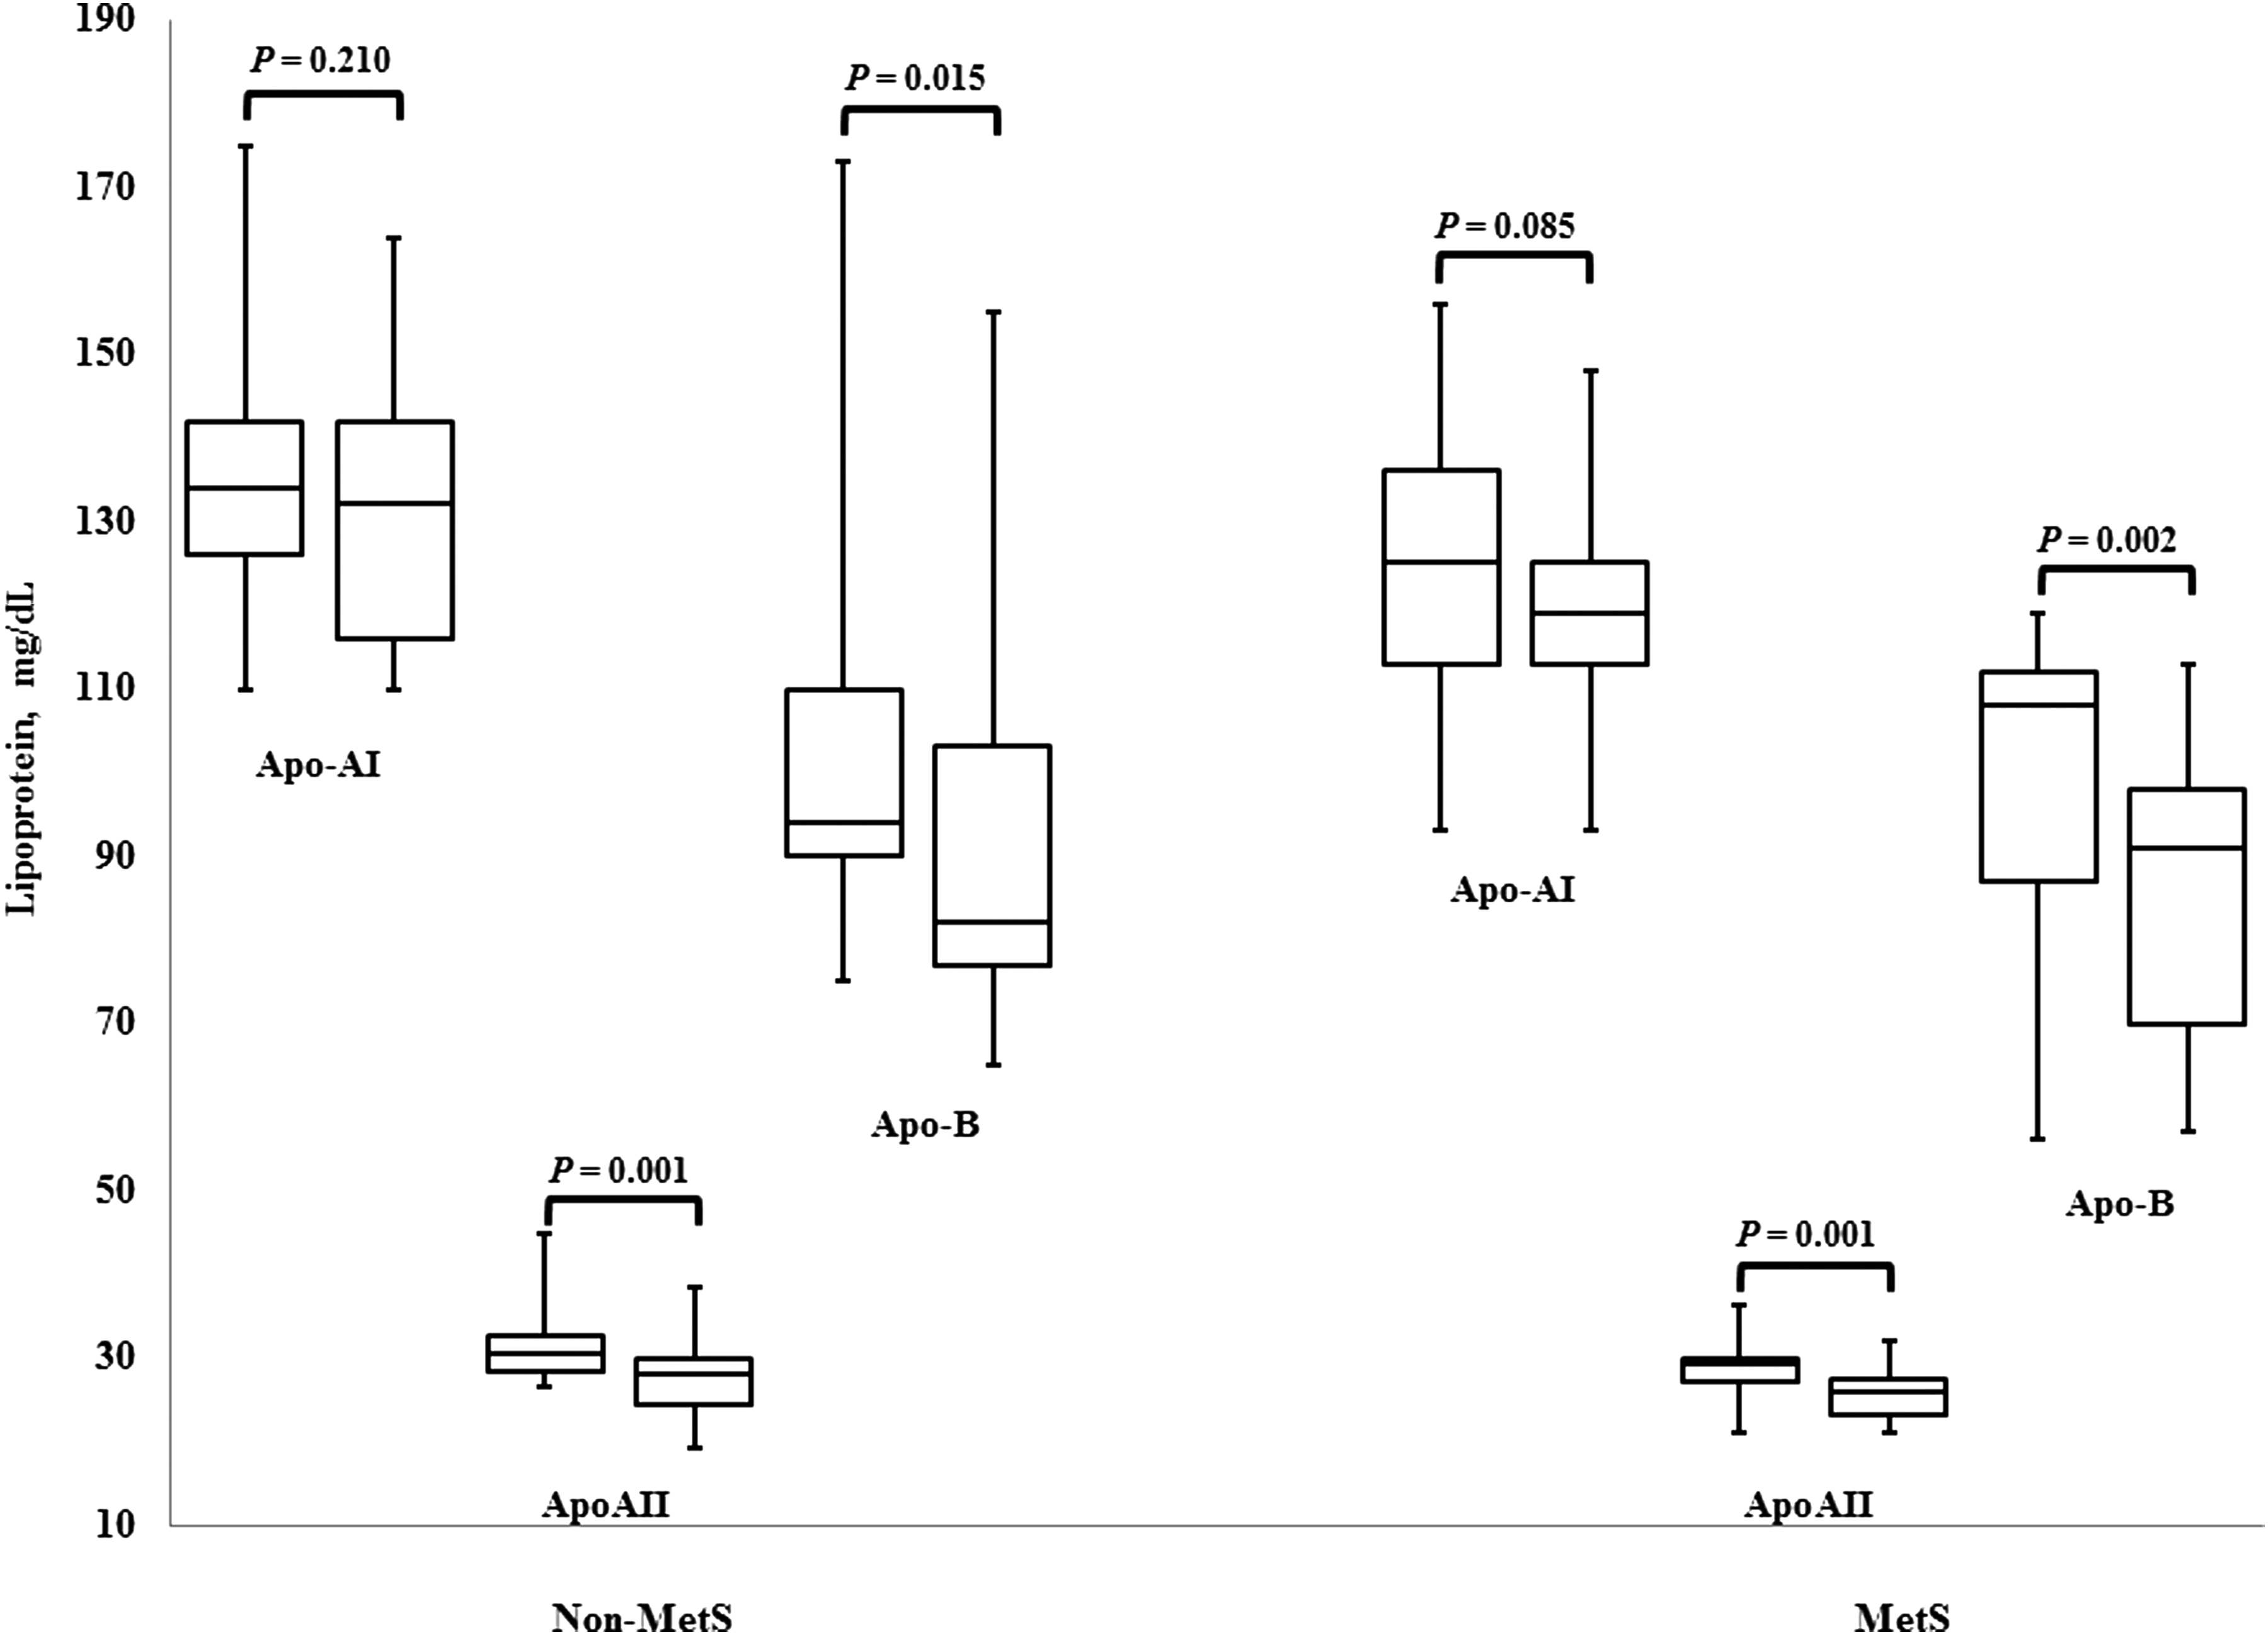
Box plot representation of change in apolipoprotein (Apo) AI, ApoAII, and ApoB100 levels in obese men with and without metabolic syndrome (MetS) after a 12-week, low-calorie diet weight loss program. Each parameter show pre (left) and post (right), respectively. The inner line indicates the median and the white square indicates the mean. The vertical segments out of the box represent the minimum and the maximum values.
In the relationships among lipoproteins, a strong positive correlation was revealed between changes in levels of non-HDL-C and Apo100 (metabolic syndrome group, r=0.920, P<0.001; non–metabolic syndrome group, r=0.976, P<0.001) than those of other lipoproteins, including HDL-C, ApoA1, ApoA11, and LDL-C. In the non–metabolic syndrome group, although changes in non-HDL-C levels from baseline to 12 weeks were significantly decreased with body weight and percent body fat, a significant positive association was not observed for VO2max. However, the change in non-HDL-C significantly correlated with VO2max (r=−0.517, P=0.034) and HOMA-IR (r=0.634, P=0.009) in the metabolic syndrome group (Fig. 3).
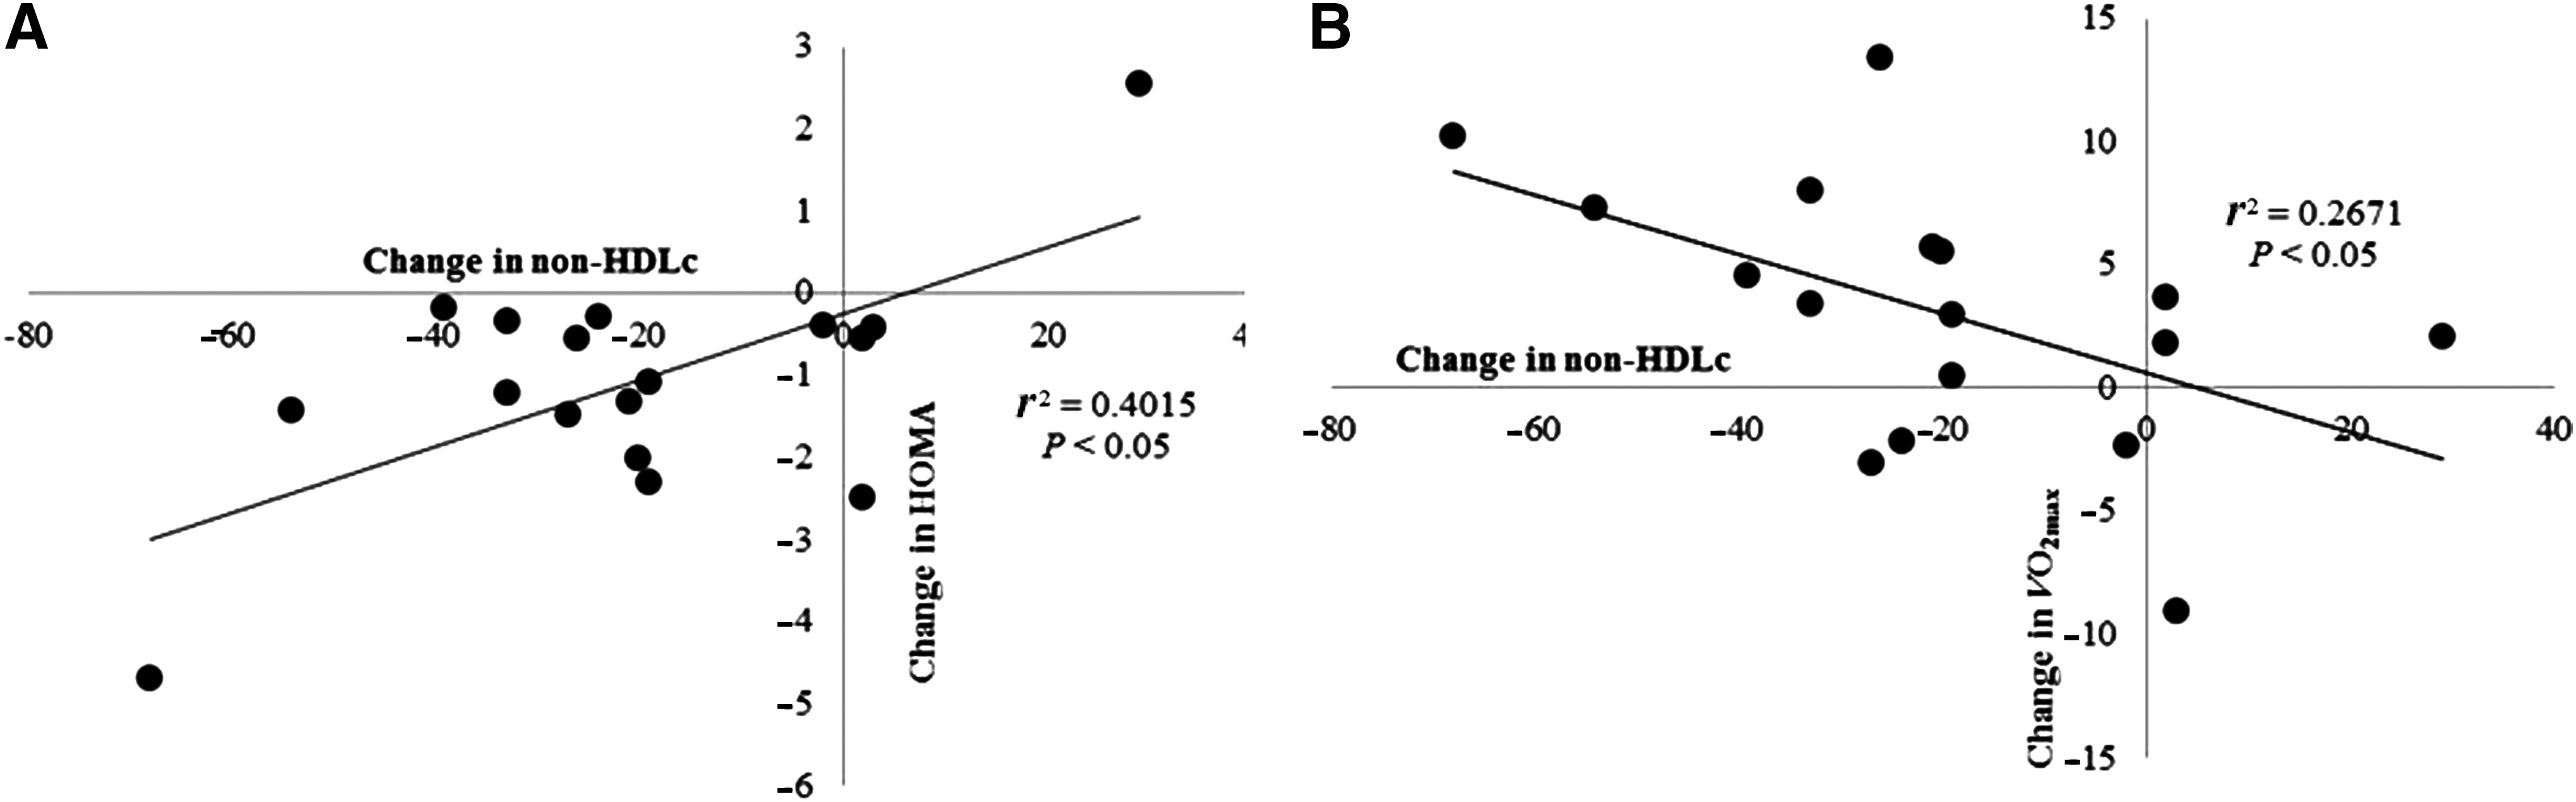
Scatterplots depict correlations between the changes in non–high-density lipoprotein cholesterol (HDL-C) levels and homeostasis model assessment (HOMA)
Discussion
The effects of weight loss on serum lipid and lipoprotein levels in obese subjects have been investigated extensively. To the best of our knowledge, no data have been reported regarding changes in non-HDL-C and ApoB100 levels induced by weight loss in obese subjects with and without metabolic syndrome. As a surrogate marker for all the major atherogenic lipoproteins, non-HDL-C is more useful in predicting the risk of CVD and diabetes than LDL-C. Recently, the monitoring of non-HDL-C levels has been emphasized for control of blood cholesterol levels. The NCEP has recommended that non-HDL-C levels be kept below 130 mg/dL. 22 In clinical primary care, direct reporting of non-HDL-C levels when running standard lipid panels is associated with helping control non-HDL-C levels in CVD and diabetes. 23
The results of the present study suggest that non-HDL-C is an important factor in CVD and diabetes risk. A carefully controlled, 12-week diet-induced weight loss regimen without a change in physical activity resulted in a significant decrease in non-HDL-C levels in obese men with metabolic syndrome. Furthermore, this change in non-HDL-C was associated with cardiorespiratory fitness as well as insulin resistance. The present study interestingly showed the different patterns of non-HDL-C and ApoB100 in obese men with and without metabolic syndrome during weight loss; these patterns are not detectable for other lipoproteins (Figs. 1 and 2). Although ApoB100 is associated with a higher CVD risk than non-HDL-C and LDL-C, 7 –9 the present study revealed that the ApoB100 level was significantly decreased during weight loss regardless of metabolic syndrome status.
ApoB100, an essential component of atherogenic particles, is the primary apolipoprotein component of chylomicrons and LDL, which are responsible for carrying cholesterol to tissues. The INTERHEART and AMORIS studies showed that the ApoB100-to-ApoA1 ratio is more effective in predicting heart attack risk in patients who experienced an acute myocardial infarction. 10,24 Interestingly, unlike Apo100 itself, the ApoB100-to-ApoA1 ratio during weight loss decreased in obese men with metabolic syndrome (0.816±0.05 to 0.724±0.05, P<0.01) in this study. Our study confirmed a previous finding from another group wherein weight loss during a 16-week hypocaloric diet intervention decreased ApoB100 levels and did not change ApoA1 levels in obese men with metabolic syndrome; subjects with non–metabolic syndrome were not included in this study. 25 Although the pattern of apolipoprotein level changes, including those of ApoB100, ApoA1, and ApoA11 were similar in both groups, non-HDL-C levels and the ApoB100-to-ApoA1 ratio revealed a different pattern in obese men with and without metabolic syndrome. Although a significant decrease in body weight and BMI was observed in both groups, non-HDL-C was decreased only in the metabolic syndrome group.
Non-HDL-C levels are calculated by subtracting the HDL-C level from the total cholesterol level. Turley et al. showed that along with a reduction in body weight, consuming a traditional Western diet (36%, 18%, and 43% energy from total, saturated, and carbohydrate, respectively) causes HDL-C levels to drop significantly despite no change in TG levels. 26 Moreover, Goodpaster et al. reported that weight loss using a 16-week, 800- to 1200-kcal per day caloric intake decreased TGs as well as HDL levels in obese men. 27 Marrugat et al. reported a significant, positive relationship between non-HDL-C levels and dietary polyunsaturated fat-to-saturated fat ratio (r=0.18, P<0.05) and alcohol consumption (r=0.17, P<0.05) in 537 healthy men aged 20–60 years. 14 Moreover, a cross-sectional study of middle-aged men (n=629) showed that alcohol consumption was a significant predictor of non-HDL-C levels (r 2=8.0%). 15 Therefore, it is possible that the change in cholesterol level could partly be explained by changes in the intake of total fat and saturated fat and the fatty acid composition of the diet, as well as alcohol consumption. 25,28 Thus, future research on the effects of the intake of a variety foods during a weight loss regimen on the non-HDL level, as well as the level of related components, is warranted.
To date, little information is available regarding the direct relationship between physical fitness and non-HDL-C. A study investigated the effects of physical activity levels on non-HDL-C in obese men. Weight loss improved the VO2max, which is a very strong predictor of mortality. 29 In the present study, changes in non-HDL-C levels during weight loss were strongly correlated with changes in VO2max in obese men with metabolic syndrome. Thus, along with the improvement of VO2max, weight loss may contribute to a reduction in mortality from CVD by non-HDL-C and ApoB100 levels. As shown in previous studies examining the relationship between non-HDL-C and physical fitness, the level of non-HDL-C was significantly decreased in very active subjects, e.g., marathon runners (n=285, 148.64±38.2; mean±standard deviation) compared with that of healthy employees who regularly visited a fitness center (n=252, 171.6±42.9). 14 In addition, in nonsmoking and nondiabetic middle-aged men, age-adjusted non-HDL-C levels decreased significantly with higher physical activity. 15 Although cardiorespiratory fitness was not directly measured, these results imply that physical fitness has an effect on non-HDL-C levels. The present study showed that decreased non-HDL-C levels after weight loss were correlated with a change in cardiovascular fitness in obese men with metabolic syndrome.
Non-HDL-C is composed of LDL-C, very low-density lipoprotein cholesterol (VLDL-C), intermediate density lipoprotein cholesterol (IDL-C), and lipoprotein A cholesterol, 30 making non-HDL-C a suitable marker for ApoB-containing lipoproteins. That is, non-HDL-C is the sum of the cholesterol in all ApoB-containing lipoproteins, and a strong correlation has been shown between non-HDL-C and ApoB100 in this study and in a previous study. 31 In addition, changes in non-HDL-C levels were strongly correlated with changes in ApoB100 levels (r=0.92, P=0.001) during weight loss. Sattar et al. suggest that ApoB100 is more closely associated than non-HDL-C with central adiposity, insulin resistance, thrombosis, and inflammation and adds more to the Framingham Risk Score than non-HDL-C. 32 However, at baseline levels, non-HDL-C or ApoB100 was not different between the two groups in this study. Although non-HDL-C levels during weight loss significantly decreased for all subjects in this study, its level was not decreased in non–metabolic syndrome obese men. Thus, changes in non-HDL levels after weight loss may be affected by metabolic status. In this study, we did not directly measure these atherogenic lipoprotein particles. Thus, future studies are warranted to clarify changes in non-HDL levels as well as related components during weight loss.
Insulin resistance has been associated with CVD. The present study showed that changes in non-HDL-C levels during weight loss were correlated with changes in the HOMA-IR index. A previous study showed that mean non-HDL-C levels in patients with T2DM were significantly higher than those of controls. 17 Despite no significant differences between the groups with respect to glucose metabolism, such as fasting insulin and HOMA-IR index, there were greater decreases in fasting insulin in each group during weight loss. Thus, these results imply involvement of insulin sensitivity in changes of non-HDL-C levels in men with metabolic syndrome. The non-HDL-C levels were affected by HDL-C. To date, the little is direct information about the differences for ethnicity/race on non-HDL-C during weight loss. Although difference of non-HDL-C in ethnicity or race was not directly reported, there are differences in HDL-C concentration among Japanese, black, and white Americans. 33 Also, HDL-C as well as the other risk factors of the metabolic syndrome have turned out differently among ethnic groups including blacks, Hispanics, and whites within males and females. 34 Thus, the results of this study (Asian data) may need to be interpreted cautiously, taking into account ethnicity or race. Thus, a further study related to ethnicity and race along with larger sample size will be needed.
The present study demonstrated the following: (1) non-HDL-C, HDL-C, and total cholesterol levels during a 12-week diet-induced weight loss regimen were significantly decreased in obese men with metabolic syndrome but not in obese men without metabolic syndrome; (2) ApoA11 and ApoB100 levels, but not ApoA1 levels, were significantly reduced during weight loss regardless of metabolic syndrome status; (3) changes in non-HDL-C levels during weight loss were strongly associated with VO2max and insulin resistance in the metabolic syndrome group, but not in men without metabolic syndrome. Reduced non-HDL-C levels during weight loss would be an important factor to be associated with changes in cardiorespiratory fitness and insulin sensitivity. Therefore, improving diet-induced lifestyle as a nondrug therapy is a beneficial regimen for reducing non-HDL-C levels in obese men with metabolic risk profiles.
Footnotes
Acknowledgment
We are very grateful to the subjects for their enthusiastic participation during measurements.
Author Disclosure Statement
No competing financial interests exist.