
Abstract
Background:
The aim of this study was to investigate the agreement between body composition measurements made with two methods—single-frequency bioelectrical impedance analysis (SF-BIA) and bioelectrical impedance spectroscopy (BIS).
Methods:
The body composition measurements using SF-BIA and BIS were performed seven times during 6 months on 41 patients (13 men and 28 women) with metabolic syndrome who were taking part in a dietary intervention study.
Results:
The mean [standard deviation (SD)] fat mass (FM) and median [interquartile range (IQR)] FM% measured with SF-BIA were 32.7 (6.7) kg and 36.3 (30.3–39.3)%, respectively, compared with 38.2 (8.7) kg and 40.9 (35.5–45.6)%, respectively, using BIS. The median (IQR) fat-free mass (FFM) was 60.0 (53.3–73.5) kg according to SF-BIA and 55.4 (48.8–66.5) kg according to BIS. These results obtained with the two methods were significantly different (P<0.001). Still highly significant correlations were found between the results obtained with SF-BIA and BIS for FM and FFM (all r≥0.89, P<0.001). Using Bland–Altman analysis, the bias was found to be −5.4 (4.1) kg for FM, −5.5 (3.7)% for FM%, and 5.4 (4.1) kg for FFM. Rather wide limits of agreement were found for FM, FM%, and FFM.
Conclusion:
Body composition data obtained using SF-BIA and BIS in subjects with metabolic syndrome were highly correlated but not interchangeable. FM was systematically lower when using SF-BIA than when using BIS.
Introduction
A
Body composition can be measured using different techniques, such as bioelectrical impedance analysis (BIA), dual-energy X-ray absorptiometry (DXA), magnetic resonance imaging, and computed tomography. DXA is frequently used as the reference method for this purpose. 6 –10 Radiation techniques show a higher degree of precision than BIA, but they cannot distinguish between intracellular and extracellular fluid. They are also rather expensive and expose the subjects to radiation. In contrast, BIA is a simple, quick, relatively inexpensive, noninvasive, and safe method of estimating body composition with a portable device. 11,12 BIA provides a measure of the total body water content by measuring the resistance or impedance of the body to a small alternating electric current. 13 Different equations, based on model assumptions, are available to estimate the FFM, allowing the FM to be calculated. 11,14 Several BIA methods exist, e.g., single-frequency BIA (SF-BIA), multifrequency BIA (MF-BIA), bioelectrical impedance spectroscopy (BIS), and segmental BIA. 12
SF-BIA measures the bioelectrical impedance at a fixed frequency, normally 50 kHz, whereas MF-BIA uses a wide range of frequencies (from 1 kHz to 1 MHz). The electrodes are placed on the hand and foot, or sometimes on both hands and both feet. The results obtained with SF-BIA and MF-BIA are based on empirical equations. BIS, in contrast, which measures bioelectrical impedance at different frequencies, uses mathematical modeling (e.g., the Cole–Cole model) and mixture equations (e.g., the Hanai formula) to estimate FFM.
Body composition data obtained with BIA techniques and/or DXA have been compared in different groups of subjects, and varying degrees of dissimilarity have been reported but the reasons for this are still unclear. Therefore, further studies are required to investigate possible reasons for the discrepancy between different methods in different groups of subjects. The aim of the present study was to compare SF-BIA and BIS in measurements of FM and FFM over a 6-month period in subjects with the metabolic syndrome.
Materials and Methods
Subjects
Forty-seven Caucasian subjects (15 men and 32 women) with metabolic syndrome were recruited at the Unit for Diabetes Studies, Lund University, Sweden. The criteria for metabolic syndrome defined by the International Diabetes Federation were used. 15,16 The study was conducted according to the guidelines laid down in the Declaration of Helsinki, and the study was approved by the Regional Ethics Review Board in Lund (approval no. 2009/342). Written informed consent was obtained from all subjects. The study was part of a larger study registered in the Clinical Trial Database (no. NCT00992641).
Study design
The present study is part of a multicenter, randomized, controlled dietary intervention study organized by Systems Biology in Controlled Dietary Interventions and Cohort Studies (SYSDIET), the general aim of which is to investigate the effects of an isocaloric diet consisting of healthy Nordic foods on major metabolic abnormalities in subjects with metabolic syndrome. 17 The aim of that study was not to reduce energy intake or induce weight loss. The dietary intervention period was 6 months, during which the subjects visited the study center every 4 weeks for anthropometry and body composition measurements. Because the aim of the present study was to investigate the agreement between two BIA methods, the data obtained at each visit were considered independent.
Anthropometric measurements
Height was measured using a wall-mounted stadiometer to the nearest 0.1 cm. Body weight was measured every 4 weeks with a digital scale to the nearest 0.1 kg, with the subjects wearing light clothing and no shoes. BMI was calculated as weight divided by height squared (kg/m2). WC was measured to the nearest 0.1 cm, at the level midway between the lateral lower rib margin and the iliac crest at the end of gentle expiration with the subject standing, at the beginning of the study and after 3 and 6 months. WC was measured twice and the mean was recorded.
Bioelectrical impedance measurements
Bioelectrical impedance measurements were performed every 4 weeks over 6 months (i.e., at seven occasions including one at the start of the study) using both SF-BIA and BIS in the same order. Before the measurements, the subjects had rested in a supine position for 5 min. Both devices were tetrapolar, and the four electrodes were placed (according to the manufacturer's instructions) on the dorsal surface of the right hand and wrist and the right foot and ankle. The variables studied were body FFM (kg), body FM (kg), and body FM expressed as % (FM%).
The instrument used for SF-BIA (Prenet AB, Malmö, Sweden) operates at a single fixed frequency of 50 kHz. After entering gender, height, and body weight, the instrument provides values of intracellular fluid (ICF) and extracellular fluid (ECF), and values of FFM computed from equations supplied by the manufacturer. Values of FM and FM% were then calculated as follows:
and
The device used for BIS was a Xitron Hydra 4200 (Xitron Technologies, San Diego, CA) instrument, which is a single-channel, tetrapolar BIS device that scans 50 frequencies between 5 kHz and 1 MHz. Mathematical modeling (the Cole–Cole model) and equations formulated from Hanai mixture theory were applied to generate relationships between resistivity and body fluid contents. 18 After entering gender, height, and body weight into the program, values were obtained of ECF and ICF using the instrument's software. The device also computes the ECF:ICF ratio, body cell mass, total body water content, and FFM. FM and FM% were calculated as above (Eqs. 1 and 2).
Statistical analysis
Statistical analysis was performed with IBM SPSS Statistics 22 Software. Descriptive data are expressed as means and standard deviation (SD) or medians and interquartile range (IQR) when nonnormally distributed (as determined by the Shapiro–Wilk test). The Kruskal–Wallis and Friedman tests were used to test differences within more than two groups. Comparisons between two groups were performed using the independent-sample t-test or the Mann–Whitney test, and comparisons of changes within two groups were conducted using the paired-sample t-test or the Wilcoxon test, depending on whether the data were normally distributed. Correlation analyses were performed by calculating the Pearson (r p) or Spearman (r s) correlation coefficient, and P values less than 0.05 were considered to indicate statistically significant differences.
The level of agreement, on an individual level, between results obtained with the two devices was analyzed using the procedure of Bland and Altman. 19 This method calculates the mean difference between two measurements (bias). The limits of agreement between the two methods were defined as the mean difference±2 SD. Regression analysis was performed to test for associations between the mean and mean difference in body composition obtained with the two methods.
Results
Subjects
Five subjects (4 women and 1 man) dropped out during the intervention period. One male participant had a pacemaker and BIA assessments could not be performed. The remaining 41 subjects were included in the statistical analysis—13 men and 28 women. On 18 occasions, measurements were not made with both devices due to practical reasons. Thus, 269 body composition measurements were made using both instruments.
Body composition data
Regarding the physical characteristics of the subjects at baseline, as expected the WC of the men was significantly greater than that of the women, but no significant gender difference in BMI was observed (Table 1). Also as expected, for both SF-BIA and BIS, men had a significantly higher value of FFM (P<0.001) and a significantly lower value of FM (P<0.001) and FM% (P<0.001) than women (Table 2). When data were stratified according to age (<50 years, 50–60 years, >60 years), no significant differences in body composition data between age groups were observed when measured with SF-BIA, whereas significant differences were found between age groups for FM (P=0.004), FM% (P=0.001), and FFM (P=0.001) measured with BIS (Table 3). FM, FM%, and FFM were, as would be expected, also significantly different in different BMI classes (<30 kg/m2, 30–35 kg/m2, >35 kg/m2) (P<0.001) except for FFM when measured with BIS (Table 4).
Significantly different from women, P<0.001.
Significantly different from women, P=0.006.
SD, standard deviation; BMI, body mass index.
Significantly different from the same body composition variable in females, measured with SF-BIA (P<0.001).
Significantly different from the same body composition variable in females, measured with BIS (P<0.001).
SF-BIA, single-frequency bioelectrical impedance analysis; BIS, bioelectrical impedance spectroscopy; SD, standard deviation; IQR, interquartile range; CI confidence interval; n, number of measurements; r p, Pearson correlation coefficient; r s, Spearman correlation coefficient; FM, fat mass; FFM, fat-free mass.
Significantly different from FM (kg) values in other age groups, measured with BIS (Kruskal–Wallis test, P=0.04).
Significantly different from the same body composition variable in other age groups, measured with BIS (Kruskal–Wallis test, P=0.001).
Significantly different from the same body composition variable in other age groups (Kruskal–Wallis test, P≤0.001).
SF-BIA, single-frequency bioelectrical impedance analysis; BIS, bioelectrical impedance spectroscopy; SD, standard deviation; IQR, interquartile range; CI confidence interval; n, number of measurements; r p, Pearson correlation coefficient; r s, Spearman correlation coefficient; FM, fat mass; FFM, fat-free mass.
Significantly different from the same body composition variable in other BMI groups, measured with SF-BIA (Kruskal–Wallis test, P<0.001).
Significantly different from the same body composition variable in other BMI groups, measured with BIS (Kruskal–Wallis test, P<0.001).
Significantly different from the same body composition variable in other BMI groups (Kruskal–Wallis test, P<0.001).
SF-BIA, single-frequency bioelectrical impedance analysis; BIS, bioelectrical impedance spectroscopy; SD, standard deviation; IQR, interquartile range; CI confidence interval; BMI, body mass index; n, number of measurements; r p, Pearson correlation coefficient; r s, Spearman correlation coefficient; FM, fat mass; FFM, fat-free mass.
Age was weakly but significantly correlated to FM and FM% when measured with BIS (Table S1; Supplementary Data are available at
Comparison between body composition data obtained with SF-BIA and BIS
The data for FM and FM% obtained with SF-BIA were systematically lower than the corresponding values obtained with BIS, and consequently the values of FFM were systematically higher. Despite these differences, highly significant correlations were found for FM, FM%, and FFM between the data obtained with SF-BIA and BIS (Table 2, Fig. S1). Similar results were observed when body composition data were stratified according to gender (Table 2) or age (<50 years, 50–60 years, >60 years) (Table 3). When the data were stratified by BMI (<30 kg/m2, 30–35 kg/m2>35 kg/m2), a significant difference and a highly significant correlation were observed for FM, FM% and FFM between the values obtained with SF-BIA and BIS (Table 4).
To further assess the agreement between the two methods, Bland–Altman analysis was performed. The bias between the methods was found to be relatively high, with wide limits of agreement (Table 2, Fig. 1). A proportional bias between the two methods was observed for FM, FM%, and FFM, since linear regression analysis showed that the differences in FM, FM%, and FFM between the techniques increased significantly with increasing FM (r 2 =0.26, P<0.001), FM% (r 2=0.11, P<0.001), and FFM (r 2=0.03, P=0.006) (Fig. 1).
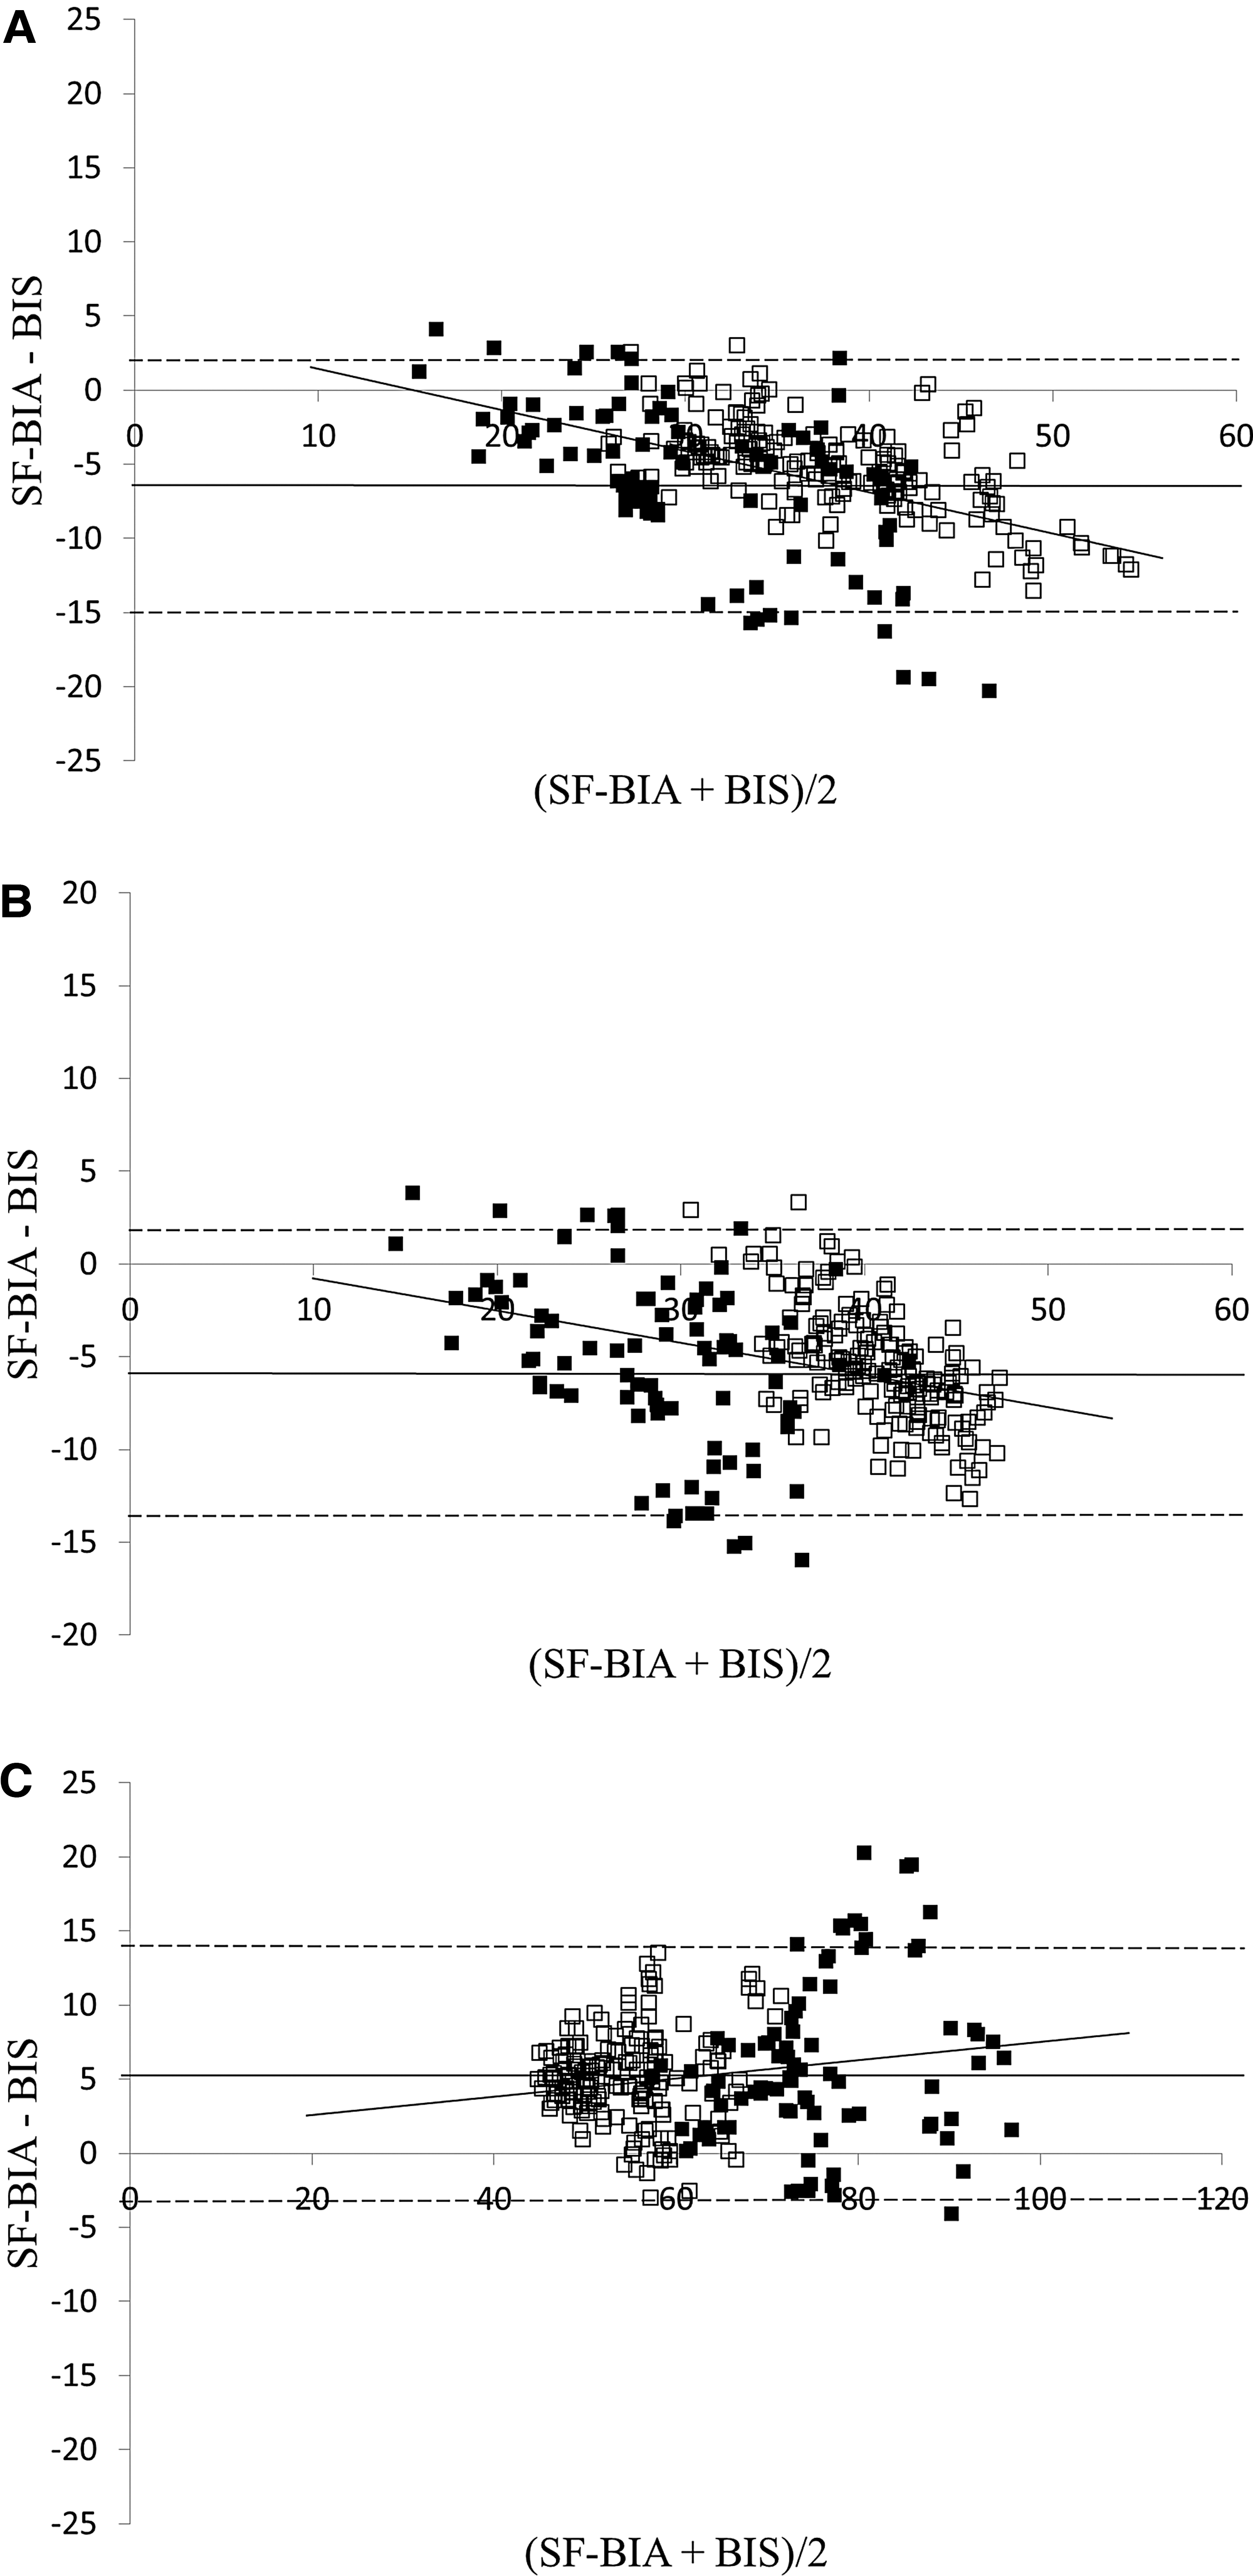
Bland–Altman plots comparing single-frequency bioelectrical impedance analysis (SF-BIA) and bioelectrical impedance spectroscopy (BIS) for fat mass (FM)
The degree of bias in FM, FM%, and FFM was not significantly different for men and women, but the Bland–Altman plots showed narrower limits of agreement in women than in men (Table 2). A significant regression was observed between age and the bias of FM (r 2=0.152, P<0.001), FM% (r 2=0.184, P<0.001), and FFM (r 2=0.152, P<0.001), indicating that the bias in the body composition data was higher in older subjects. Indeed, the lowest bias was found in subjects aged<50 years (Table 3). Moreover, the bias for all three body composition measures was significantly different in the different age groups (P<0.001). A significant regression was also observed between BMI and the bias of FM (r 2=0.072, P<0.001), FM% (r 2=0.032, P=0.003), and FFM (r 2=0.072, P<0.001), showing a lower bias in body composition in subjects with a lower BMI. It was thus observed that the lowest bias was found in subjects with a BMI<30 kg/m2 (Table 4).
Discussion
Much research has been performed on comparisons of body composition results obtained with different techniques and devices. However, it is still unclear which technique or device is most useful to estimate body composition in epidemiological studies or in patient groups in clinical practice, especially in obese subjects. Our results show that SF-BIA underestimated FM and FM% and overestimated FFM compared to BIS. The size of the bias and the rather wide limits of agreement indicate that the results obtained with the two devices are not interchangeable. Ellegård et al. measured the body composition of malnourished cancer patients using DXA and BIS, and concluded that FFM was underestimated by 7.6 kg when using BIS (using standard equations) compared to DXA. 20 Several studies in which BIA was been compared to DXA have shown only a smaller difference in healthy subjects, 21 obese women, 22 patients with short bowel syndrome, 23 hemodialysis patients, 24 and dialysis patients. 25 Thus, many studies have shown varying degrees of agreement between the methods used. However, it is difficult to compare the results of these studies directly to ours, as different devices were used in different study populations.
The bias for all three body composition measures in men and women was similar, indicating that gender does not play a significant role in the difference between SF-BIA and BIS in overweight and obese subjects. Beeson et al. observed a higher correlation between body composition data obtained by DXA and SF-BIA in female than in male subjects. 26 However, the subjects in that study had diabetes mellitus, and had a BMI ranging from 18.5 to >40 kg/m2, which is a broader span than that in our subjects. In obese subjects, Sun et al. reported a statistically significant higher bias in FM% between DXA and MF-BIA in men (4.32%) than in women (2.71%). 21
Body composition changes with age, resulting in a higher FM and a lower FFM in the elderly. 27,28 This was confirmed by our data obtained using BIS. Although the same tendency was observed in the SF-BIA data, no statistically significant differences were found between age groups. Interestingly, the biases in FM, FM%, and FFM increased significantly with age. This is in agreement with results published by Völgyi et al., who reported an increasingly significant difference in FM% between MF-BIA and segmental SF-BIA with age. 29
The bias in FM, FM%, and FFM in subjects with a BMI>35 kg/m2 was significantly higher than that in those with lower BMIs (<30 kg/m2 and 30–35 kg/m2). This means that data obtained with SF-BIA and BIS show better agreement in overweight subjects than in obese ones. This can probably be explained by the fact that the equations used in the software were mainly developed for healthy, normal weight individuals. The results obtained with BIA depend on many factors, such as hydration, the distribution of water throughout the body, and body density. In a normal healthy population, FFM consists of approximately 73% water, and the Hanai equation, used in the BIS instrument to estimate FFM, assumes that the water content of FFM is 73.8%. However, there is evidence that obese people have a relatively higher amount of water in fat-free tissue, which may lead to overestimation of FFM and thus underestimation of FM using BIA. 30,31
One limitation of this study is the lack of a reference method such as DXA. Thus, we cannot state with certainty that our BIA measurements underestimate or overestimate FM or FFM, or which device is most reliable. The present study was part of a large multicenter dietary intervention study in which DXA was not chosen as the method of determining body composition.
The present study was conducted on subjects diagnosed as having metabolic syndrome. 15,16 However, a high BMI or WC does not always indicate that a person is obese or has a higher cardiometabolic risk, and therefore misclassifications may occur. The World Health Organization (WHO) defines overweight and obesity on the basis only of BMI, and there is no generally accepted definition of obesity based on body fat. In a meta-analysis, subjects were identified as obese when their body FM% was >25% in males and >30% in females. 32 According to this definition, all women included in our study were obese, because the lowest measured FM% in the women was 34.4%. However, three male subjects had a FM%<25% together with a BMI≥30 kg/m2 and a WC>100 cm. These observations show that body composition measurements may provide a more accurate method of screening for obesity than BMI and WC, as also recently reported by De Lorenzo et al. 6 In contrast, Hemmingsson et al. support the use of WC and BMI for early detection of female subjects with a high obesity-related risk, because they found that the results obtained with BIA had a lower prediction value. 8
In conclusion, we found that body composition values obtained with SF-BIA and BIS in patients with metabolic syndrome were highly correlated but not interchangeable. FM was systematically lower when measured with SF-BIA than with BIS. The agreement between SF-BIA and BIS was better in younger subjects and in those with a BMI below 30 kg/m2, but was independent of gender.
Footnotes
Acknowledgments
We gratefully acknowledge Jan Lennartsson from Prenet AB (Malmö, Sweden) for providing us with the SF-BIA device. We thank the nurses at the Department of Endocrinology, Skåne University Hospital in Lund, for their excellent technical assistance during the study. L.C. holds a European Society for Clinical Nutrition and Metabolism (ESPEN) research grant.
This work was supported by the Nordic Centre of Excellence on Systems Biology in Controlled Dietary Interventions and Cohort Studies (SYSDIET) (study no. 070014), the Druvan Research Foundation, ESPEN, the European Union (EU) project ECNIS2, and Swedish Research Council for Health, Working Life and Welfare (FORTE).
Author Disclosure Statement
No conflicting financial interests exist.
References
Supplementary Material
Please find the following supplemental material available below.
For Open Access articles published under a Creative Commons License, all supplemental material carries the same license as the article it is associated with.
For non-Open Access articles published, all supplemental material carries a non-exclusive license, and permission requests for re-use of supplemental material or any part of supplemental material shall be sent directly to the copyright owner as specified in the copyright notice associated with the article.