
Abstract
Background:
Metabolic syndrome has been associated with nodular goiter. Our aim was to evaluate which metabolic parameters in elderly patients with metabolic syndrome are associated with thyroid enlargement or increased prevalence of thyroid nodules.
Methods:
In this cross-sectional study, 77 patients >65 years of age with metabolic syndrome were included. We evaluated the presence of thyroid nodules and thyroid volume by ultrasonography and several biochemical, metabolic and anthropometric parameters. Only patients with thyrotropin (thyroid-stimulating hormone, TSH) levels between 0.3 and 6 mU/L were included. We further divided subjects into two groups—type 2 diabetes mellitus (T2DM) and non-T2DM and established comparisons between them.
Results:
Among all parameters analyzed we found a significant correlation between glycated hemoglobin (HbA1c) and volume (r=0.261, P=0.027) or number of nodules (r=0.266, P=0.023). Neither sex, age, body mass index (BMI), metformin, nor levothyroxine use were associated with thyroid volume or nodularity. Within the whole cohort, those patients with T2DM had larger thyroid volumes compared to non-T2DM [median (confidence interval, CI) 6.976 (5.220–10.789) vs. 5.034 (3.796–6.034) mL, P<0.008). Furthermore, a larger proportion of T2DM patients presented thyroid volumes >5.8 mL [69 vs. 23%, P<0.001; odds ratio=7.25 (CI 2.04–25.56)].
Conclusions:
In elderly patients with metabolic syndrome, worse metabolic control, represented by higher HbA1c levels, was found associated to increased prevalence of thyroid nodules and larger thyroid volume. Moreover, within the whole metabolic syndrome group, patients with T2DM had the largest thyroid volumes
Introduction
A
With regard to insulin resistance in particular, several mechanisms have been proposed to explain an increase in cellular proliferation. The first includes an activation of the mitogen-activated protein kinase (MAPK) pathway as a result of the hyperinsulinemia necessary to overcome the inhibition and restore the phosphatidylinositide 3-kinase (PI3K) pathway that participates in the glucose regulatory effects by insulin and is often inhibited in the insulin-resistant state. 2 Second, insulin can act indirectly on tumorigenesis by modulating the insulin-like growth factor (IGF) system. An increase of insulin levels leads to binding of insulin to IGF-binding proteins (IGFBPs) with the consequent displacement and increased levels of free IGF1. Insulin resistance is also associated with higher synthesis of IGF1 with lower synthesis of IGFBPs in the liver, leading to higher levels of bioactive IGF1. 3 Notably, a positive association between insulin resistance and thyroid nodular disease has been recently described. 4 Moreover, an increased incidence of thyroid cancer in patients with type 2 diabetes mellitus (T2DM) has been also reported. 5 These findings can be attributed to the fact that tumors express more receptors to both insulin and IFG. Thyroid cancer as well as cancers from the rest of the organism overexpress IGFI, IFG II, and isoforms of the insulin receptor (IR) such as IR-A, an isoform that is more tumorigenic. 6
Larger thyroid volume and nodularity have been also reported in patients with metabolic syndrome. 7 Metabolic syndrome, which is closely related to both insulin resistance and T2DM, 8 is so frequent in older adults 9 that it could be useful to know which of the parameters associated with metabolic syndrome are best related to thyroid proliferation. This may help to distinguish which elderly patients with metabolic syndrome should be evaluated for thyroid structure abnormalities. Therefore, our aim was to analyze the association of different parameters related to metabolic control and thyroid volume and nodularity in elderly adults with metabolic syndrome.
Subjects and Methods
Subject study
The study was a prospective, nonconsecutive, single-center, cohort study with a cross-sectional analysis of the data. Patients from an iodine-sufficient area who presented to an endocrinology center were included. The protocol was approved by the ethics committee for human studies of the Milstein Hospital of Buenos Aires. All participants gave a written voluntary consent to participate.
In a period spanning from July, 2011, to December, 2012, 77 out of 90 patients were recruited. To be included in the study, participants had to meet the following criteria: (1) Age ≥65 years old; (2) thyrotropin (thyroid-stimulating hormone, TSH) and thyroid hormones within the normal range for elderly patients [TSH levels between 0.3–6 mU/L and free thyroxine (T4) between 0.7 and 1.8 ng/dL]; (3) metabolic syndrome (defined by three of the five following criteria) 10 : (i) waist circumference (WC) (for European population) ≥94 cm for men, and ≥80 cm for women, (ii) elevated triglycerides (TGs) ≥150 mg/dL, or drug treatment for elevated TGs, (iii) reduced serum high-density lipoprotein cholesterol (HDL-C) <50 mg/dL for men and <40 mg/dL for women or drug treatment for reduced HDL-C, (iv) elevated blood pressure [systolic (SBP) ≥130 and/or diastolic (DBP) ≥85 mmHg or antihypertensive drug treatment in a patient with a history of hypertension, and (v) elevated fasting glucose ≥100 mg/dL or drug treatment for elevated glucose as an alternate indicator. Exclusion criteria included patients who had not signed the informed consent and patients under insulin treatment.
Subject interview
All eligible patients were interviewed by two certified endocrinologists at our institution. Patients gave information about their personal medical history, intake of medication, smoking habit (present or past), physical activity, diet, and family history of diseases (hypertension, cardiovascular, thyroid, dyslipidemia, diabetes). Personal history of T2DM was defined by self-report, medical report on the clinical history, or intake of antidiabetic medication.
Clinical and anthropometric assessment
Arterial tension was measured three times with a sphygmomanometer with an interval of at least 1 min while the patient was seated. Measurements were taken on both arms. A mean value was calculated for a final result.
Measurements of the subject`s height and weight were done without shoes and cap and with a manual scale. WC was measured at the natural waistline with a folding tape. Body mass index (BMI) was calculated by dividing weight (kg) by the square of height (cm). A BMI value between 25 and 29.9 defined overweight patients, a BMI between 30 and 35 defined mildly obese patients, a BMI between 35 and 40 defined moderately obese patients, and a BMI>40 defined severely obese patients.
Evaluation of thyroid gland morphology
The thyroid gland was evaluated by ultrasound in all patients, lying supine using the same probe, a 7.5-MHz high-frequency linear transducer (Mindray DC-3). The ellipsoid formula [volume (mL)=depth (cm)×length (cm)×width (cm)×0.479] was used to calculate thyroid volume (each lobe separately) as well as nodule size. 11 Solid nodular lesions on ultrasound ≥3 mm and mixed lesions ≥5 mm on the largest diameter were considered as thyroid nodules. Pure cystic lesions were not considered.
Biochemical evaluation
Blood venous samples were taken between 8 and 8:30 AM after a fasting period of 12 hr. Thyroid function was evaluated by measuring: TSH [coefficient of variation (CV) 8.2%], free T4 (CV 5.2%), and the antibody anti-thyroid peroxidase (TPOAb) (CV 10.0%) determined by immunochemiluminescent assay with an automatic analyzer (IMMULITE 1000, Siemens).
Metabolic parameters evaluated were: (1) Glycemia (range values [RV] 70–110 mg/dL), determined using an enzymatic colorimetric assay (Cobas 311, Roche); (2) glycated hemoglobin (HbA1c) (RV 4.8–5.9%), determined by immunoturbidimetric assay (Cobas 311, Roche); (3) insulin (RV up to 17 μIU/mL), determined by chemiluminescent immunometric assay (IMMULITE1000 Siemens) (CV 4.9%); (4) TGs (RV 40-150 mg/dL) enzymatic colorimetric assay (CV 2%); (5) HDL-C [RV, M with low cardiovascular risk (CVR) >55, moderate CVR 35–55, high CVR <35; female, low CVR >65, moderate CVR 45–65, high CVR <45 mg/dL] homogeneous colorimetric assay (CV 2.5%); (6) total cholesterol (RV normal <200, borderline 200– 239, high >239 mg/dL) enzymatic colorimetric assay (CV 2.5%); and (7) low-density lipoprotein cholesterol (LDL-C) (RV, normal <100, borderline 100–129, intermediate 130–159, high >160 mg/dL) calculation by the Friedwald formula or homogeneous assay by (Cobas 311, Roche) (CV 2%). For the assay of albuminuria, the second sample of morning urine was tested by immunochemiluminescent assay IMMULITE 1000 Siemens (CV 8.3%; VR to 30 mg albumin/gram creatinine).
Insulin resistance was defined by three different indexes: (1) homeostasis model assessment of insulin resistance (HOMA-IR) index, calculated as: [fasting serum insulin (μUI/mL)×fasting serum glucose (mmol/L)]/22.5 (RV <2.5) 12 ; (2) TGs/HDL-C index (RV<3.5) 13 ; (3) quantitative insulin sensitivity check index (QUICKI) calculated as: 1/(log serum insulin+log serum glucose) (0.67–0.74 for reference population and 0.41–0.52 for diabetic patients). 14
Statistical analysis
Results are expressed as median and range and as means±standard deviation (SD). Both Pearson and Spearman correlation tests were used for parametric and nonparametric distribution data. The Student t-test for independent samples, Mann–Whitney test for independent samples, and chi-squared test were used to compare the T2DM versus non-T2DM groups. A P value <0.05 was considered statistically significant. The cutoff value for thyroid volume was calculated by receiver operating characteristic (ROC) curve.
Results
Study population
Seventy-seven patients were finally included in the study. The female preponderance was marked: 67.5% were women (n=52), 32.5% were men (n=25). Mean age was 72.78±6 years old, median and range was 72 (65–89) years old. Only four of the 77 patients were former smokers.
All participants met criteria for metabolic syndrome: 42.9% of them had three components of metabolic syndrome, 33.8 % had four components, and 23.4% had five components. BMI was (mean±SD) 32.6±5.4. Out of 77 patients, 32.5% had a BMI between 25–29.9, 35% had BMI values between 30–35, 22% 35–40, and 9% >40. Only 1.5% of participants had normal weight.
With regard to abdominal circumference, 98.7% of participants exceeded the cutoff for a European population, with (mean±SD) 105.5±10.4 cm, without significant differences between genders (105 cm for men and 106 cm for women; P=0.919).
Metabolic parameters
Metabolic parameters of the whole group were (mean±SD): Glycemia, 130.3±41 mg/dL; insulinemia, 12.7±21.1 μUI/mL; HbA1c, 7.2±1.6 mg/dL; total cholesterol, 192.4±49.1 mg/dL; LDL-C, 120.1±39.6 mg/dL; HDL-C, 47.6±13.2; and TGs, 165.5±98.7 mg/dL (Table 1).
The insulin sensitivity indexes calculated were as follows: HOMA-IR, 4.03±6.6; QUICKI, 0.3±0.04; and TGs/HDL-C, 3.9±3.1. Eighty percent of participants had T2DM (n=60) and 20% were nondiabetic (n=17). Mean HbA1c was 7.6±1.6 mg/dL and 5.9±0.6 mg/dL, for diabetic and nondiabetic participants, respectively (P=0.001).
Thyroid function and morphology
TSH levels (mean±SD) were 2.36±1.4 mU/L, and free T4 1.1±0.15 ng/dL (Table 1). A total of 41% of the patients were TPOAb positive. Twelve patients were on levothyroxine and 35 were on metformin; however, TSH and free T4 values were similar to the rest of the population. In the whole metabolic syndrome group, the volume of the thyroid gland was median (range) 6.278 (1.236–25.398) mL, calculated by the ellipsoid formula (Table 1). Of all participants, 66% had thyroid nodules on ultrasound. The median number of nodules was one (range 0–5). We looked for a relationship between the number of components and thyroid volume, but no difference was found comparing volumes among the three groups of patients with three, four, and five components.
To evaluate the influence of other parameters (age, sex, BMI, insulin resistance indexes, TPOAb, metformin use) over thyroid nodules or volume, we performed a univariate analyses and did not find any significant correlation between them. Surprisingly, we found a negative correlation between TSH and thyroid volume (r=−2.81, P=0.013). No difference was observed between high or normal BMI or TPOAb-positive or -negative patients with regard to thyroid volume.
When analyzed by Spearman correlation, there was a significant association between the number of nodules and HbA1c (r=0.266; P=0.023), and between thyroid volume and HbA1c (r=0.261; P=0.027) (Table 2). As expected, HbA1c levels had a significant correlation with glycemia, log-HOMA, and QUICKI by the Pearson test (r=0.644, P<0.01; r=0.238, P=0.037; r=−0.253, P=0.026; respectively), and a significant association with microalbuminuria, by the Spearman test (r=0.456; P<0.01).
The comparison between T2DM versus non-T2DM patients showed that levels of HbA1c were 7.6±1.6, and 5.9±0.6 mg/dL, respectively (P=0.001), with (mean±SD) 7.2±1.6 mg/dlL Diabetic patients had significant larger thyroid volumes than nondiabetics [median interquartile range (IQR) 6.976 (5.220–10.789) mL vs. 5.034 (3.796–6.034) mL, respectively, P=0.008], by analysis of Mann–Whitney test 268.500 Z-2.639 (Fig. 1). The ROC curve showed that a thyroid volume >5.8 mL could best divide the population of T2DM versus nondiabetics with an area under the curve (AUC) value of 0.713 (P=0.018). Using this cutoff for thyroid volume, we found that 69% of T2DM patients had a thyroid volume larger than 5.8 mL compared to only 23% of those who were nondiabetics (P<0.05 by chi-squared test [odds ratio (OR)=7.25; confidence interval (CI) 2.04–25.56; P<0.01) (Fig. 2).
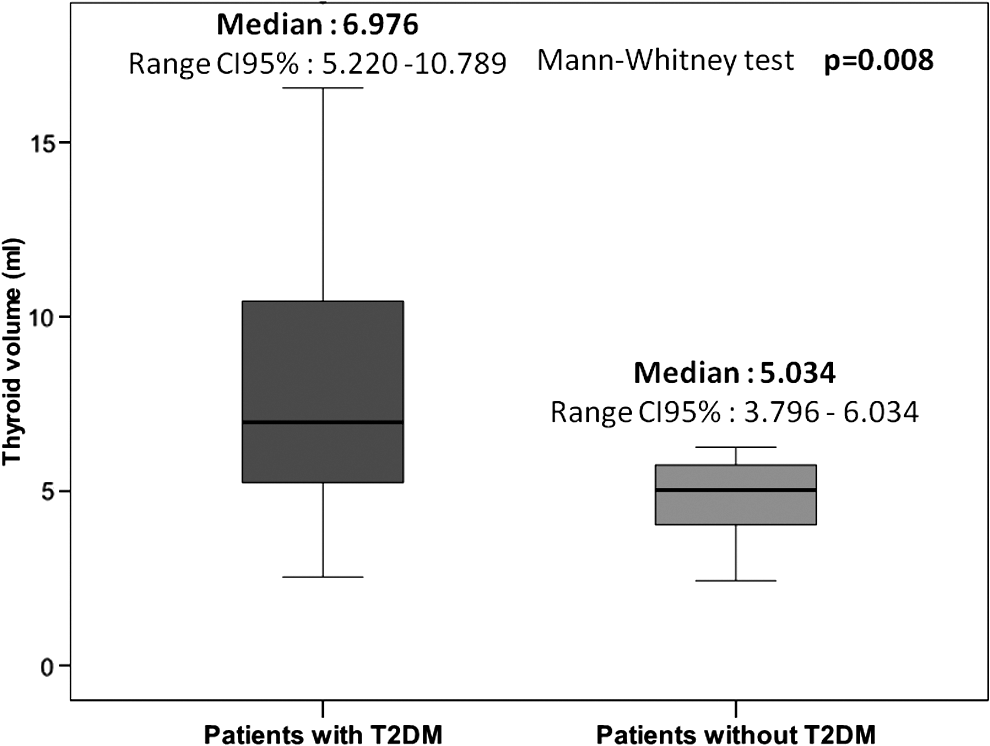
A higher thyroid volume was observed in type 2 diabetes mellitus (T2DM) patients with metabolic syndrome. CI, confidence interval.
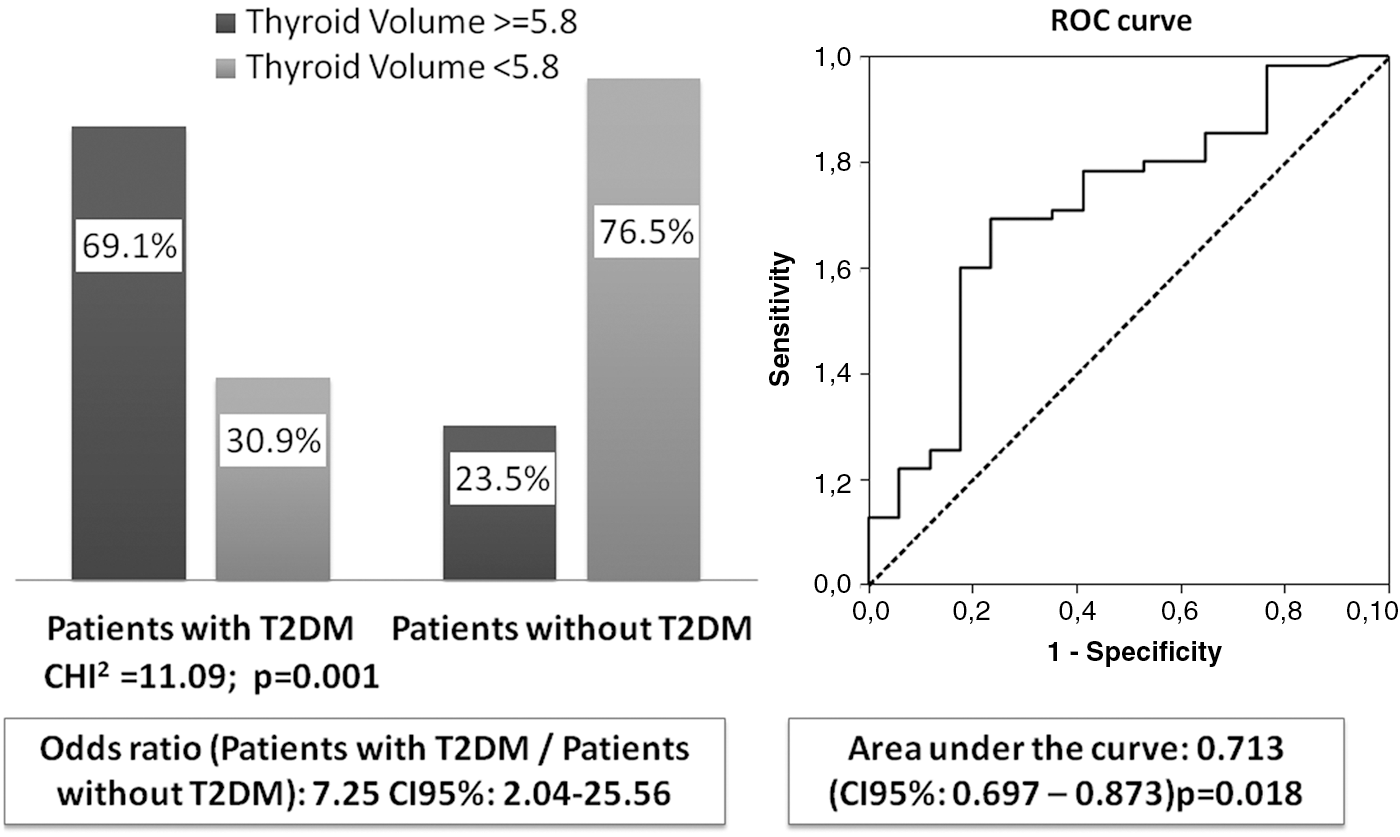
A larger proportion of type 2 diabetes mellitus (T2DM) patients with thyroid volume >5.8 mL was found compared to non-T2DM patients. ROC, receiver operating characteristic; CI, confidence interval.
Discussion
Our findings suggest that worse metabolic control, reflected by higher HbA1c levels, is associated with an alteration of thyroid morphology and could be a risk factor for nodule formation and thyroid tissue growth in elderly patients with metabolic syndrome. Moreover, T2DM patients identified within this particular population have larger thyroid volumes than their non-T2DM counterparts. This is the first report of its kind in an elderly population.
The metabolic syndrome is a cluster of risk factors characterized by abdominal obesity, high blood pressure, high serum TGs, low HDL-C, and glucose abnormalities. Both metabolic syndrome and T2DM, are associated with insulin resistance, which is a key factor in the pathogenic process of different tumors.
Rezzonico et al. were the first to describe in 2008 an association between insulin resistance and higher volume or frequency of thyroid nodules in a group of 111 women evaluated with ultrasonography. 4 In their description, they noted, “Thyroid gland, another victim of the insulin resistance syndrome,” thus illustrating in the clinical arena the long-known observation of induced thyroid proliferation by insulin and IGF1 from the basic research field. 15,16 In 2009, Ayturk et al. 7 compared a group of metabolic syndrome subjects (n=278) to a matched group without metabolic syndrome and found that thyroid volume was higher and the proportion of patients with thyroid nodules larger in the metabolic syndrome group. These findings were in agreement with those of Rezzonico et al. 17 and opened a new era of research with potential therapeutic options, such as metformin use, to reduce nodule formation and cancer growth. 18,19
It is well known that thyroid nodular disease increases with age and that age itself is considered a risk factor for thyroid cancer. 20 Therefore, it is worth trying to identify other parameters, such as metabolic syndrome, that in combination with the “ticking of the clock” could play a role in the development of thyroid tumors. On the other hand, it is still not known if metabolic syndrome in the elderly has the same implications as in younger individuals. In old age, insulin resistance, hypertension, dyslipidemia, and obesity are frequently encountered; thus, the metabolic syndrome can be interpreted as part of the aging process. In this regard, our findings of larger thyroid volumes in subjects with worse metabolic control indicate that there might be different profiles among elderly metabolic syndrome patients. The fact that within the metabolic syndrome elderly patients those with T2DM had higher thyroid volumes is in agreement with this notion.
Other groups 21 –23 have also shown an association of thyroid morphological abnormalities in patients with T2DM and prediabetes. However, in T2DM, factors other than insulin resistance could be playing an alternative role in goitrogenesis. As a matter of fact, although insulin resistance has been consistently involved in the pathogenesis of thyroid tumors, 4,7,24 we did not find any association between insulin sensitivity parameters and thyroid volume or nodularity in our study. Possible explanations to these negative findings might lie in a different pathophysiological pathway taking place in T2DM. It has been shown in rodents that high glucose levels increase thyroid oxidative stress enzymes, which could well correlate with higher proliferation rate. 25 This is in line with what has been also described as chronic low-grade inflammation exerted by interleukin-6 (IL-6), tumor necrosis factor-α (TNFα, and nuclear factor-κB (NF-κB) responsible for thyroid tumorigenesis in obesity. 1 Furthermore, the combination of all of these risk factors acting together with insulin resistance could be a partial explanation for the increased prevalence of thyroid cancer reported in diabetic patients when compared to the rest of the population. 5
Our findings suggest that worse metabolic control, reflected by higher HbA1c levels, is associated with an alteration of thyroid morphology and could be a risk factor for nodule formation and thyroid tissue growth in elderly metabolic syndrome patients. Moreover, T2DM patients identified within this particular population have larger thyroid volumes than their non-T2DM counterparts. With regard to the lack of an association between insulin sensitivity indexes and thyroid volume or nodularity, we have to acknowledge that the entire population is already insulin resistant. A metabolically healthy control group would have been useful for comparing the effect of insulin excess on the thyroid gland. In conclusion, these results provide evidence that worse metabolic control in elderly patients with metabolic syndrome is associated with an alteration of thyroid morphology and could be thus a risk factor for nodule formation and thyroid tissue growth in this population.
Footnotes
Acknowledgements
We thank the staff members of the Radiology Department, especially Mrs. Maria Ines Milanesi.
Author Disclosure Statement
No competing financial interests exist.