




Abstract
Background:
Polyunsaturated fatty acids (PUFA) have been reported to be beneficial on some components of the metabolic syndrome (MetS). We tested the hypothesis that in hypertensive patients, presence of MetS and its related components is associated with cell membrane content of PUFA, a measure that reflects the dietary intake of these fatty acids.
Methods:
In 55 consecutive patients with primary hypertension referred to our university center, we measured anthropometric variables, 24-hour ambulatory blood pressure, general biochemistries including plasma lipids, and the fatty acid composition of red blood cell (RBC) membrane by gas chromatography.
Results:
The prevalence of the MetS was 36.4% and in hypertensive patients with MetS, the RBC membrane content of total PUFA, PUFA of the n-6 family (n-6 PUFA), PUFA of the n-3 family (n-3 PUFA), polyunsaturated to saturated fatty acid ratio (PUFA/SFA), and omega-3 index was significantly lower than in patients without MetS. RBC membrane total PUFA, n-6 PUFA, n-3 PUFA, PUFA/SFA ratio, and omega-3 index were significantly and directly correlated with high-desity lipoprotein (HDL) cholesterol levels, a correlation that did not differ across tertiles of plasma apolipoprotein-A1. In multivariate linear regression analysis, HDL-cholesterol resulted to be directly and independently related to RBC membrane n-6 PUFA, PUFA/SFA ratio, and omega-3 index. Conversely, total cholesterol to HDL-cholesterol ratio had inverse and independent relationship with n-6 PUFA, PUFA/SFA ratio, and omega-3 index.
Conclusions:
In patients with hypertension the MetS is associated with lower cell membrane content of PUFA that is explained by a direct and independent relationship of membrane PUFA with HDL-cholesterol. This observation suggests reduced dietary intake of PUFA in these patients that might contribute to their cardiovascular risk.
Introduction
T
Dietary supplementation of polyunsaturated fatty acids (PUFA) has been shown to impact favorably on some components of the MetS in the general population 5 and in patients with high cardiovascular risk. 6 Beneficial effects of PUFA could be attributed to lowering of plasma lipids and blood pressure, 7 –9 improvement of glucose metabolism, 10 and reduction of subclinical proinflammatory state. 11 Nonetheless, studies that have investigated the effects of PUFA supplementation on cardiovascular risk factors and cardiovascular outcomes have yielded inconsistent results. 12 –14
Because fatty acids are normal constituents of cell membranes, measurement of fatty acids composition and calculation of the ratio of polyunsaturated to saturated fatty acid components (PUFA/SFA) in red blood cell (RBC) membranes reflects the fatty acid content of the diet 15 and has been used as a reliable biomarker of fatty acid intake in epidemiological studies. 16 We have recently reported that the RBC membrane content of PUFA of the n-3 family (n-3 PUFA) affects the vascular response to vasodilators 17 and that a diet rich in PUFA that increases the n-3 PUFA content of RBC membrane decreases 24-hour blood pressure levels 18 and the carotid intima-media thickness in hypertensive patients. 19 In this study, we tested the hypothesis that the RBC membrane content of PUFA reflecting dietary consumption of these fatty acids is associated with the presence of the MetS and its components in patients with hypertension.
Patients and Methods
Study design
Fifty-five consecutive patients with primary hypertension living in the northeast of Italy who were referred to the Hypertension Unit of our university center were enrolled in the study. We included patients of both sexes with age between 18 and 80 years and a confirmed diagnosis of primary hypertension of grade 1–2. 20 We excluded current smokers, patients who quit smoking less than 5 years before enrollment, and patients with body mass index (BMI) of 40 kg/m2 or more, grade 3 or resistant to treatment hypertension, secondary forms of hypertension as defined by extensive evaluations, 21 estimated glomerular filtration rate [eGFR; from Modification of Diet in Renal Disease (MDRD) Study equation] of less than 30 mL/min/1.73m2, diabetes, history of recent (previous 6 months) cardiac or cerebrovascular event, and use of statins, purified n-3 PUFA, or fish oil oral supplements. MetS was diagnosed according to the American Association of Clinical Endocrinologists consensus, 22 when one or more of the following conditions were associated with hypertension and increased fasting plasma glucose (plasma glucose level of 110 mg/dL or more): BMI of 25 kg/m2 or more, plasma triglycerides of 150 mg/dL or more, plasma high-density lipoprotein (HDL) cholesterol of less than 40 mg/dL in men or 50 mg/dL in women. In these patients, we measured anthropometric variables, in-office blood pressure levels by an automated oscillometric system (OMRON M6 Comfort, Kyoto, Japan), 24-hour ambulatory blood pressure (ABPM), plasma glucose, lipids, and uric acid levels and the fatty acid composition of RBC membranes. Patients were treated with antihypertensive drugs (44% angiotensin-receptor blockers, 35% beta blockers, 33% diuretics, 18% angiotensin-converting enzyme inhibitors, 13% calcium-channel blockers, and 11% alpha blockers) with an average number of 1.5±1.2 drugs per patient. In all patients, blood pressure control remained stable for at least 3 months before the study, with values persistently <140/90 mm Hg and no changes in antihypertensive treatment. At the time of the study, ABPM levels were within normal values according to current guidelines 20 in all patients. No patients were using lipid- or glucose-lowering agents prior of the study. The study protocol was approved by the local institutional review board, and each participant signed an informed consent.
Ambulatory blood pressure monitoring
ABPM was performed by a validated device (TM-2430; A&D Company Limited, Tokyo, Japan) as described previously. 23,24 The device was set to record blood pressure every 15 minutes during the daytime (8:00 a.m. to 10:00 p.m.) and every 30 minutes during the nighttime (10:00 p.m. to 8:00 a.m.). Patients were instructed to report in a form their daily activity, sleep hours, and the quality of sleep. Recordings were discarded in case of a lack of sleep during the night and repeated. Blood pressure measurements were excluded from the analysis if they were missing or labeled as technically erroneous by the monitor software. Only recordings with more than 80% valid readings were retained acceptable; non-acceptable recordings were repeated on the following day. Data were analyzed with a proprietary software (SIGMA 2000; I-TECH, Milan, Italy). Average systolic and diastolic blood pressure values during 24-hour monitoring were used for statistical analysis.
Biochemical analysis
Blood samples were collected from the antecubital vein in the morning, between 8:00 and 9:00 a.m., after an overnight fast with the patients in sitting position, for measurement of general biochemistries including plasma lipid fractions. 25 Total cholesterol and triglycerides were assessed enzymatically by an automated method. HDL cholesterol was assayed enzymatically after magnesium chloride–dextran sulphate precipitation of apolipoprotein-B containing lipoproteins. The concentration of low-density lipoprotein cholesterol was calculated with the formula of Friedewald. Total cholesterol to HDL cholesterol ratio was calculated as a marker of atherogenic dyslipidemia. 26,27 Plasma level of apolipoprotein-A1 (Apo-A1) was measured by an immunoturbidimetric method (Eiken, Tokyo, Japan). Plasma insulin and C-peptide levels were measured by a chemiluminescence enzyme immunoassay method (Immulite 1 analyzer; DPC, Los Angeles, CA). The homeostasis model assessment (HOMA) index was calculated as index of sensitivity to insulin from fasting plasma glucose (millimoles per liter) and insulin (microunits per milliliter) using the formula: [glucose×insulin)/22.5]. 28
The fatty acid composition of RBC membranes was assessed by gas chromatography (GC) on the transmethylated derivatives of fatty acids extracted from the lipids of RBC membranes with the Folch's method as previously described. 18 Briefly, GC analysis was performed with a high polar capillary column (0.53 mm internal diameter and 1 μm film thickness), for which the stationary phase consisted of a nitroterephthalic acid-modified, chemically bonded, polyethylene glycol polymer (CP-Wax 58 FFAP CB; Varian, Milan, Italy). The GC analyzer (GC 3300; Varian) was provided with an on-column injector and a flame-ionized detector heated at 220°C and 280°C, respectively. The column heating program was as follows: 170°C for 1 minute, from 170°C to 200°C at 10°C per minute, and from 200°C to 250°C at 2°C per minute up to the end of the run. The carrier gas was helium, and the run time for each sample was approximately 30 minutes. We used nonadecanoic acid (C19:0) as an internal standard, with it added to the lipid extract before transmethylation. Resolved peaks were identified using pure reference compounds in a standard mix or natural extract (cod liver oil), and peak area was measured with an electronic integrator. Fatty acids composition of RBC membranes was expressed as weight percentage (peak area percentage of the total fatty acids peak area) of all the resolved SFAs, monounsaturated fatty acids, total PUFA, PUFA of the n-6 family (n-6 PUFA), and n-3 PUFA. The PUFA/SFA ratio and n-6 to n-3 PUFA ratio (n-6/n-3 PUFA) ratio were then calculated. The omega-3 index was obtained by adding the weight % proportion of eicosapentaenoic (C20:5n-3), docosapentaenoic (C22:5n-3), and docosahexaenoic (C22:6n-3) fatty acid content in RBC plasma membranes, according to Harris and Von Schacky. 29 All chemicals were purchased from Sigma-Aldrich (Milan, Italy) and all solvents were of a high performance liquid chromatography grade.
Statistical analysis
Data are presented as mean±standard or as median [interquartile range] for non-normally distributed variables. Normal distribution was assessed by the Shapiro-Wilk test. Patients were divided in two groups according to the presence of MetS. Comparisons between means were done by the Student's t-test or the nonparametric Wilcoxon-Mann Whitney test for non-normally distributed variables. Frequency analysis was done by the Pearson chi-squared test. Correlations between continuous variables were assessed by the Pearson's R coefficient. Multivariate linear regression analysis was performed for continuous dependent variables and the standardized coefficient (beta) was reported for independent variables. The coefficient of determination (R 2) was reported as measure of the goodness of fit of the regression analysis. Non-normally distributed variables were included in the multivariate analysis after their normalization by log transformation. The variables included in the multivariate model were those with a significant correlation in univariate analysis and those with a biological significance. We considered a probability value (P) of less than 5% to reject the null hypothesis and accept a difference as significant. Statistical analysis was performed with the software STATA® Ver. 12.1 (StataCorp LP, College Station, TX).
Results
Demographic and clinical characteristics, biochemical variables, and RBC membrane fatty acids content of the study patients are summarized in Table 1, where patients are also divided according to the presence or absence of the MetS. The prevalence of the MetS in the entire patients' group was 36.4%. As expected, hypertensive patients with MetS had greater BMI, higher fasting plasma glucose, insulin, C-peptide, and triglyceride levels, lower plasma HDL-cholesterol and Apo-1 levels, and higher HOMA-index and total cholesterol to HDL cholesterol ratio than patients without MetS. RBC membranes of hypertensive patients with MetS had a lower percentage content of total PUFA, n-6 PUFA, n-3 PUFA, PUFA/SFA ratio, and omega-3 index than those of patients without MetS, whereas the n-6/n-3 PUFA ratio did not differ. Men had lower total PUFA (P=0.011), n-6 PUFA (P=0.006), and PUFA/SFA ratio (P=0.024) than women. None of the study variables was found to be significantly different between hypertensive patients who were treated with different types of antihypertensive drugs.
Data are reported as mean±standard deviation or median [interquartile range]. Comparisons between means were done by the Student's t-test or the non-parametric Wilcoxon-Mann Whitney test for non-normally distributed variables. Frequency analysis was done by the Pearson chi-squared test.
To convert to international system of units, multiply glucose by 0.055 (mmol/L), insulin by 0.0417 (μg/L), C-peptide by 0.333 (nmol/L), cholesterol by 0.026 (mmol/L), triglycerides by 0.011 (mmol/L), Apo-A1 by 0.01 (g/L), and uric acid by 59.48 (μmol/L).
Omega-3 index: sum of eicosapentaenoic, docosahexaenoic, and docosapentaenoic fatty acids (weight % of total fatty acid in RBC plasma membranes).
Apo, apolipoprotein; BMI, body mass index; DBP, diastolic blood pressure; eGFR, estimated glomerular filtration rate; HOMA, homeostasis model assessment; MUFA, monounsaturated fatty acids; NS, not significant (P>0.05); n-3 PUFA, polyunsaturated fatty acids of the n-3 family; n-6 PUFA, polyunsaturated fatty acids of the n-6 family; RBC, red blood cell; SFA, saturated fatty acids; SBP, systolic blood pressure; UACR, urinary albumin to creatinine ratio.
Results of the univariate correlation analysis between fatty acids fractions of RBC as the independent variables and the other study parameters are shown in Table 2. RBC membrane total PUFA, n-6 PUFA, n-3 PUFA, PUFA/SFA ratio, and omega-3 index were significantly and directly correlated and SFA inversely correlated with HDL-cholesterol levels. When patients were subdivided according to tertiles of Apo-A1 levels, statistically significant direct correlations were found in each tertile between HDL-cholesterol and n-6 PUFA, PUFA/SFA ratio, and omega-3 index (Fig. 1). RBC membrane total PUFA, n-6 PUFA, n-3 PUFA, PUFA/SFA ratio, and omega-3 index were inversely correlated and SFA directly correlated with total to HDL-cholesterol ratio. Additional direct correlation of RBC membrane n-6 PUFA was found with Apo-A1 and inverse with plasma glucose. In addition to fatty acid components of RBC membrane, HDL-cholesterol levels were directly correlated with total cholesterol (r=0.410; P=0.002), Apo A1 (r=0.736; P<0.001), and eGFR (r=0.276; P=0.043), and inversely with C-peptide (r=−0.382; P=0.005) and uric acid (r=−0.412; P=0.002).
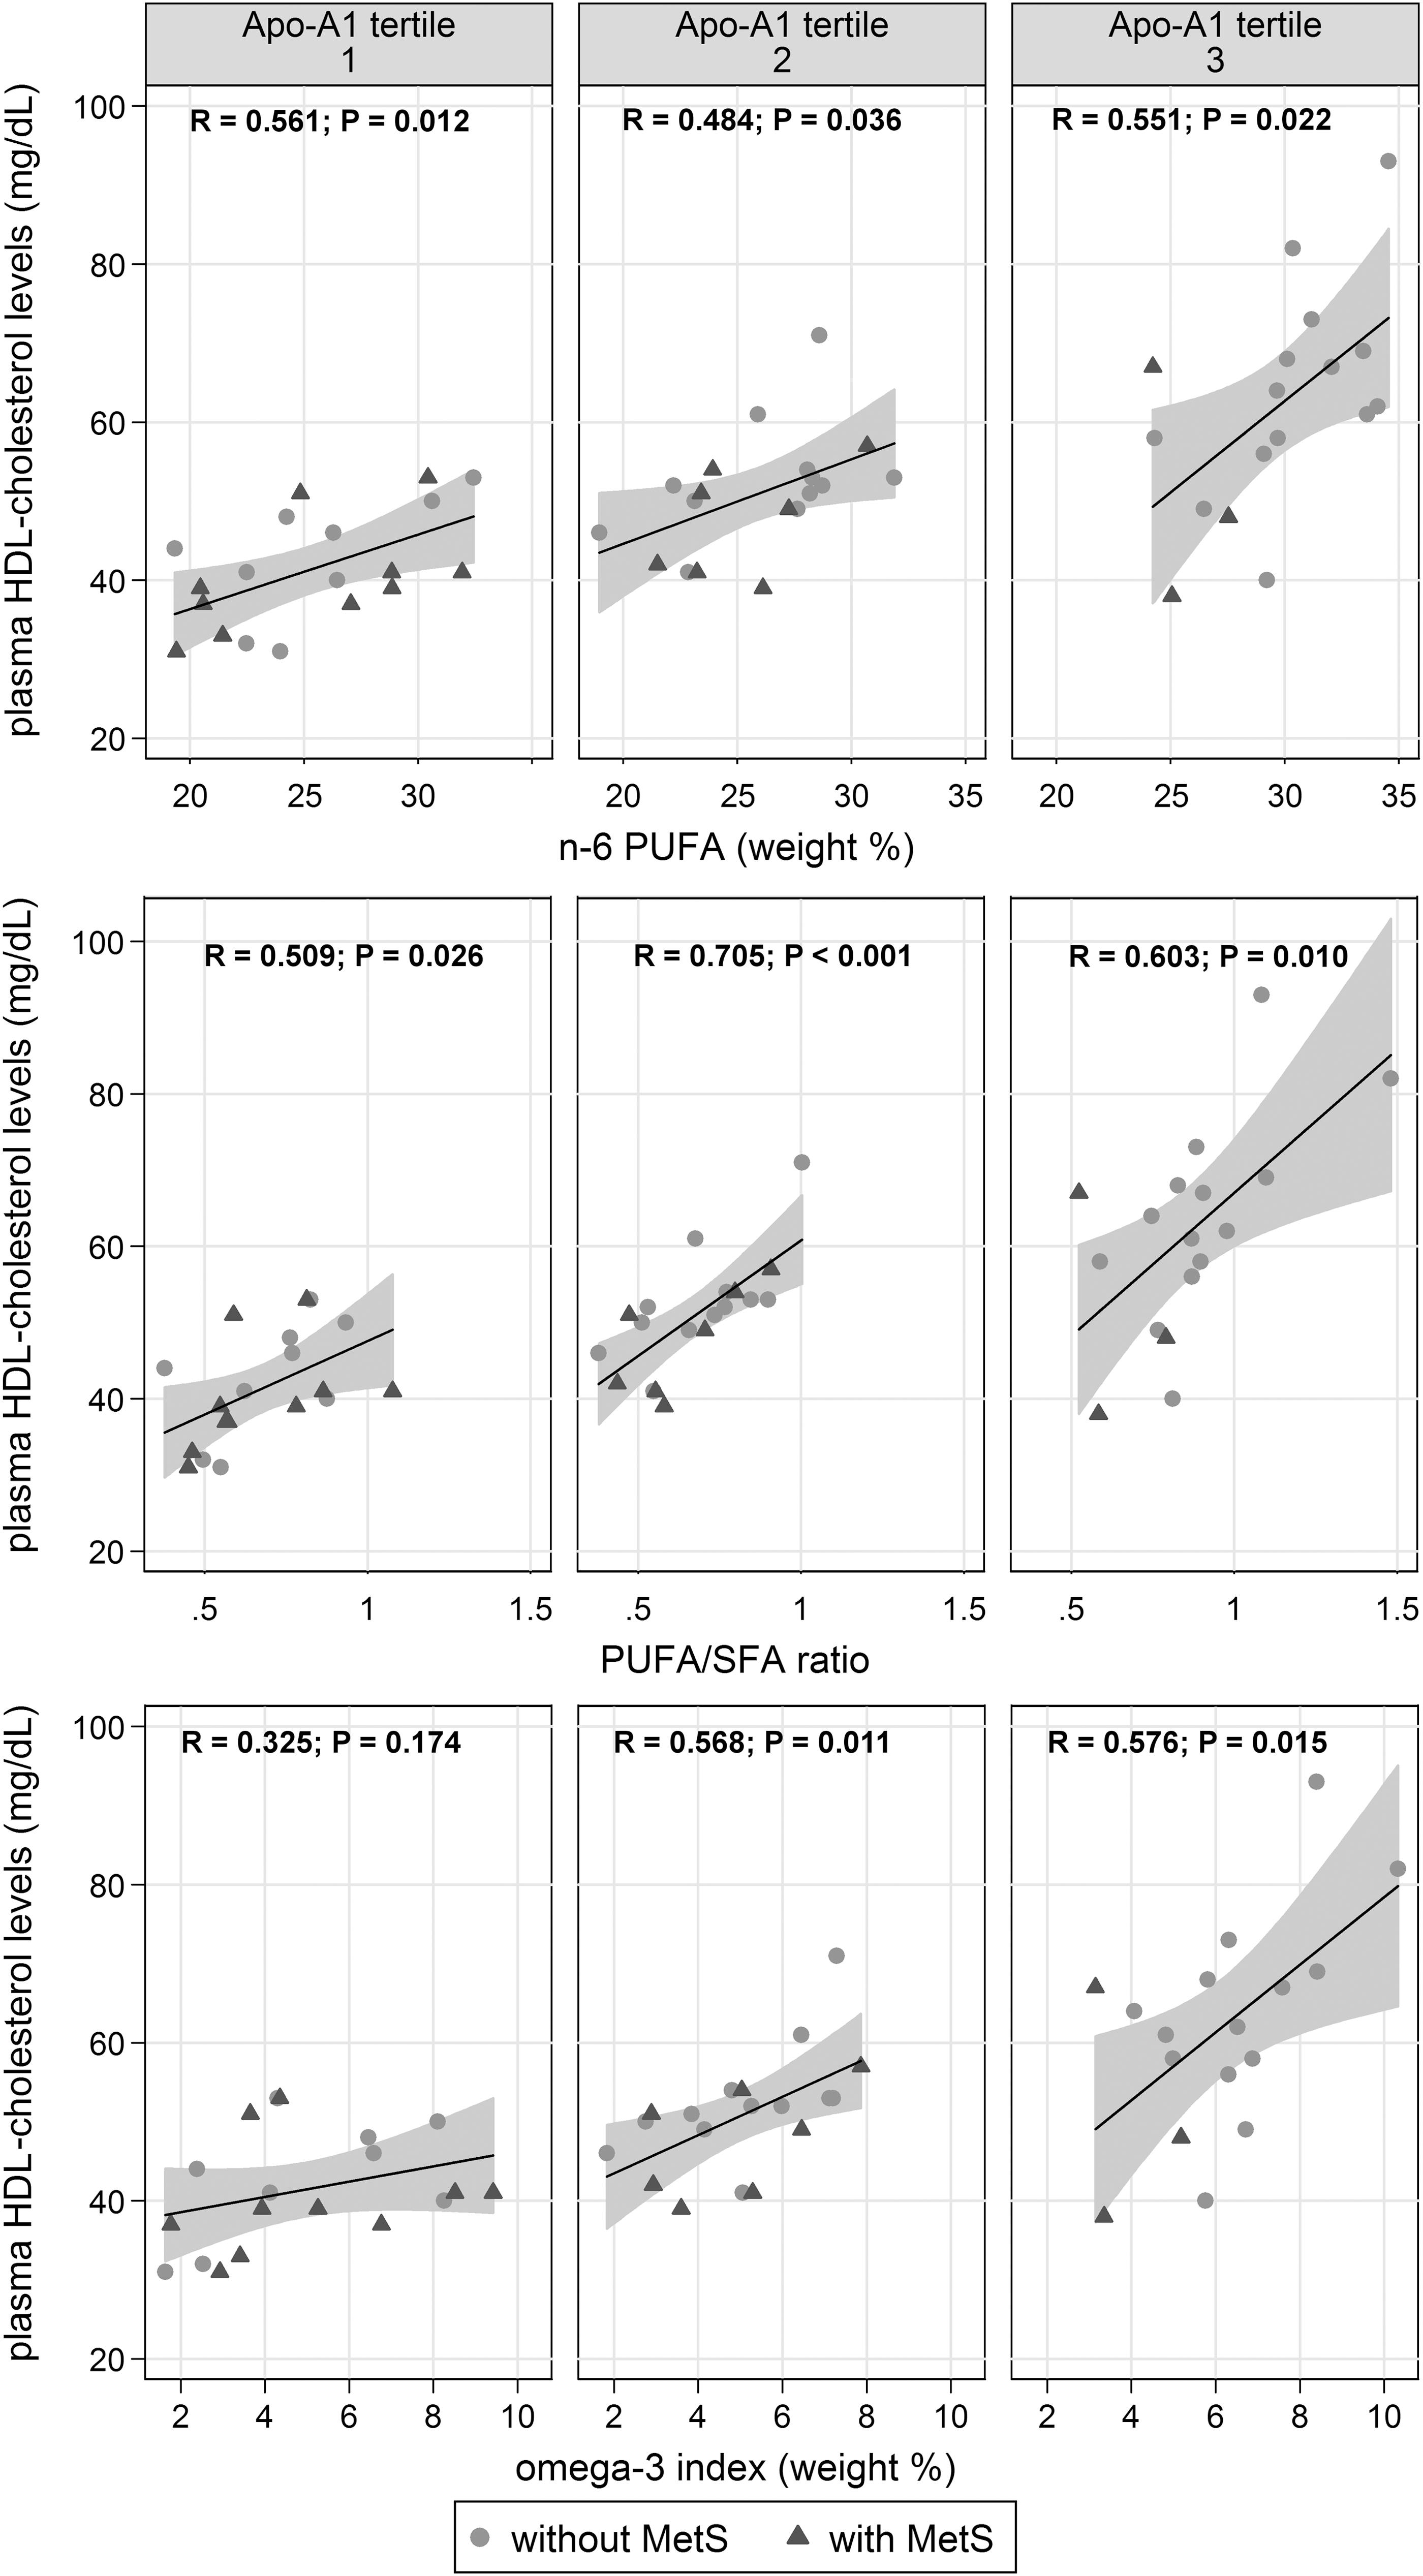
Scatter plots with estimated linear regression line (solid) and 95% confidence intervals (gray area) of the relationship between fatty acids (expressed as n-6 PUFA, PUFA/SFA ratio, and omega-3 index) and plasma HDL-cholesterol levels, across tertiles of plasma Apo-A1 levels in patients with (triangle) or without (circle) metabolic syndrome. Pearson product-moment correlation coefficient R and probability P are reported on top of each graph. n-6, omega-6; HDL, high-density lipoprotein; MetS, metabolic syndrome; PUFA, polyunsaturated fatty acids; SFA, saturated fatty acids; Apo-A1, apolipoprotein-A1.
Data are the Pearson product-moment correlation coefficient R.
P<0.05.
P<0.01.
***P<0.001.
In separate models of multivariate regression analysis that included age, sex, BMI, MetS, total cholesterol, triglycerides, Apo-A1, glucose, C-peptide, uric acid, and eGFR as possible confounders, we examined the relationship between RBC membrane n-6 PUFA, PUFA/SFA ratio, or omega-3 index with HDL-cholesterol that was considered as the dependent variable (Table 3). Analysis demonstrated that n-6 PUFA, PUFA/SFA ratio, and omega-3 index were independent predictors of plasma HDL-cholesterol concentrations. In other models of multivariate regression analysis that included RBC membrane n-6 PUFA, PUFA/SFA ratio, or omega-3 index, respectively, as the primary independent variables and total cholesterol to HDL-cholesterol ratio as the dependent variable we found an independent inverse association of all three fatty acid components with this marker of atherogenic dyslipidemia (Table 4).
Model 1 includes the polyunsaturated to saturated fatty acids ratio (PUFA/SFA) as the primary independent variable; R 2=0.781.
Model 2 includes polyunsaturated fatty acids of the n-6 family (n-6 PUFA) as the primary independent variable; R 2=0.777.
Model 3 includes the omega-3 index as the primary independent variable; R 2=0.764.
Omega-3 index, sum of eicosapentaenoic, docosahexaenoic, and docosapentaenoic fatty acids (weight % of total fatty acid in red blood cell plasma membranes).
P<0.05.
P<0.01.
Beta, standardized coefficient.
Model 1 includes the polyunsaturated to saturated fatty acids ratio (PUFA/SFA) as the primary independent variable; R 2=0.597.
Model 2 includes polyunsaturated fatty acids of the n-6 family (n-6 PUFA) as the primary independent variable; R 2=0.604.
Model 3 includes the omega-3 index as the primary independent variable; R 2=0.609.
Omega-3 index, summary of eicosapentaenoic, docosahexaenoic, and docosapentaenoic fatty acids (weight % of total fatty acid in RBC plasma membranes).
P<0.05.
Beta, standardized coefficient.
Discussion
Significant benefits of diets enriched in PUFA have been reported in patients with the MetS resulting from improvement of one or more of its components. Dietary fatty acids content affects fatty acids composition of cell membranes and measurement of membrane fatty acids is a reliable marker of fatty acids consumption. In this study, we have investigated the relationship of the fatty acid composition of RBC membranes with the MetS and its components in patients with hypertension. Results indicate that hypertensive patients with the MetS have significantly lower RBC membrane content of PUFA than patients without MetS. This difference can be attributed to a direct relationship of RBC membrane PUFA, both of the n-6 and n-3 family, with plasma HDL cholesterol levels, a relationship that occurs independent of other metabolic confounders, including Apo-A1 levels. In these patients, membrane PUFA composition is also independently and inversely related to the total cholesterol to HDL-cholesterol ratio, a marker of atherogenic dyslipidemia.
The relevance of fatty acids for the MetS has been investigated in past studies of subjects of different ethnicity. Cross-sectional studies conducted in the general population in China and Iran respectively have reported that the MetS is inversely related to plasma n-3 PUFA levels 30 and to dietary consumption of n-3 and n-6 PUFA. 31 In patients with a history of myocardial infarction, prevalence of MetS was greater than in subjects without such history, and MetS was associated with a lower serum PUFA/SFA ratio. 32 Similarly, recent evidence obtained in individuals with chronic renal failure who were included in two large epidemiological studies in Sweden has demonstrated that a low serum PUFA/SFA ratio increases by 40% the risk of having MetS. 33 In a longitudinal population-based cohort study conducted in Finland, incidence of MetS was inversely related to the relative increase of n-6 PUFA measured in serum lipids during a 6.4-year follow-up. 34 Finally, in a prospective cohort of healthy Korean subjects who completed a food frequency questionnaire the risk of developing MetS during a 3-year follow-up was halved in individuals in the top decile of n-3 fatty acid dietary intake when compared with those in the bottom decile. 5 Consistent with the findings of all these studies, the present study indicates that the MetS is associated with lower content of both n-6 and n-3 PUFA and lower PUFA/SFA ratio in RBC membranes of hypertensive patients.
In this study, the association of lower membrane PUFA content with the MetS was explained by a direct and independent relationship of these fatty acids with plasma HDL cholesterol levels. The INTERLIPID study 35 was the first to report an association between the dietary intake of n-3 PUFA as assessed by repeated 24-hour dietary recalls and serum HDL-cholesterol, and estimated a 4.6 mg/dL higher HDL cholesterol level for each 1% kcal increase in n-3 PUFA intake. Motoyama et al. 36 subsequently examined serum fatty acids in a population-based cross-sectional study of 758 subjects of different ethnicity (whites, Japanese, and Japanese Americans) and reported a significant positive association of both n-6 and n-3 PUFA with HDL-cholesterol levels in all ethnic groups. More recently, in a countrywide survey of 2280 Inuit subjects in Greenland, HDL cholesterol levels were directly related with n-3 intake as estimated by eicosapentaenoic acid measurement in RBC membranes. 37 Finally, a systematic review of 11 randomized controlled trials that examined the effects of dietary supplementation with n-3 PUFA (docosahexaenoic acid in the form of algal oil) on cardiovascular risk factors in subjects without history of coronary events concluded that a marine source of n-3 PUFA not obtained from fish significantly increases HDL cholesterol levels. 38 The findings of the present study strongly support the evidence of a direct relationship between PUFA and HDL cholesterol and, as previously suggested by Gerasimova et al., 39 demonstrates that this relationship is independent of Apo-A1 levels, the main determinant of plasma HDL-cholesterol concentration. 40 Furthermore, the study expands this evidence to patients with hypertension and MetS, an observation particularly relevant because of the high cardiovascular risk of these patients. To this point, it is important to notice that in these patients also the total to HDL-cholesterol ratio, a marker of atherogenic dyslipidemia, was independently associated with low PUFA content of RBC membranes. Similarly, inverse association of serum PUFA levels with total to HDL-cholesterol ratio was reported in the participants of the Framingham Heart Study. 41
Studies on dietary interventions are often biased by low precision of information collected by food questionnaires or inadequate compliance to dietary prescriptions. With regard to dietary fatty acids content, it has been shown that it can be reliably assessed by measurement of the concentration of these lipids in plasma or in membranes of circulating cells. 15,16 In this study, we measured fatty acids composition of the RBC membrane as an estimate of dietary intake, because this measurement reflects long-term exposure to circulating lipids and has some advantage over measurement of plasma levels. 42 Moreover, the fatty acids composition of RBC membranes reflects composition in membranes of other cell types 43 and has been used in past interventional studies to demonstrate the beneficial effects of PUFA on the cardiovascular system. 44,45
Because PUFA membrane concentration correlates with dietary intake of PUFA, we might speculate that PUFA intake could increase HDL cholesterol thereby decreasing the cardiovascular risk of hypertensive patients with MetS. In support of this hypothesis, Tapsell et al. demonstrated in a randomized controlled trial of diabetic patients that a diet rich in PUFA from walnuts and fishmeal increases HDL cholesterol levels and reduce total to HDL cholesterol ratio. 46 In another randomized controlled trial involving 170 patients with abdominal obesity, Jones et al. demonstrated that a mixture of canola oil and docosahexaenoic acid (DHA) increases HDL cholesterol and decreases total to HDL cholesterol ratio and triglycerides levels. 47 Other studies, however, reported contrasting results. Kelley et al. did not observe any effect of DHA supplementation on plasma HDL cholesterol of 17 hypertriglyceridemic patients, 48 although a significant increment of the HDL-cholesterol to Apo-A1 ratio was found suggesting a possible effect of DHA on HDL particle size. 49 Dunstan et al. showed that fish consumption had no effect on total cholesterol levels but increased HDL2 subfraction concentration in dyslipidemic patients with type 2 diabetes. 50 In addition, Lankinen et al. demonstrated that despite no effect on HDL cholesterol levels, increased fish consumption was associated with increased concentration of large HDL particles, larger average diameter of HDL particles, and increased concentrations of large HDL lipid components. 51 Finally, in a meta-analysis of 72 placebo controlled trials, it was shown that oral supplementation with 7 grams of n-3 PUFA per day for at least 2 weeks increases HDL cholesterol levels by 3% in healthy subjects. 52 Many reasons could account for the discrepancy of all these findings, including differences in study design, ethnicity of patients, types of PUFA sources, and genetic factors. 53,54 This study has limitations that need to be discussed. First, because of the limited sample size the study could have been underpowered for multiple correlations and the cross-sectional design does not permit to draw any conclusion on a causal relationship of RBC membrane PUFA content with HDL cholesterol levels. However, the strength and independence of the relationship would suggest so. Second, use of a questionnaire providing information on the dietary intake of lipid subfractions and other nutrients or consideration of additional factors possibly affecting plasma HDL-cholesterol levels such as some genetic polymorphisms would have helped in the interpretation of data. Third, inclusion of hypertensive patients who were not treatment-naive might have introduced a possible confounder affecting some of the metabolic variables measured in this study. It must be noticed, however, that no significant difference in any of these metabolic variables was observed between patients who were treated with different types of antihypertensive drugs. Finally, it is of note that the presence of hypertension should not be considered a key factor to explain the low PUFA concentration in the presence of MetS since the relationships could occur also in normotensive patients with MetS.
In conclusion, this study demonstrates that presence of the MetS in patients with hypertension is associated with significantly lower PUFA content in RBC membranes, of both the n-6 and n-3 family. A direct and independent association of RBC membrane PUFA content with HDL cholesterol levels explains this association. The content of PUFA in RBC membranes of hypertensive patients is also inversely related to total cholesterol to HDL-cholesterol ratio, once again suggesting a beneficial role of these fatty acids on atherogenic dyslipidemia and thereby possible reduction of cardiovascular disease risk.
Footnotes
Acknowledgments
This study was supported by a research grant of the European Community (Interreg III Italy-Austria to G.C., C.C., L.M., and L.A.S.) and by the kind support of the Pier Silverio Nassimbeni Foundation to G.C, C.C., and L.A.S.
Author Disclosure Statement
No competing financial interests exist.