
Abstract
Background:
Nonalcoholic fatty liver disease (NAFLD) includes a variety of histopathological findings ranging from simple steatosis to nonalcoholic steatohepatitis (NASH) which can only be differentiated by liver biopsy. There is yet no unique biomarker found to discriminate NASH from simple steatosis.We aimed to investigate the relationship of plasma pentraxin 3 (PTX3) and its main stimulant tumor necrosis factor alpha (TNF-α) with the degree of liver damage in NAFLD.
Methods:
Plasma PTX3 and TNF-α levels were measured in 70 patients with histologically verified NAFLD (56 with NASH, 14 with non-NASH) and 12 controls.
Results:
PTX3 and TNF-α levels were found significantly higher in the NAFLD group than in the control group (4.1 ± 2.3 vs. 1.3 ± 0.8 ng/mL, P < 0.001, and 7.6 ± 4.1 vs. 3.3 ± 1.3 pg/mL, P < 0.001 respectively) and in biopsy proven NASH subgroup than non-NASH subgroup (4.6 ± 2.2 vs. 2.2 ± 1.7 ng/mL, P = 0.001, and 8.3 ± 4.3 vs. 4.6 ± 1.6 pg/mL, P = 0.001 respectively). To discriminate NASH from non-NASH PTX3 had 91.1% sensitivity and 71.4% specificity at the cutoff value of 2.45 ng/mL. Plasma PTX3 levels showed correlation with NAFLD activity score, fibrosis stage and steatosis grade (r = 0.659, P < 0.001; r = 0.354, P < 0.01; and r = 0.455, P < 0.001, respectively).
Conclusion:
This study demonstrated markedly higher PTX3 levels in NAFLD patients compared with controls, and in biopsy proven NASH patients compared with non-NASH ones. Thus, in this cohort we showed that plasma PTX3 may be a promising biomarker for the presence of NASH.
Introduction
N
NASH can be differentiated from simple steatosis only by liver biopsy and is diagnosed when all of the following three criteria are met: macrovesicular fatty change of hepatocytes, inflammatory cell infiltration, and ballooning degeneration of hepatocytes. 4 However, liver biopsy is invasive, has drawbacks such as sampling error and cost, and it is not applicable for all patients. 5 Although numerous biomarkers are investigated to discriminate NASH from simple steatosis, there is yet no unique biomarker to meet the requirements sufficiently.
The pentraxins form a superfamily of multifunctional proteins that are subdivided into two subgroups based on the primary structure and protein length: short and long. 6 The classical short pentraxins, C-reactive protein (CRP) and serum amyloid P component, are acute-phase proteins that are manufactured in the liver under the guidance of inflammatory cytokines. 7 The prototypic long pentraxin, pentraxin 3 (PTX3), was identified in the early 1990s in human endothelial cells and fibroblasts as a tumor necrosis factor-alpha (TNF-α) or interleukin 1β inducible compound. Despite similarities of action, PTX3 differs from CRP in many basic aspects, such as gene organization, chromosomal localization, cellular sources, inducing stimuli, and the recognized ligands. 8,9
In patients with NAFLD, the progression from simple steatosis to steatohepatitis and cirrhosis is characterized by cellular injury from oxidative stress and cytokine-driven intrahepatic inflammation. 10 There are studies suggesting that the intrahepatic inflammation associated with NAFLD may be linked to systemic elevations in inflammatory biomarkers, such as CRP. 11 Also in contrast to regular CRP assays, a high-sensitivity CRP (hs-CRP) assay enables the diagnosis of even low-grade inflammation. Recently, elevated serum hs-CRP was reported to be a predictor of disease progression in NAFLD cases [12]. But the studies conducted later on yielded controversial results about the differences of serum hs-CRP levels between NASH and simple steatosis patients. 13
The levels of plasma PTX3 are found higher than normal controls in various inflammatory conditions such as rheumatologic disorders, 14 asthma, 15 coronary artery diseases, 16 vasculitis, 17 and systemic inflammation and sepsis. 18,19 Because NAFLD is also an ongoing inflammatory condition, we hypothesized that plasma PTX3 levels increase in patients with NAFLD and aimed to investigate the potential relationship of plasma PTX3 levels with the degree of liver damage of NAFLD patients to see if there is any clinical role of PTX3 (and its stimulant TNF-α) in the diagnosis and staging of NAFLD/NASH patients.
Materials and Methods
In this observational case–control study, 70 patients with NAFLD and 12 healthy control subjects were enrolled. The study protocol was approved by our local ethics committee, and all subjects gave written informed consent to participate in the study. Patients with NAFLD were seen consecutively at the outpatient clinics of Sisli Hamidiye Etfal Education and Research Hospital between February 2013 and September 2014. All patients had elevated alanine aminotransferase (ALT) and aspartate aminotransferase (AST) levels for at least 6 months together with steatosis at ultrasonography (US). They had no history of any hepatotoxic drugs, antidiabetic medications, hormone replacement therapy, or herbal products; no alcohol consumption more than 20 g/day; and no viral or autoimmune hepatitis, hemochromatosis, Wilson's disease, alpha-1 antitrypsin deficiency, biliary disease, or malignancies. Patients with conditions that might increase plasma PTX3 levels, such as heart failure, 20 asthma, 15 vasculitis, 17 or autoimmune rheumatic disease 14 or patients with conditions known to reduce plasma PTX3 levels, such as a history of statin therapy, 21 were excluded. The control group had no illness to cause any inflammation; no usage of alcohol, drug, or herbal substances; no history of previous liver diseases; and was negative for viral hepatitis serology tests and had completely normal liver US. All patients and controls were of Turkish descent.
All subjects underwent physical examination, anthropometric measurements, and biochemical screening. Body-mass index (BMI) was computed as (body weight/height2). The estimate of insulin resistance was calculated using the homeostasis model of insulin resistance (HOMA-IR) index.
Serum hs-CRP was measured by means of particle-enhanced immunonephelometry (using the Siemens BN II and BNProSpec System). For PTX3 and TNF-α analyses, all blood samples were collected from an antecubital vein, between 8:00 and 9:00 a.m. after an overnight fast. Blood was drained to a tube containing ethylene diaminetetraacetate and samples were centrifuged for 15 minutes at 1000g. Then the plasma was removed immediately and stored frozen at −80°C until analyzed.
Plasma PTX3 levels were measured by Human Pentraxin ELISA Kit (Aviscera Bioscience Inc.) using the quantitative sandwich enzyme immunoassay technique. Intra-assay and inter-assay coefficients of variation were 4%–6% and 8%–10% respectively. The minimum detectable concentration of PTX3 was 0.02 ng/mL. Plasma concentrations of TNF-α were assessed with AssayMax Human Tumor Necrosis Factor-alpha ELISA Kit (Assaypro LLC) according to manufacturer's instructions; the assay was based on the method of quantitative sandwich enzyme immunoassay. The minimum detectable concentration of TNF-alpha was 0.015 ng/mL. Intra- and inter-assay coefficients of variation were 4.9 % and 7.0% respectively.
Liver biopsies were performed under guidance of US using a 16-gauge Hepafix needle. An experienced hepatopathologist blinded to subjects' details evaluated biopsy specimens based on the presence of steatosis, inflammation, and ballooning and according to the decision of the hepatopathologist in terms of NASH presence or absence, we divided our NAFLD study group into two subgroups as NASH and non-NASH. The same experienced hepatopathologist also scored each liver biopsy specimen using the National Institute of Diabetes and Digestive and Kidney Diseases Nonalcoholic Steatohepatitis Clinical Research Network scoring system. 22 The histological NAFLD activity score (NAS) was defined as the unweighted sum of the scores for steatosis (0–3), lobular inflammation (0–3), and ballooning degeneration (0–2), thus ranging from 0 to 8. Fibrosis was staged as follows: stage 0, no fibrosis; stage 1, perisinusoidal or periportal fibrosis; stage 2, perisinusoidal and portal/periportal fibrosis; stage 3, bridging fibrosis; and stage 4, cirrhosis.
All statistical analyses were performed using SPSS version 21.0 for Windows (SPSS, Inc.). The compliance of variables to the normal distribution was studied by visual (histograms and probability plots) and analytic methods (Kolmogorov-Smirnov/Shapiro-Wilk tests). Ordinal and continuous variables that do not have normal distribution were compared by Mann-Whitney U test using medians. The Student t-test was used to evaluate differences between the two study subgroups (NASH vs. non-NASH) in normally distributed continuous variables like age, BMI, albumin, and PTX3. A value of P < 0.05 (2-sided) was considered statistically significant. Kruskal-Wallis test was used to compare NASH, non-NASH, and control groups. A value of P < 0.017, calculated by Bonferroni correction, was considered statistically significant in this triple comparison. Correlations among the study variables were tested by the Pearson and Spearman correlation coefficient according to suitability of the data. To determine independent predictors of NASH, multiple logistic regression analysis was performed by using age, gender, and the significantly elevated variables in NASH compared with non-NASH by univariate analysis (plasma PTX3, TNF-α, and HOMA-IR). Hosmer-Lemeshow goodness of fit statistics was used to assess model fit. Analysis of covariance (ANCOVA) was used to assess differences in plasma PTX3 levels between NASH and non-NASH groups by adjusting for factors like stage of fibrosis, grade of steatosis, age, sex, TNF- α, and HOMA-IR that may cause confounding. All analyses were performed at the 95% confidence interval.
Results
The main clinical and biochemical characteristics of the NAFLD patients and control subjects are shown in Table 1. Age, gender distribution, total and LDL cholesterol levels, and systolic and diastolic blood pressures were similar between NAFLD and control groups. NAFLD group BMI, waist and hip circumferences, fasting plasma glucose (FPG), insulin, HOMA-IR, ALT, AST, triglyceride, and hs-CRP levels were significantly higher, and HDL-cholesterol levels were significantly lower than the control group. Significantly higher serum PTX3 (4.1 ± 2.3 vs. 1.3 ± 0.8 ng/mL) and TNF-α (7.6 ± 4.1 vs. 3.3 ± 1.3 pg/mL) levels were found in NAFLD patients when compared with control group (P < 0.001).
Values are given as mean ± standard deviation.
ALT, alanine aminotransferase; AST, aspartate aminotransferase; BMI, body mass index; DBP, diastolic blood pressure; FPG, fasting plasma glucose; HDL-C, high density lipoprotein cholesterol; HOMA-IR, homeostasis model assessment of insulin resistance; hs-CRP, high-sensitivity c-reactive protein; LDL-C, low density lipoprotein cholesterol; PTX-3, pentraxin 3; SBP, systolic blood pressure; TG, triglyceride; TNF-α, tumor necrosis factor-alpha.
NAFLD patients were divided into two subgroups as NASH (n = 56) and non-NASH (n = 14). When the clinical and biochemical characteristics of NASH and non-NASH patients were compared as shown in Table 2. Age; gender distribution; BMI; waist and hip circumferences; systolic and diastolic blood pressures; FPG; ALT; AST; total; HDL and LDL-cholesterol levels; triglyceride; and hs-CRP levels were similar and had a statistically nonsignificant difference. HOMA-IR (5.7 ± 4.1 vs. 3.0 ± 1.1, P < 0.001), TNF-α (8.3 ± 4.3 vs. 4.6 ± 1.6 pg/mL, P = 0.001) and PTX3 (4.6 ± 2.2 vs. 2.2 ± 1.7 ng/mL, P = 0.001) levels had statistically significant differences and all three were higher in the NASH group. BMI, waist and hip circumferences, FPG, HOMA-IR, ALT, AST, trigliyceride, hs-CRP, and TNF-α levels of both subgroups were statistically significantly higher than in the control group. Plasma PTX3 levels of NASH, non-NASH, and control groups are shown in Figure 1.
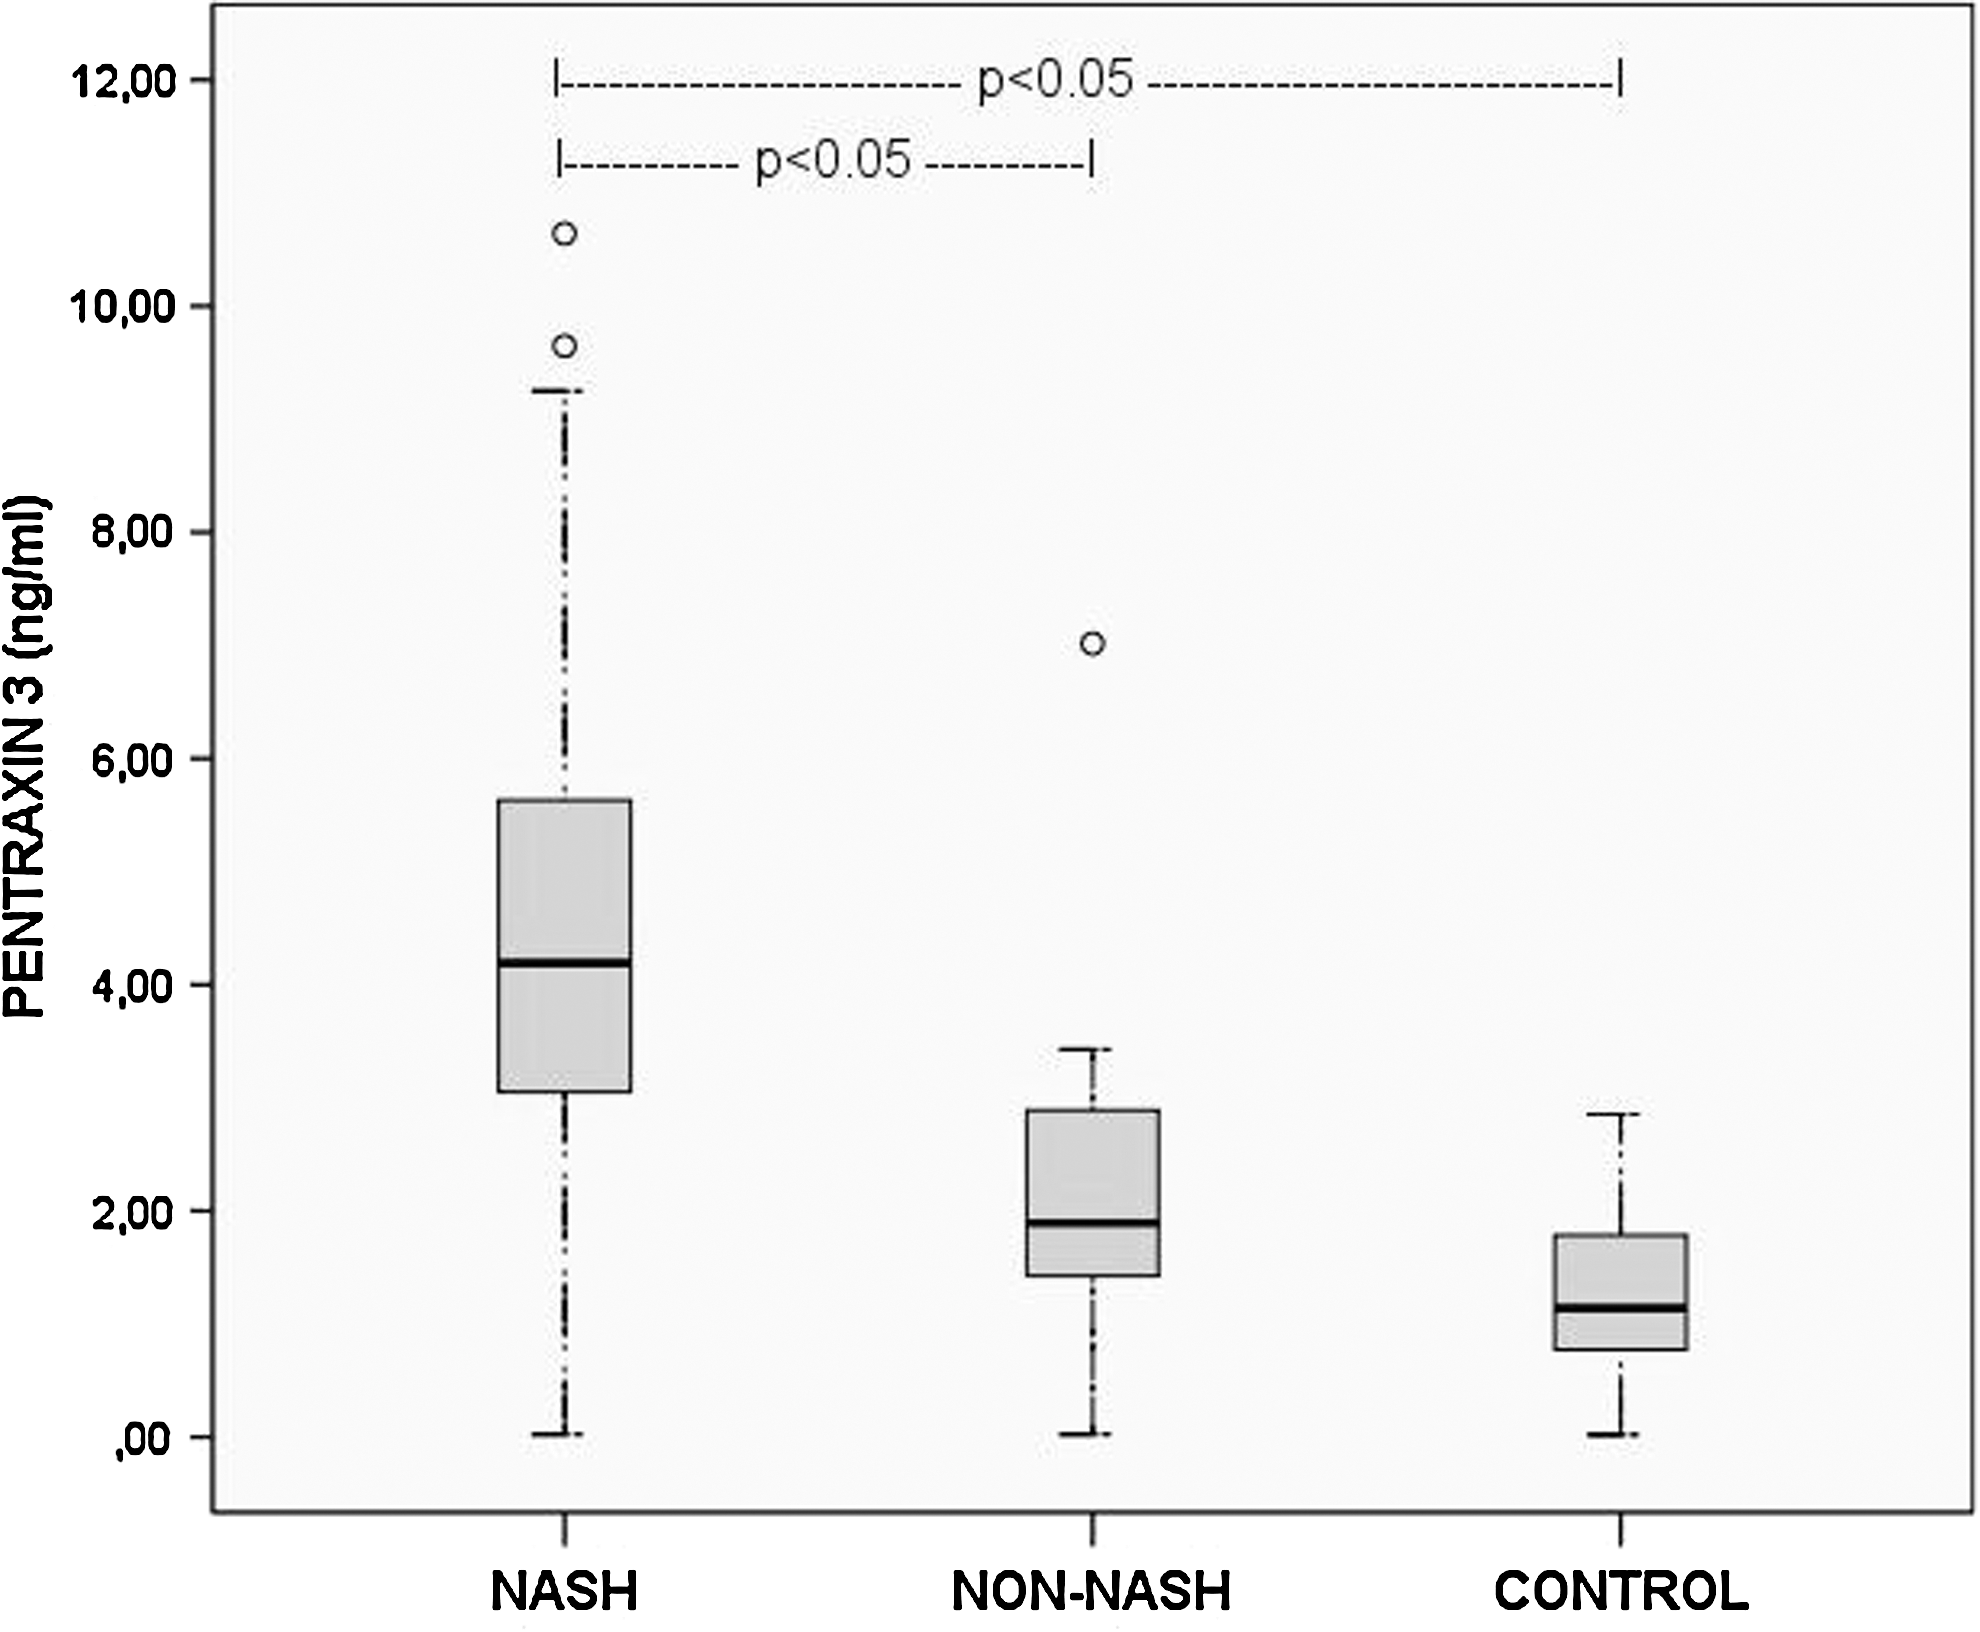
Plasma pentraxin 3 (PTX-3) levels of nonalcoholic steatohepatitis (NASH), non-NASH and control groups. The graph shows interquartile range (box), median (thick line), range (thin lines), and outliers (circles) of plasma PTX-3 levels. The length of the box represents the interquartile range within which 50% of the values were located.
Values are given as mean ± standard deviation except where noted.
The column on the right represents P values gained by the comparison of all three groups by Kruskal-Wallis test. A value of P < 0.017, calculated by Bonferroni correction, was considered statistically significant in this triple comparison.
NASH vs. non-NASH P < 0.05.
†NASH vs. control P < 0.05.
‡Non-NASH vs. control P < 0.05. NAS, non-alcoholic fatty liver disease activity score; NASH, nonalcoholic steatohepatitis.
Since plasma PTX3 and TNF-α levels were significantly elevated in the NAFLD group compared with the control group and in the NASH subgroup compared with the non-NASH subgroup, we investigated the relationship between stage of fibrosis and plasma PTX3 and TNF-α levels. There was a stepwise increase in the plasma PTX3 and TNF-α levels with the increasing fibrosis stage, and this relation was statistically significant with PTX3, whereas it was nonsignificant with TNF-α (P < 0.017, P = 0.413 respectively) (Fig. 2).
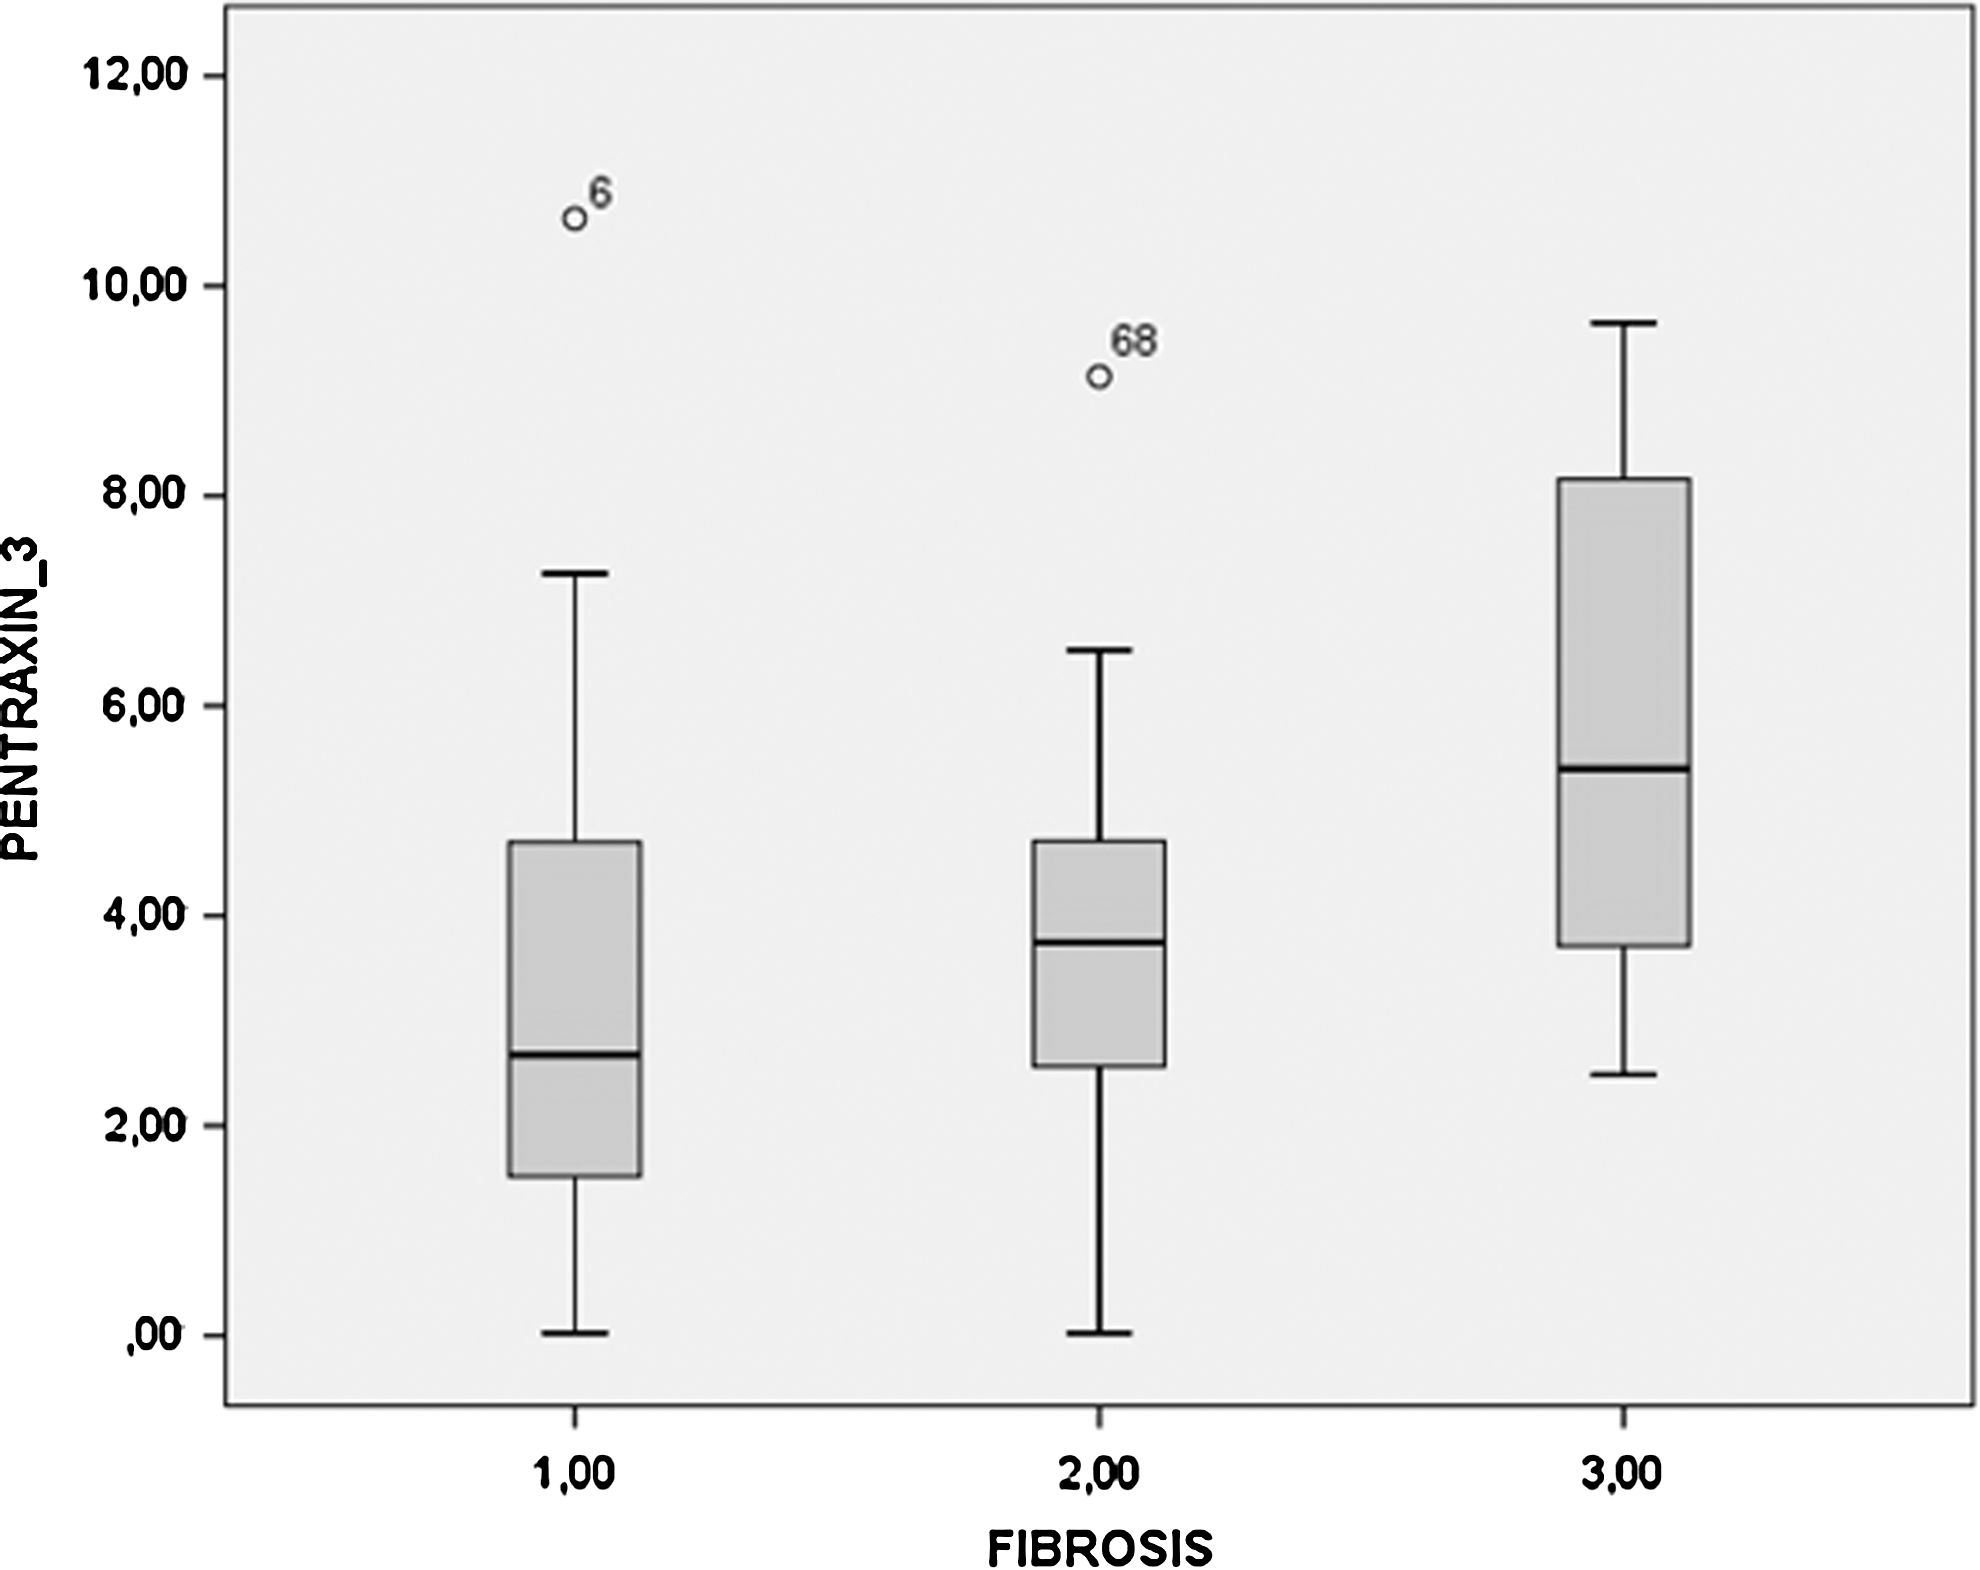
Relation between plasma PTX3 levels and fibrosis stages. The graph shows interquartile range (box), median (thick line), range (thin lines), and outliers (circles) of plasma PTX3 levels. The length of the box represents the interquartile range within which 50% of the values were located.
There was a statistically significant correlation between NAS and PTX3 and TNF-α levels. The correlation was stronger with PTX3 than the correlation of TNF-α (r = 0.659, P < 0.001; r = 0.314, P < 0.01 respectively). When the correlations of PTX3 levels with the stage of fibrosis and grade of steatosis were assessed, significant correlations (r = 0.354, P < 0.01 and r = 0.455, P < 0.001 respectively) were found, but these histologic findings didn't correlate with TNF-α levels (P = 0.223 and P = 0.796 respectively). The correlation coefficients and p values of pentraxin-3 levels with main clinical and biochemical variables are shown in Table 3.
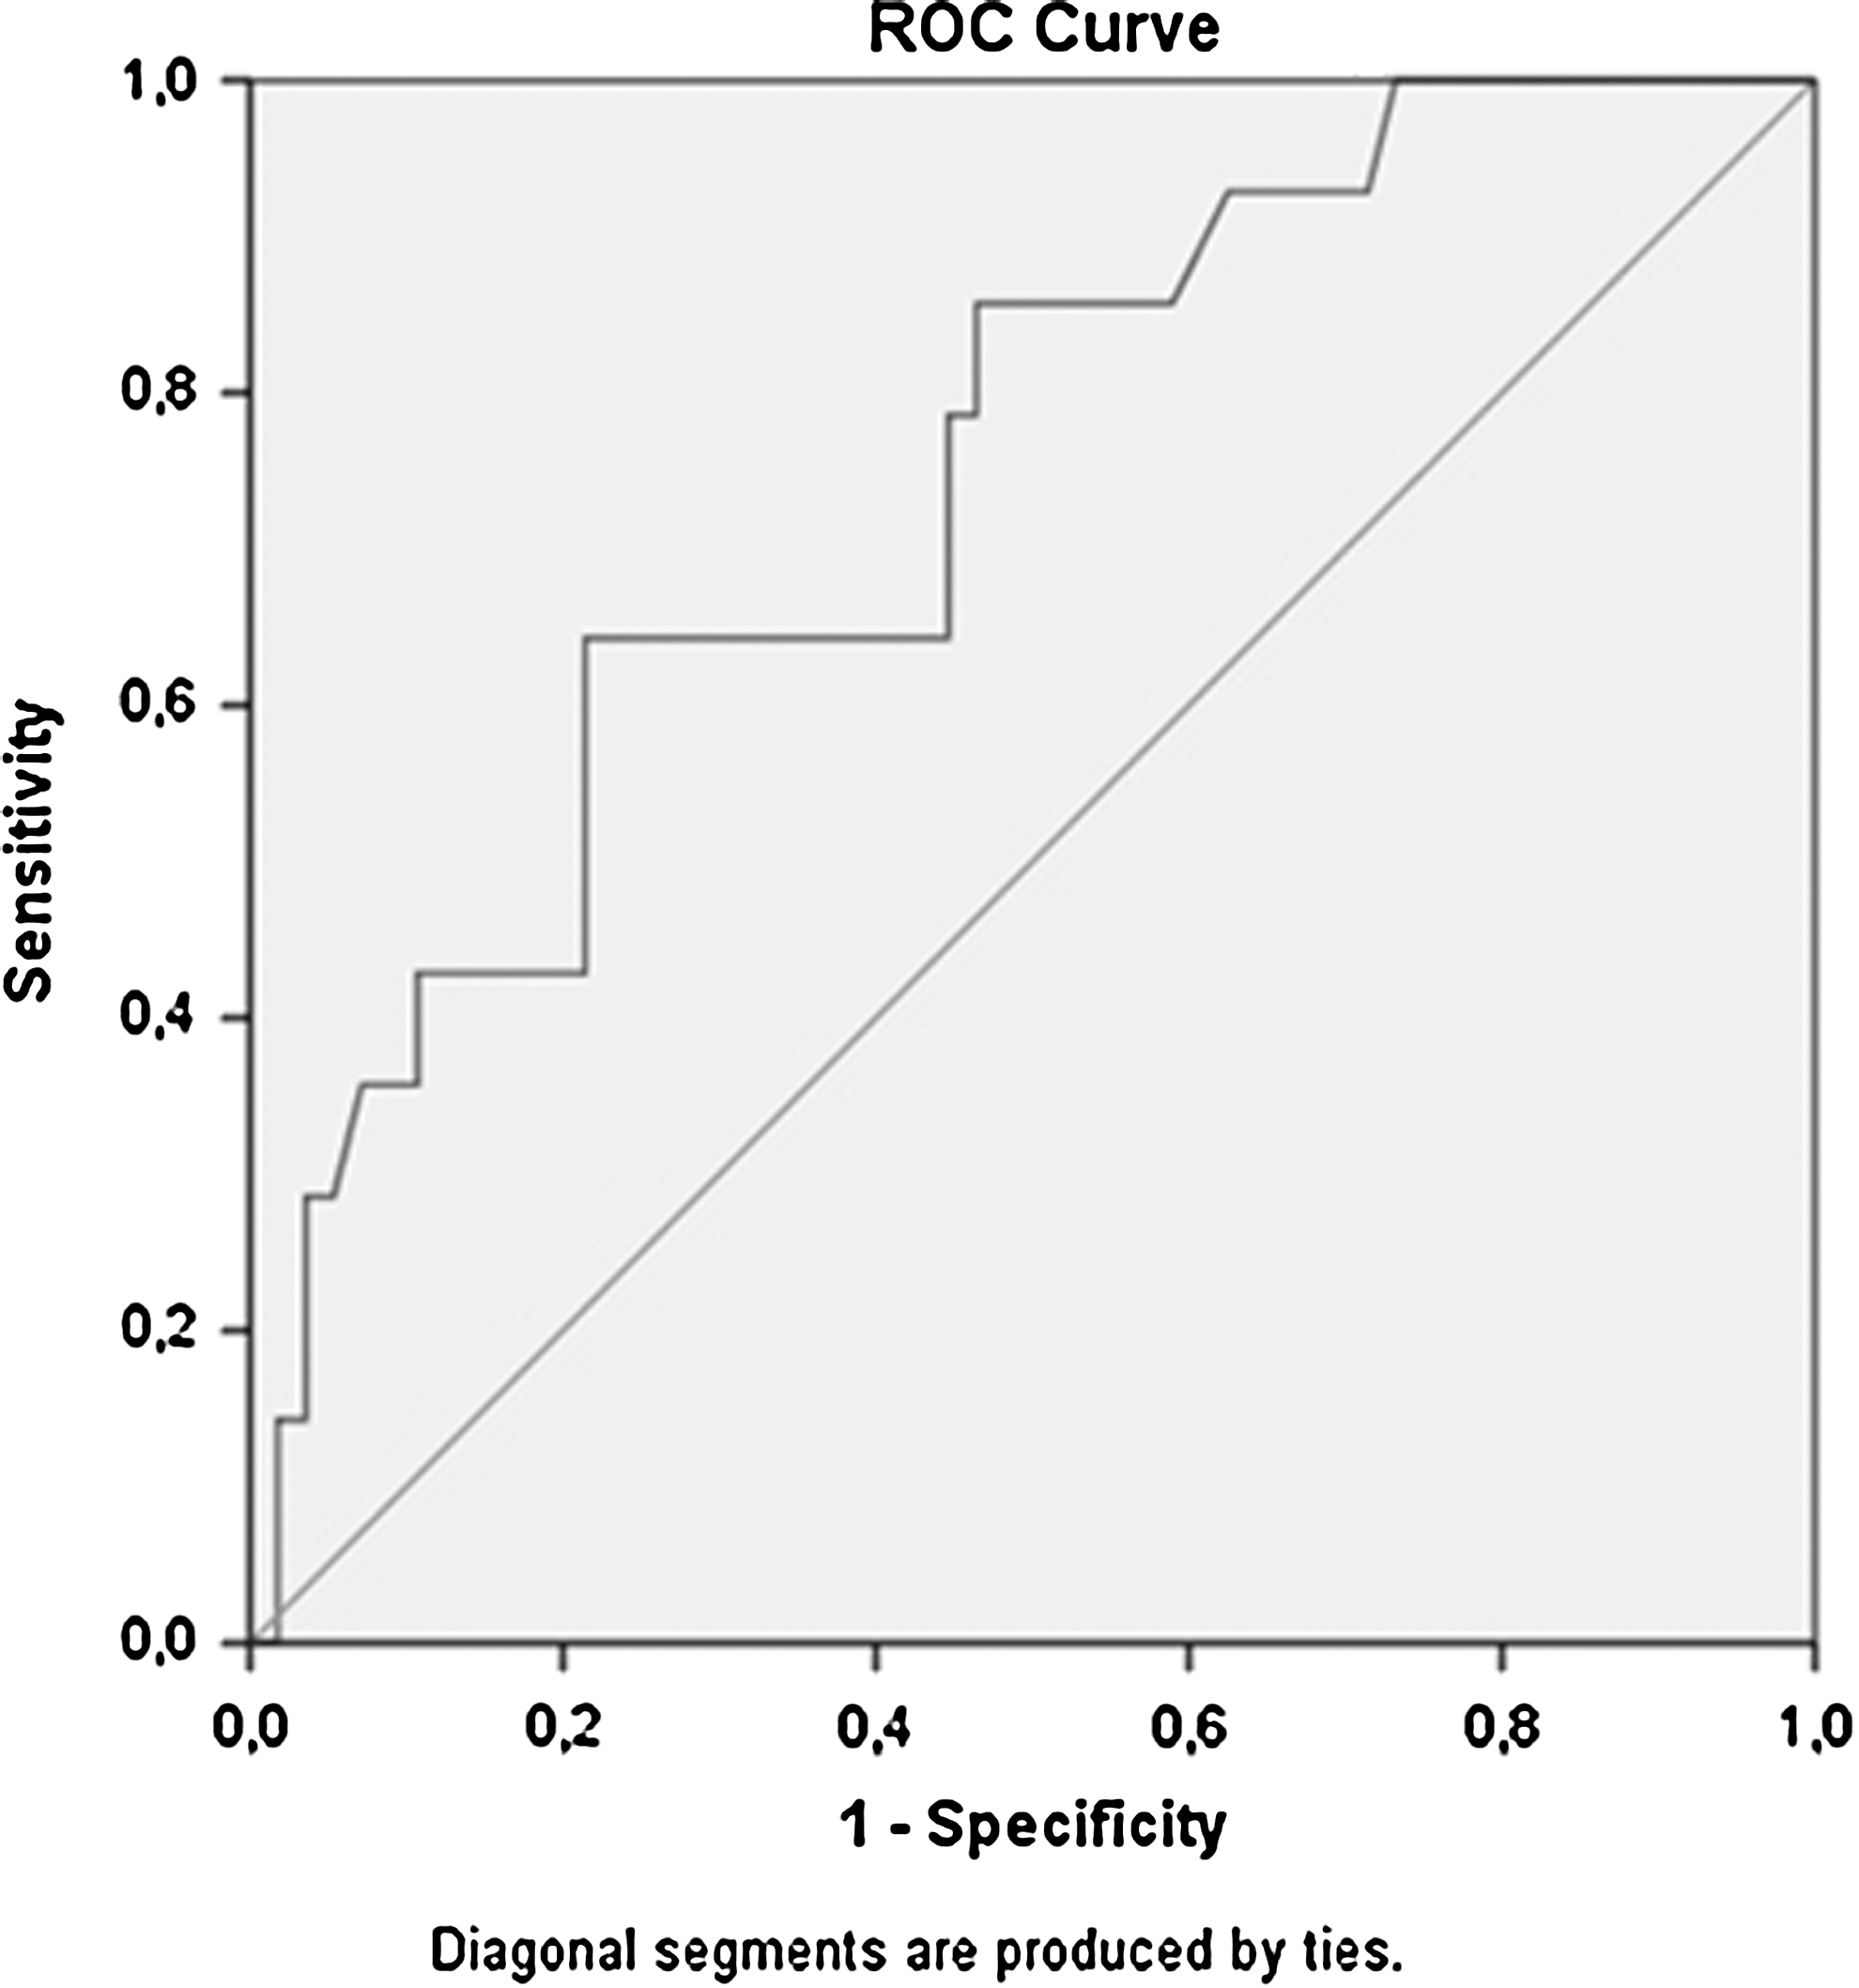
In order to detect the differentiating power of PTX3 levels of NAFLD, NASH, and non-NASH patients from controls and NASH patients from non-NASH patients, we synthesized receiver operating characteristic curves (ROC). The ROC analysis were performed between NAFLD versus control, NASH versus control, non-NASH versus control, and NASH versus non-NASH groups according to plasma PTX3 levels and the areas under the curves were found to be 0.904, 0.955, 0.702, and 0.858, respectively (Fig. 3). The optimal cutoff value for the diagnosis of NASH was 2.45 ng/mL with a sensitivity of 91.1%, specificity of 71.4%, positive predictive value (PPV) of 76.1%, and negative predictive value (NPV) of 88.9%. At the level of 95% specificity, the cutoff value was 3.43 ng/mL and sensitivity was 68%.

Receiver operating characteristic curves to differentiate
When we aimed to investigate differentiation between NAFLD patients with advanced fibrosis (stages 3 and 4) and NAFLD patients with milder fibrosis (Fig. 4), the area under the curve for plasma PTX3 gained by ROC analysis was 0.742. The optimal PTX3 cutoff value for diagnosis of advanced fibrosis was 3.53 ng/mL with sensitivity, specificity, PPV, and NPV values of 85.7%, 53.6%, 64.9%, and 78.9%, respectively.
Receiver operating characteristic curve to differentiate NASH patients with advanced fibrosis and NASH patients with milder fibrosis according to the plasma PTX3 level (area under the curve = 0.742).
We performed multiple logistic regression analysis by using age, gender, and significantly elevated variables in NASH compared with non-NASH by univariate analysis: plasma PTX3, TNF-α, and HOMA-IR. In this multivariate analysis, plasma PTX3 level was still found to be significantly high (P = 0.01) in the NASH subgroup compared with the non-NASH subgroup (Table 4). We also performed ANCOVA analysis using factors such as fibrosis stage, steatosis grade, age, sex, TNF-α, and HOMA-IR that can have confounding impacts on the association between PTX3 and steatohepatitis. When adjusted for all these factors, the plasma PTX3 level was still significantly high (P = 0.047) in the NASH subgroup compared with non-NASH.
CI, confidence interval; OR, odds ratio.
Discussion
Currently, in the management of NAFLD patients one should use invasive methods, such as liver biopsy, to differentiate simple steatosis from NASH. This distinction is of great importance, because NASH is considered to be a disease that can evolve to cirrhosis and hepatocellular carcinoma, whereas steatosis is considered benign in prognosis. 3 A specific biomarker that can distinguish NASH from simple steatosis would replace invasive liver biopsy and gain great value in terms of clinical usefulness. Because it is simple, inexpensive, and available worldwide, hs-CRP had been suggested as an alternate marker of NAFLD severity, but studies with this theme revealed inconsistent results. 12,13
PTX3 is an acute phase protein that belongs to the same family as the well-established inflammatory biomarker CRP. In contrast to CRP, which is primarily synthesized in the liver and reflects systemic inflammation, PTX3 is rapidly induced and synthesized locally in various cell subsets under stimulation with inflammatory cytokines, mainly TNF-α. 6,8 Several clinical investigations demonstrated elevated plasma PTX3 levels in cardiovascular disease, which is the main consequence of metabolic syndrome. Because NAFLD is an ongoing inflammatory condition and hepatic manifestation of metabolic syndrome, we investigated the inflammatory biomarker PTX3 and its triggering cytokine TNF-α in patients with different histologic severities of NAFLD.
In this study, we found that plasma PTX3 and TNF-α levels are higher in patients with NASH than in those with a more benign form of NAFLD, namely non-NASH. Also, higher plasma PTX3 levels were associated with a higher fibrosis grade, although the correlation between plasma PTX3 levels and fibrosis grade was weak. We tested the strength of PTX3 in differentiating NASH from non-NASH in two ways. First we performed multiple logistic regression analysis by using age, gender, TNF-α, and HOMA-IR. Second we performed analysis of covariance by using factors like fibrosis stage, steatosis grade, age, sex, TNF-α, and HOMA-IR, which may have confounding impacts on the association between PTX3 and steatohepatitis. In both analyses, plasma PTX3 remained significant in terms of differentiating NASH from non-NASH.
During the last decade, a growing body of evidence has supported the notion that NAFLD is a feature of the metabolic syndrome, 23 It is also clinically documented that NAFLD patients with metabolic syndrome have greater histologic severity 24 and that metabolic syndrome risk factors are associated with higher hs-CRP levels. 25,26 Cardiovascular studies reported PTX3 as a sensitive marker of inflammatory response and cardiovascular disease independently from metabolic risk factors, unlike hs-CRP. 27,28 Besides, there was no correlation found between plasma concentrations of PTX3 and CRP. 28,29 Although hs-CRP levels were significantly higher in NAFLD patients than controls in our study, hs-CRP levels did not differ between NASH and non-NASH subgroups. In addition to the absence of correlation between hs-CRP and NAS and fibrosis, we also could not show any correlation between hs-CRP and PTX3 levels, consistent with the studies mentioned above. Because of these differences between PTX3 and hs-CRP, it is important to demonstrate the advantages of using PTX3 instead of hs-CRP for effective discrimination of NASH patients within the large NAFLD population.
Yoneda et al. 30 conducted a study with liver biopsied 70 NAFLD patients in 2008 and showed that plasma PTX3 was useful for differentiating NASH patients from non-NASH ones and PTX3 levels increased with the increasing fibrosis stages. In a recently published paper, a limited number (32) of NAFLD patients with liver biopsy were examined but no significant difference in comparison of NAFLD cases versus control, NASH versus non-NASH, or lower versus higher degrees of fibrosis and steatosis were found in terms of PTX3 levels. 31
Different from the study of Yoneda et al., 30 we investigated plasma PTX3 and its main stimulating cytokine TNF-α concomitantly, and also we evaluated the histology of liver biopsies with a well-known and widely used scoring system in clinical trials, called NAS. Furthermore we demonstrated that NAS was well correlated both with PTX3 and TNF-α with a stronger correlation to former. Another dissimilarity was the absence of relation between plasma PTX3 and steatosis grade in the study of Yoneda et al., whereas our study showed a significant correlation between plasma PTX3 levels and the histologic grade of steatosis.
After applying multiple logistic regression analysis and analysis of covariance to diminish any confounding impact, PTX3 levels were still significantly higher in the NASH subgroup compared with the non-NASH subgroup, so we aimed to determine an optimal cutoff level for PTX3 with acceptable PPV and NPV values to distinguish NASH from non-NASH. The optimal cutoff value found in our study was 2.45 ng/m with a sensitivity of 91.1%, specificity of 71.4%, PPV of 76.1%, and NPV of 88.9%. Yoneda et al. established the plasma PTX3 level as 1.61 ng/mL to set NASH patients apart from non-NASH ones, which is a lower value compared with the cutoff level defined in our study.
Several limitations are inherent in this study. First, although there is no study about this issue with a larger scale, the relatively small sample size limits the generalizability of our conclusions. Second, our patient group consists of subjects with Turkish nationality, so that results may not be extrapolated to populations with different ethnic backgrounds. Third, we were unable to assess PTX3 with immunohistochemical analysis in liver biopsy materials. Such data would generally provide more information about the source of elevated circulating PTX3.
In conclusion, the present study demonstrated markedly higher plasma PTX3 levels in NAFLD patients than controls, and in biopsy proven NASH patients than the non-NASH ones and showed that plasma PTX3 may be a promising biomarker for the presence of NASH. Further evaluation of plasma PTX3 levels in larger numbers of biopsy-proven NAFLD patients is recommended to assess any possible clinical usefulness of PTX3 for the noninvasive evaluation of NAFLD.
Footnotes
Author Disclosure Statement
No competing financial interests exist.