
Abstract
Background:
We studied the prevalence of metabolic syndrome (MetS) among Indians from a low-income community and evaluated the relationship between physical behavior patterns and anthropometric measures and the presence of MetS.
Methods:
The modified WHO STEPS questionnaire was used to collect data from a randomized sample of 1154 subjects from the Indian community of Phoenix, Durban. MetS was classified according to the harmonized criteria.
Results:
The median age of the sample was 47 (37–55) years, and 72% were predominantly females. There was a high prevalence of elevated body mass index (BMI) in 757 subjects (66%), which increased to 901 subjects (82%) when the ethnic-specific Asian cutoff (BMI ≥23) was applied. Overall increase in waist circumferences was noted from 60% to 79% when ethnic cutoffs were applied. Vigorous exercise was associated with a significant decrease in waist and BMI measurements (P < 0.0001). The prevalence of MetS increased from 30% and 57% (NCEP) to 45% and 60% in males and females, respectively, when the harmonized criteria (IDF and WHO) were applied. Fasting insulin and total cholesterol emerged as independent determinants of MetS for both genders. Neck circumference and HbA1c were also significant predictors of MetS in males. In females, midarm circumference (IDF/WHO) and HbA1c (modified NCEP) emerged as additional predictors of MetS.
Conclusion:
There was a high prevalence of obesity and MetS in this sample, related to sedentary behavior patterns. Neck and arm circumferences as well as total cholesterol may also serve as screening measures to increase the detection rate of MetS.
Introduction
C
Metabolic syndrome (MetS) is a clustering of multiple inter-related cardiometabolic risk factors, such as high blood pressure, hyperglycemia, central adiposity, and dyslipidemia. Recent evidence suggests that in addition to abdominal adiposity, other body measurements might be useful in determining the predisposition to risk factor clustering in the MetS.
While abdominal (visceral) adiposity has been recognized as a superior risk factor for cardiovascular and metabolic diseases than general (subcutaneous) adiposity, there are little data on other cutaneous measures of body fat. 7 More recent data have suggested that the current cutoffs for defining overweight and obesity are not suitable for Asians since Asians are at risk of developing lifestyle-related disease at lower levels of measures of obesity. 3 Since body mass index (BMI) fails to distinguish between body fat, muscle mass, and bone and because of this lack of accuracy in the assessment of body fat, there has been a growing amount of research to find other measures of body fat percentage. 7 This study also sought to identify other measures of MetS, which are easily accessible and inexpensive to adopt in clinical settings.
To date, several different sets of criteria have been used in the diagnosis of the MetS. 8 –10 In 2009, the harmonized criteria were established, with all the different institutes contributing to one universal definition with ethnic-specific waist circumference measurements included in the criteria. 5 The harmonized criteria were used in this study, together with the NCEP criteria stated in the article published by Grundy et al., which have ethnic-specific cutoffs. 10
Aim
This study was done to determine the risk factor profile in a low-income Indian community and relate this to the body habitus and physical behavior patterns.
Materials and Methods
Study subjects
The study sample consisted of 837 women and 317 men from the Phoenix Lifestyle Project (PLP), a community survey of cardiovascular (CV) risk factors by the WHO and the University of KwaZulu-Natal. The PLP included 1400 randomly selected individuals using a method for selecting members within a household to be interviewed. The Kish method uses a pre-assigned table of random numbers to select the person within the household to be interviewed. Lifestyle questionnaires were conducted with the participants during the selection process. The subjects with a full data set who completed the questionnaire as well as the physical assessment were included in the analysis for this study.
Anthropometric measurements
Participants underwent a physical examination, which included anthropometric measures using the American College of Sport Medicine's Guidelines for Exercise Testing and Prescription. 11 The anthropometric measurements were performed by a trained biokineticist (Y.D.). The WHO STEPS Instrument used in the study did not allow for multiple measurements to be collected, and therefore, coefficient of variation analysis was not performed. Measures included height and weight; triceps skinfold thickness; and circumferences of the neck, midarm, waist, and hip. Using an appropriate cuff size, blood pressure and heart rate were measured with an automatic blood pressure recorder (Omron Healthcare).
Laboratory measurements
Fasting blood samples for lipid, glucose, and insulin estimations were drawn from the cubital vein. Thereafter, each participant ingested 75 grams of glucose monohydrate in 250 mL water, and a further blood sample for glucose and insulin estimations was drawn 2 hr later. Blood samples were delivered within a maximum of 1 hr of collection to the Chemical Pathology Laboratory at the hospital.
Statistical analyses
All data were captured on SPSS (Statistical Package for the Social Sciences, version 16), which was also used for statistical analysis, along with SAS (Statistical Analysis System, version 9.3) software. Summary statistics were expressed as mean ± SD. Pearson's correlation analysis was used to correlate continuous physical behavior variables with anthropometric measurements. As stated above, subjects were classified into those with and without MetS using the harmonized criteria as well as the modified NCEP criteria (Table 1). Unadjusted and adjusted logistic regression analyses were performed with MetS as the dependent variable to achieve the last objective. Physical behavior patterns and anthropometric measures were included as independent variables, with the aim of establishing the independent effects of these variables on MetS.
Results
There were 1154 subjects in this study: 317 (28%) males and 837 (72%) females, with the median age of 47 (37–55) years. Using the WHO criteria based on Caucasians, only 29% of subjects were in the normal BMI category. Of the 29% of subjects who were categorized as normal, 41.9% were males. The remaining subjects were categorized as either overweight (31.8%) or obese (33.8%). Using the modified criteria for Asians 5 (which do not have an underweight category), the percentage of normal subjects (BMI <23) decreased further to 18.2%. The Asian-specific cutoff resulted in most participants being recategorized into the obese category (68.2%). The WHO criteria showed that 33.7% of males and 31.3% of females were overweight, with 13.1% of males and 41.8% of females being obese. When the Asian-specific cutoffs were applied, the obese category increased to 50.7% in males and 74.4% in females, with a resultant decrease in the overweight category to 18.9% in males and 11.8% in females.
The demographic and metabolic characteristics of the overall sample are shown in Table 2. Analysis of the waist circumferences revealed that the prevalence of abdominal obesity in males increased from 20% to 39% (NCEP) and to 54% (WHO and IDF harmonized criteria) and in females from 75% to 88%. Low HDL levels were present in just over 25% of males and 50% of females. MetS was present in 50% (31% males and 57% females) of the sample (NCEP). This prevalence increased to 54.3% after applying the ethnic-specific levels. The harmonized IDF and WHO criteria yielded higher prevalence values for MetS in males (45%) and females (60%).
Values expressed as median (IQR).
IQR, interquartile range.
All variables inclusive of the MetS criteria as well as the OGTT and HOMA-IR were initially included in the adjusted model to determine predictors of the MetS. Although the fasting glucose, OGTT, and HOMA-IR were significant in the univariate analysis in male participants, this fell away when they were included in the adjusted model. Similarly, in females, only fasting glucose and HOMA-IR remained significant in the adjusted model. Thereafter, variables other than the criteria used in the diagnosis of MetS were analyzed as predictors. These variables were BMI; hip, midarm, and neck circumferences; mean triceps skinfold thickness; fasting insulin; total cholesterol; LDL-cholesterol; HbA1c; and vigorous recreational exercise per week. After including 10 variables in the adjusted model, only fasting insulin and total cholesterol emerged as additional common predictors of MetS for both males and females for all definitions of MetS (Figs. 1 –6). In addition in males, neck circumference and HbA1c were also significant predictors (IDF/WHO). In females, midarm circumference (IDF/WHO) and HbA1c (modified NCEP) emerged as additional predictors of MetS. Women had 36% greater odds of being diagnosed with MetS for every 1-U increase in HbA1c (P < 0.0001).
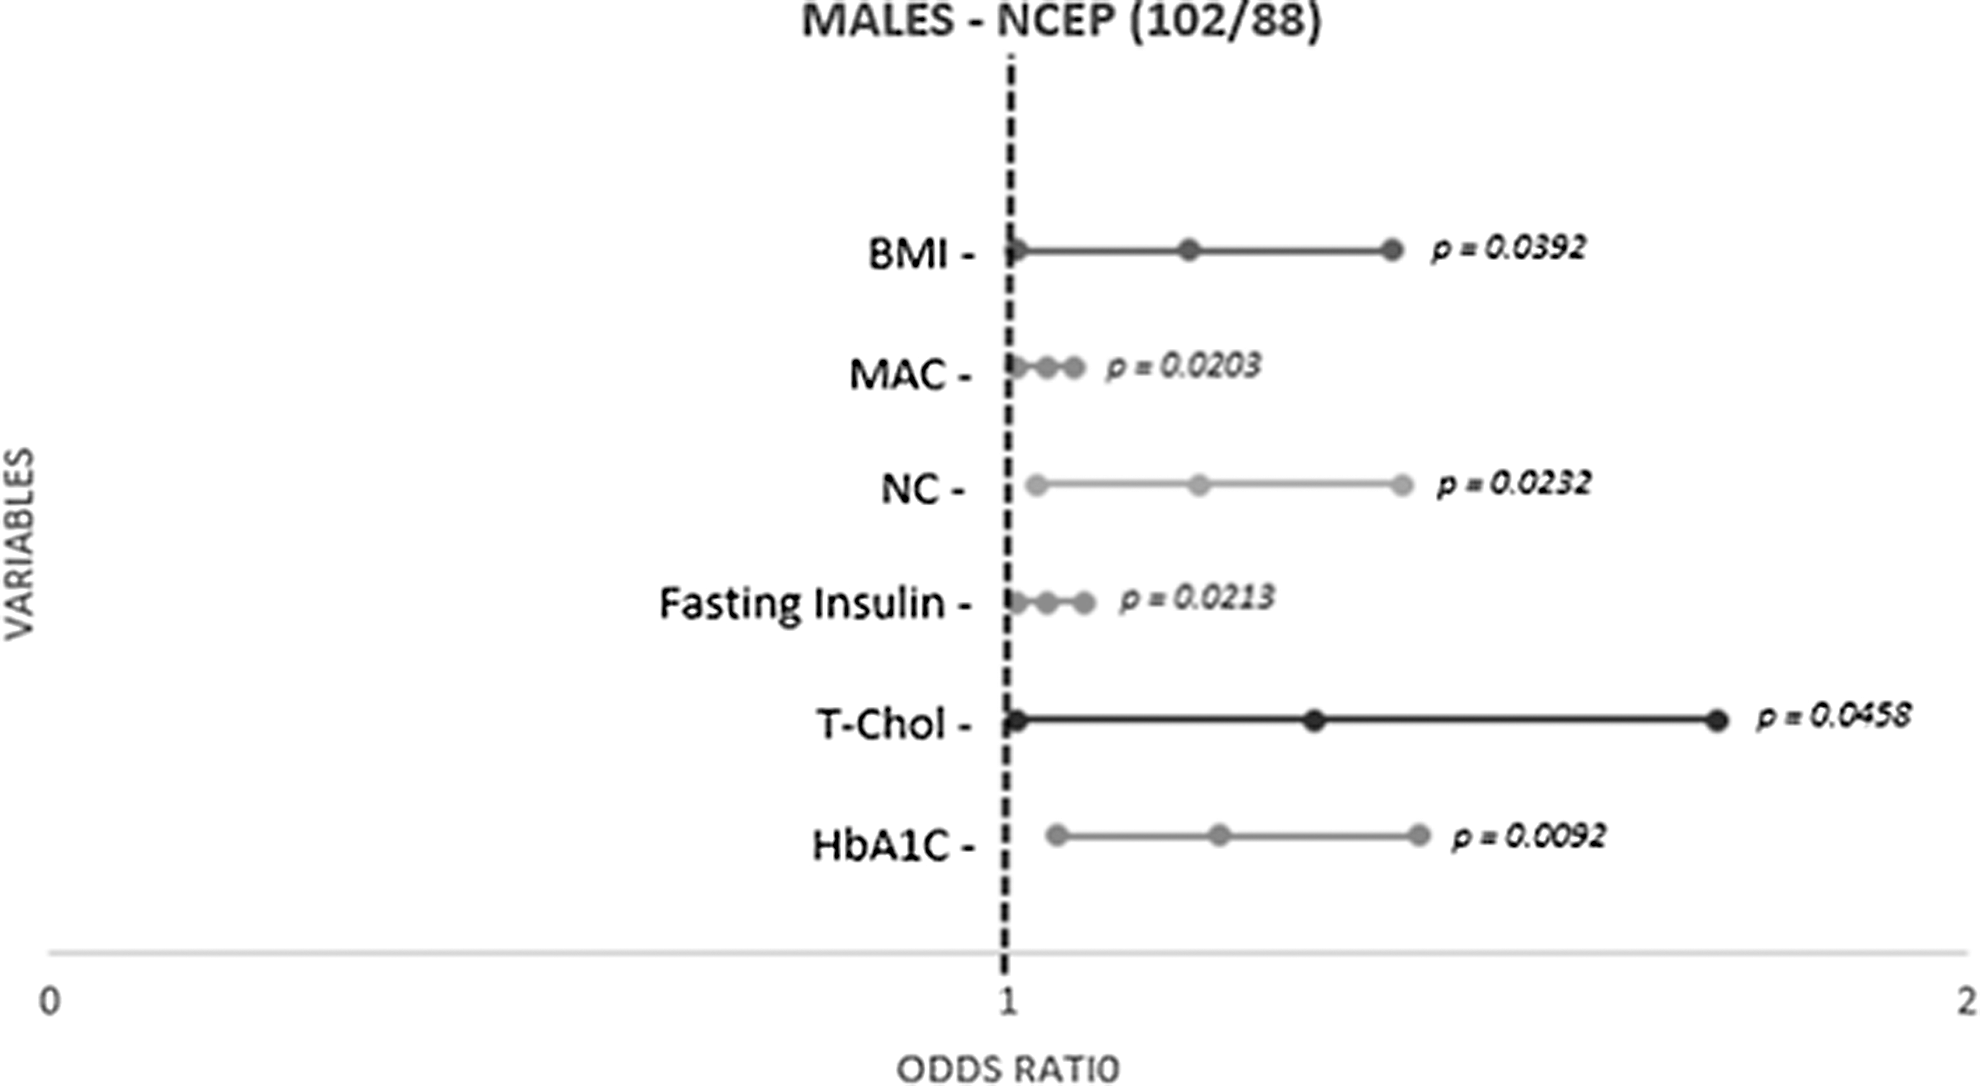
Predictors of metabolic syndrome in males using NCEP criteria with waist circumference measurement cutoff of 102/88 cm.
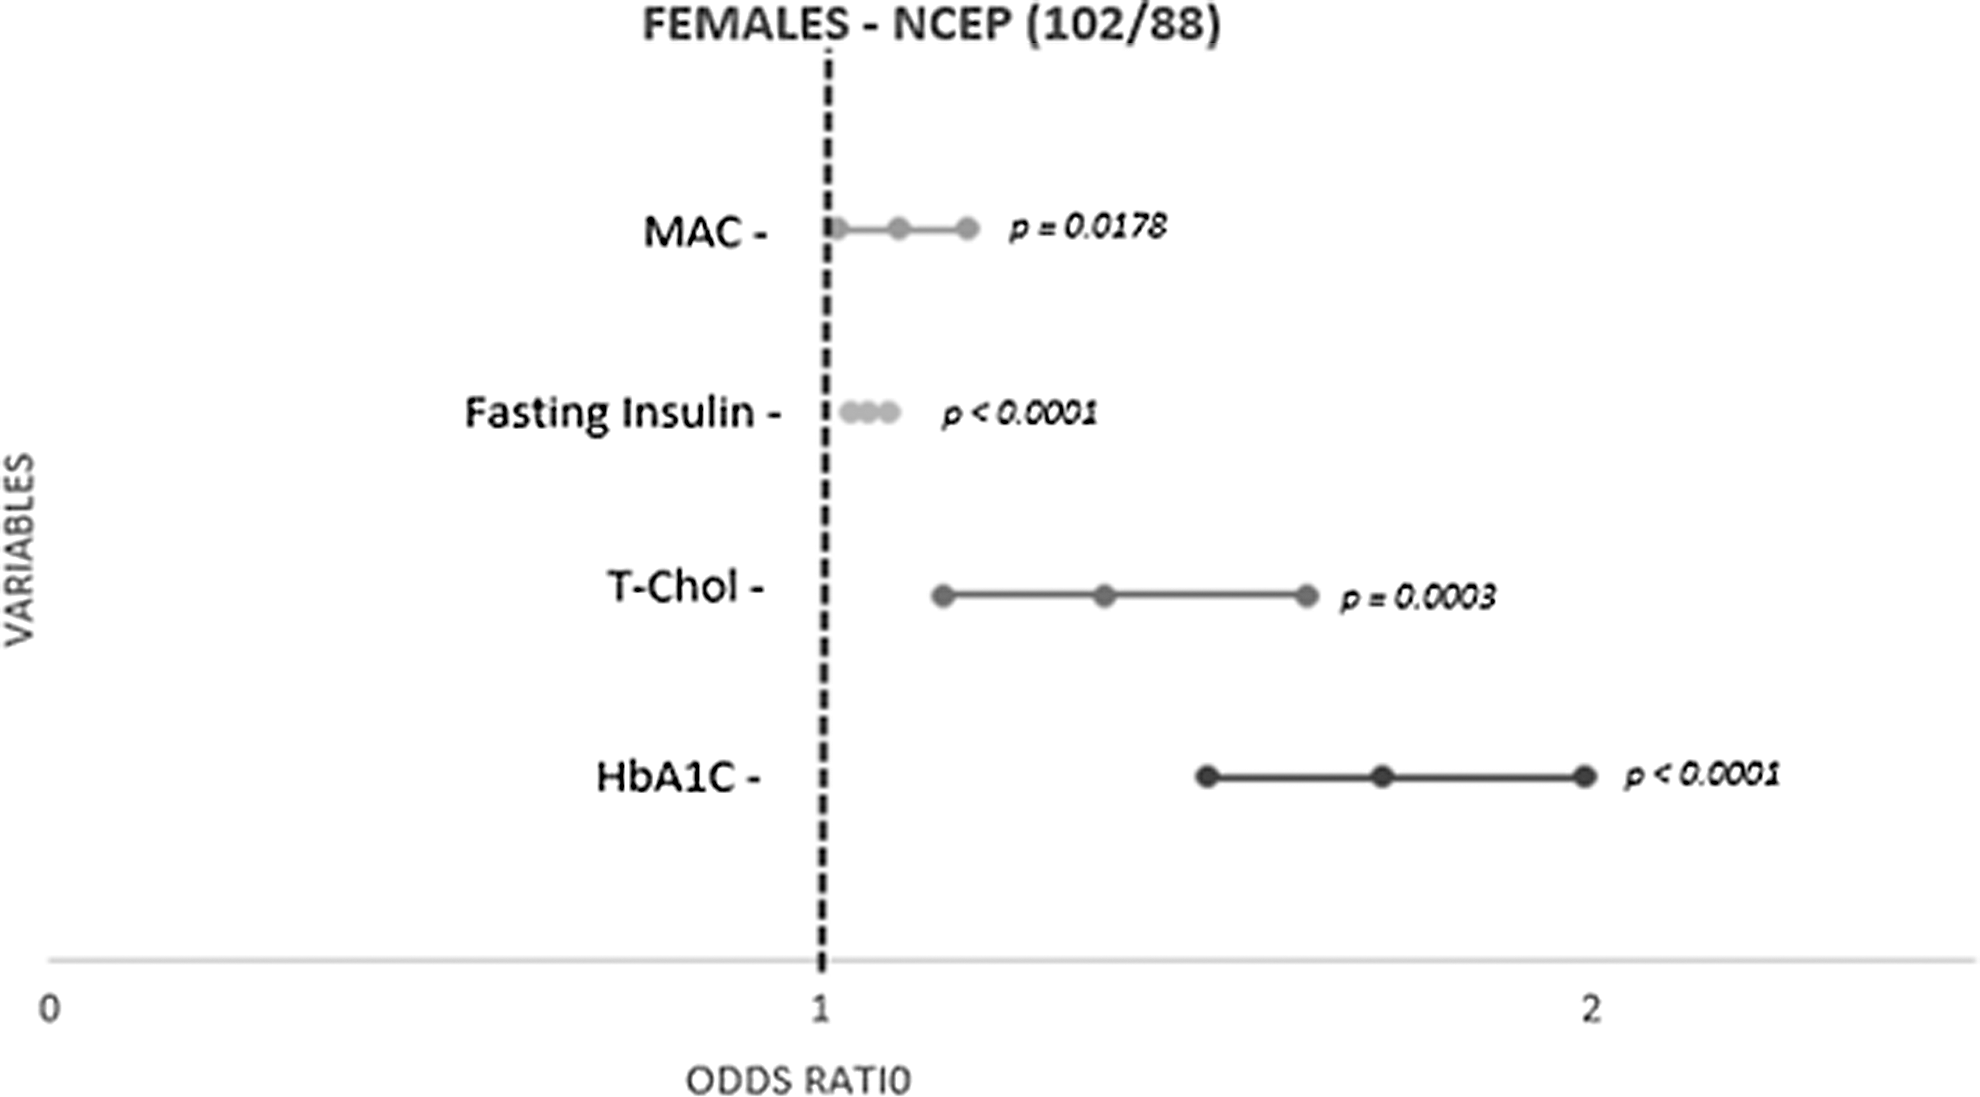
Predictors of metabolic syndrome in females using NCEP criteria with waist circumference measurement cutoff of 102/88 cm.
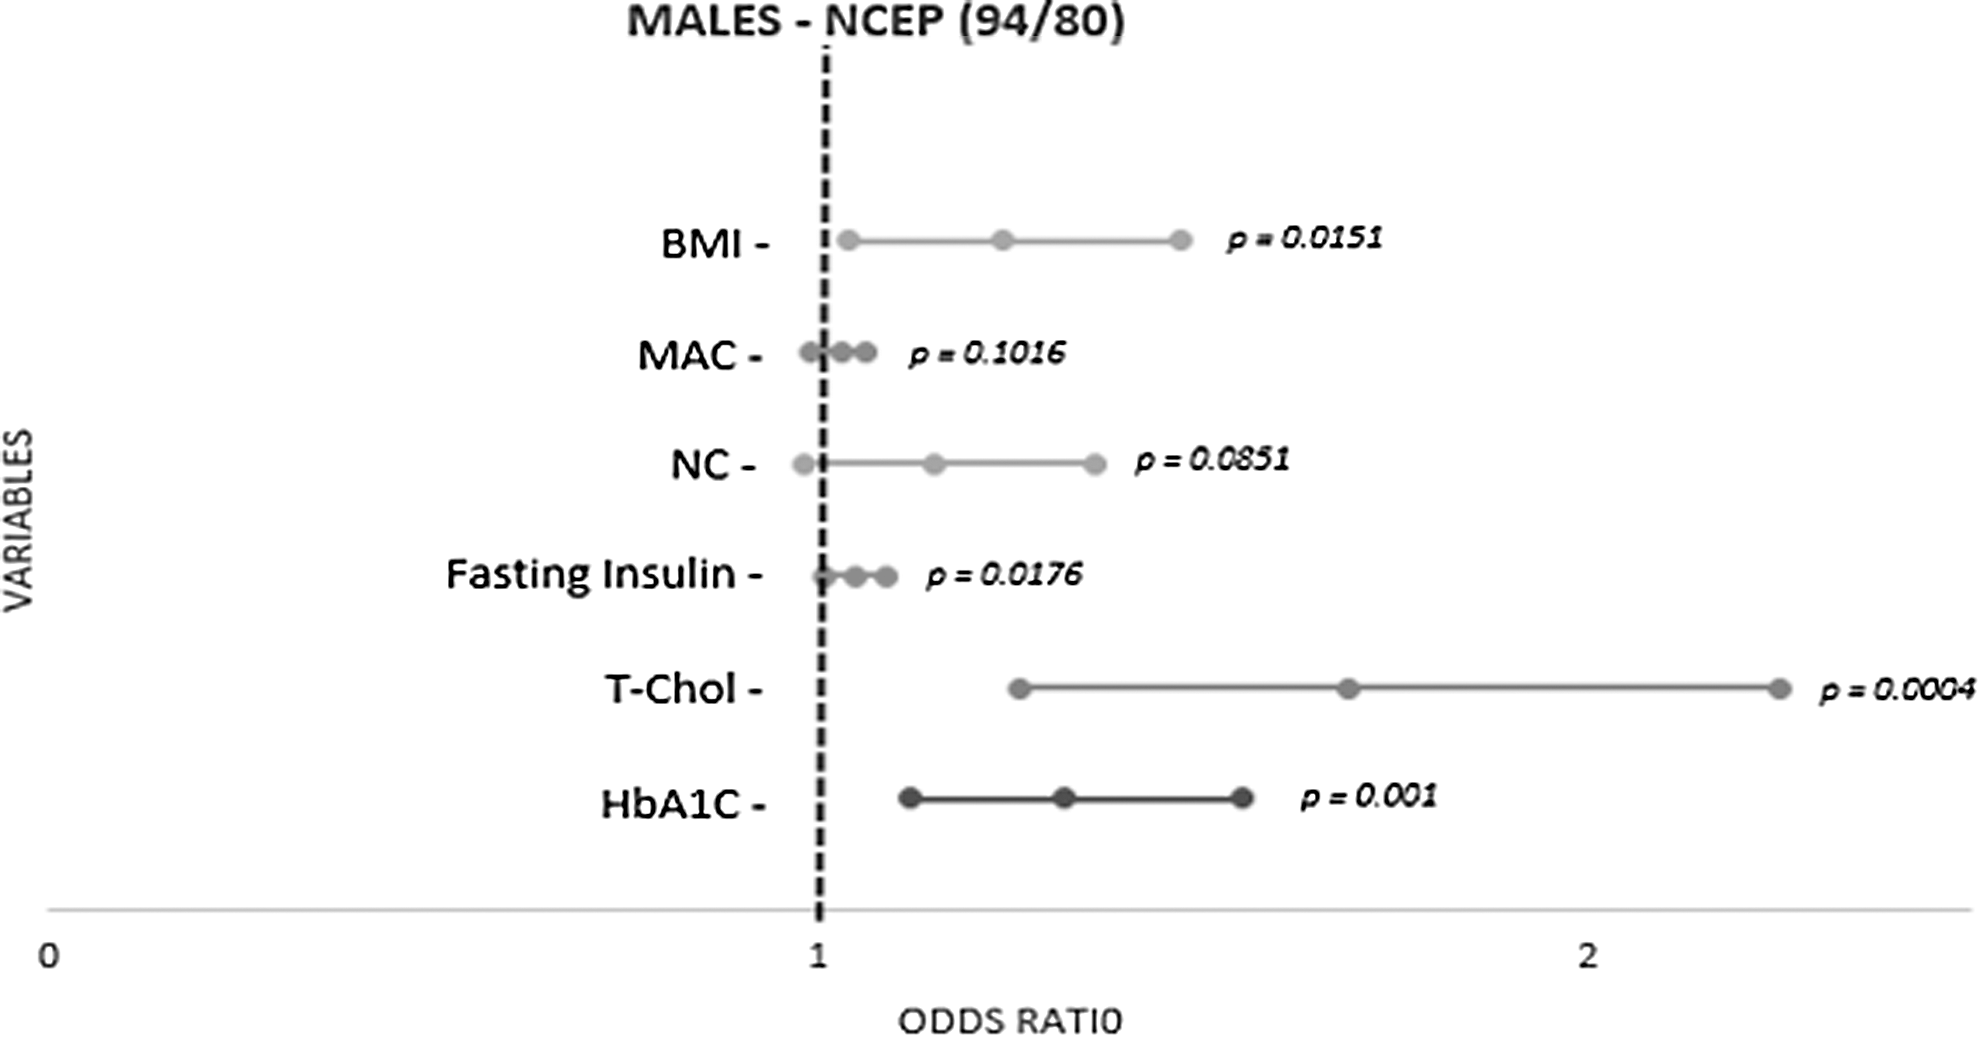
Predictors of metabolic syndrome in males using NCEP criteria with waist circumference measurement cutoff of 94/80 cm.
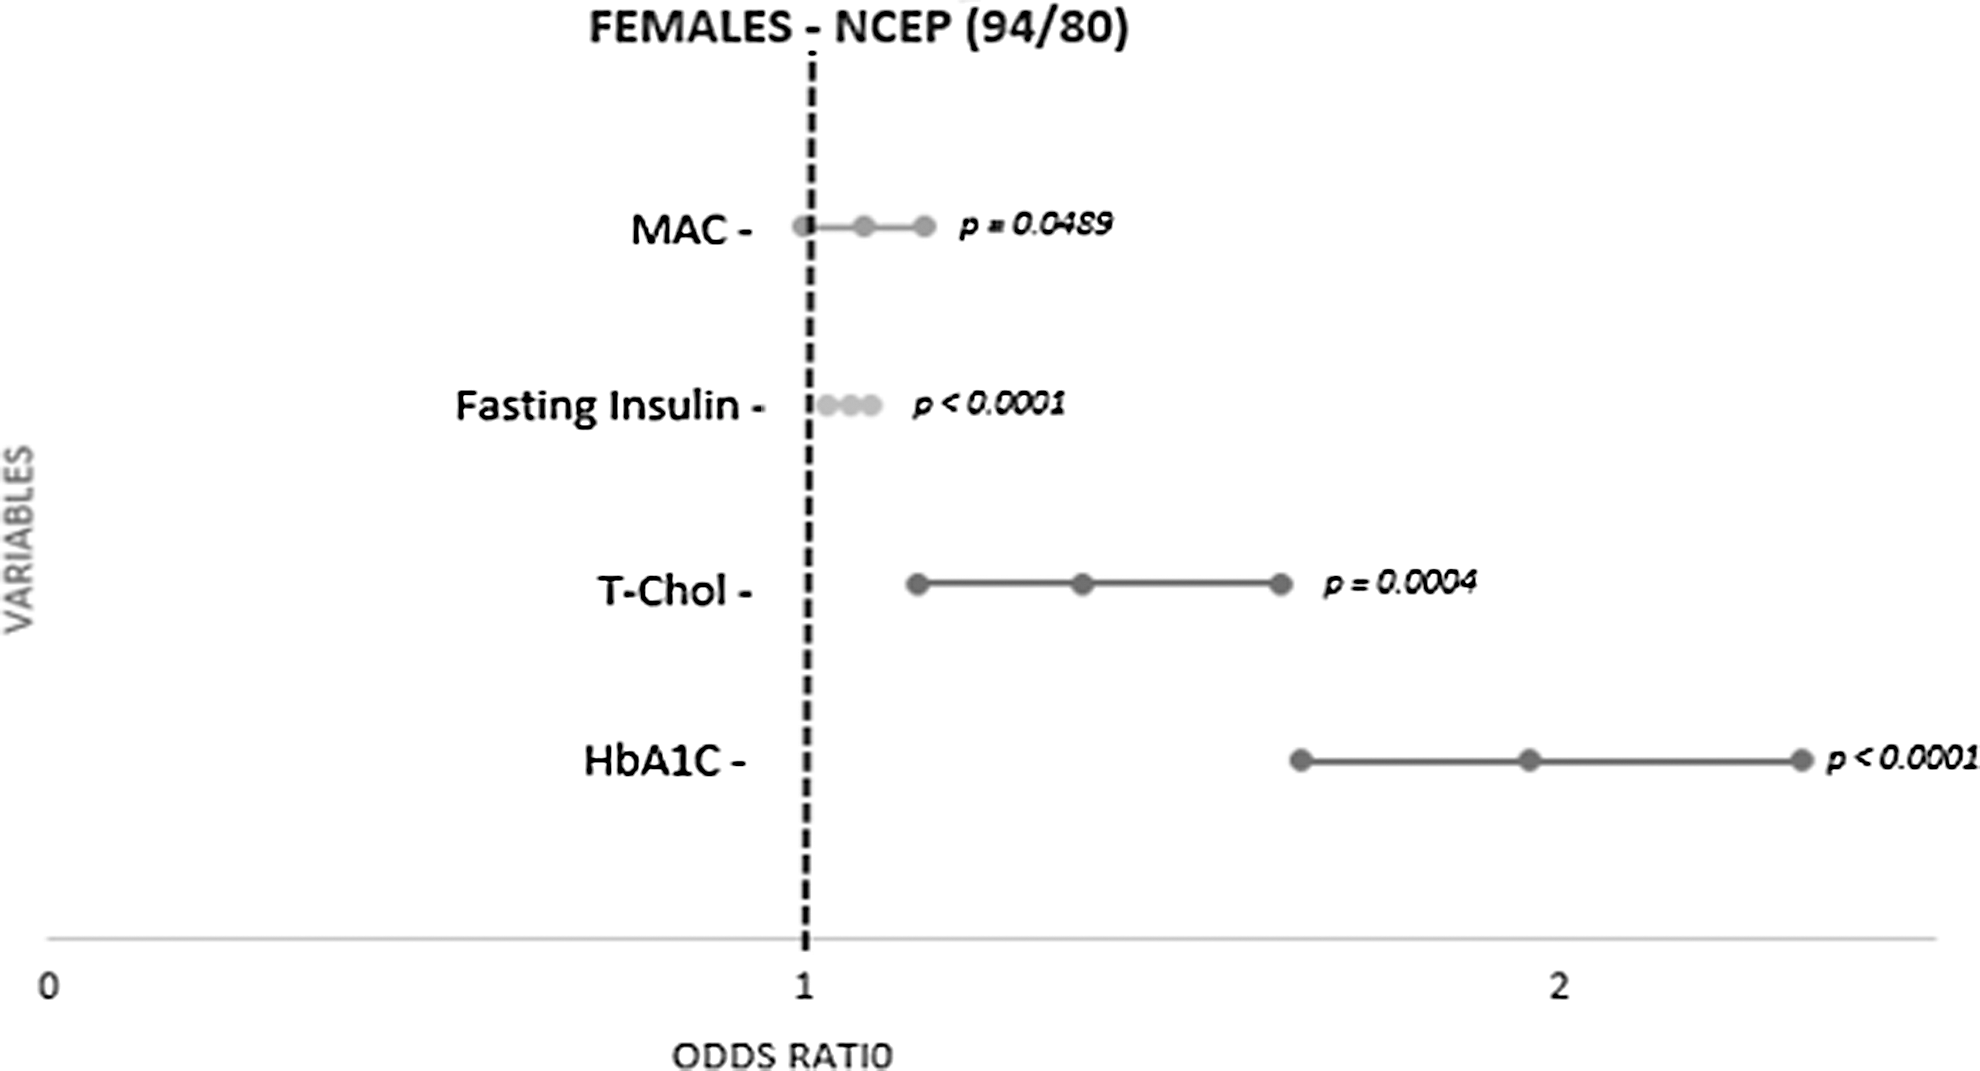
Predictors of metabolic syndrome in females using NCEP criteria with waist circumference measurement cutoff of 94/80 cm.

Predictors of metabolic syndrome in males using IDF/WHO criteria with waist circumference measurement cutoff of 90/80 cm.
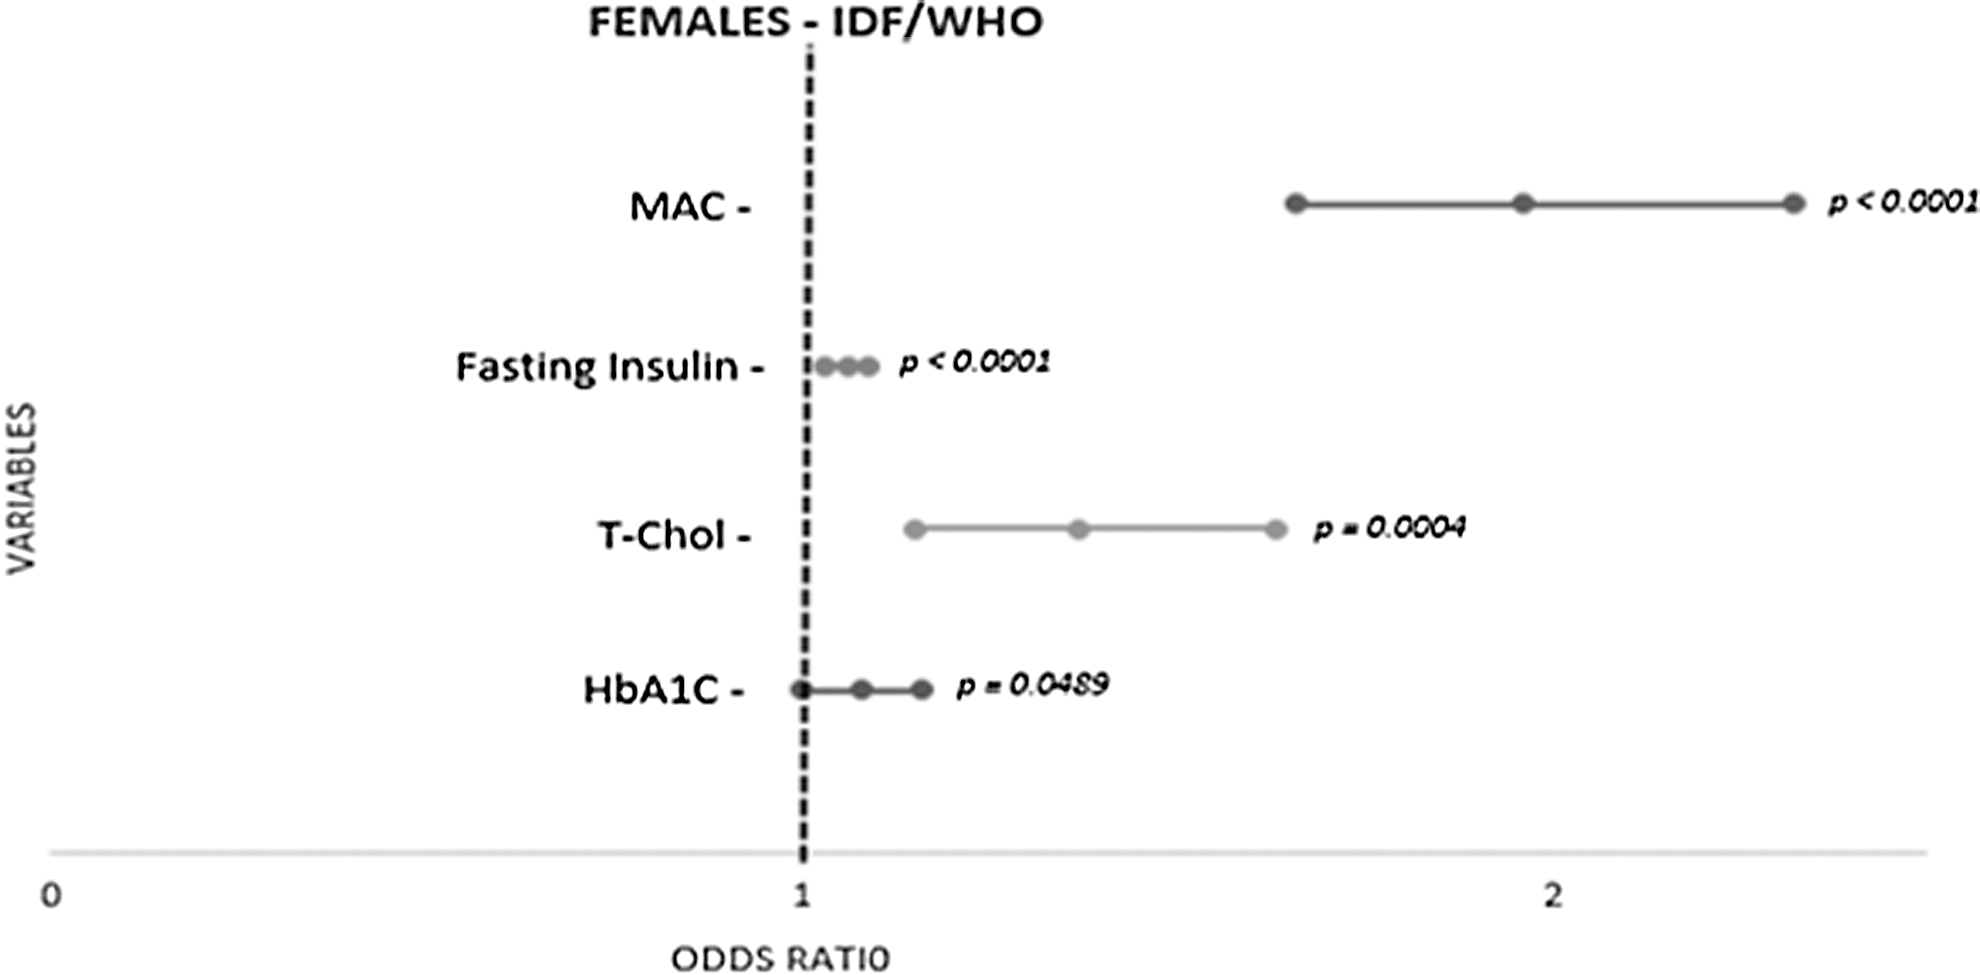
Predictors of metabolic syndrome in females using IDF/WHO criteria with waist circumference measurement cutoff of 90/80 cm.
Analysis of physical activity and its relationship with body measurements revealed that vigorous exercise was significantly associated with decreased BMI (P < 0.0001) and decreased waist circumference (P < 0.0001). For every 1 hr of vigorous exercise performed, BMI was reduced by 0.5 kg/m2 and waist circumference by 1.3 cm.
Discussion
This study shows a high prevalence of MetS in this randomly selected sample in the Phoenix Indian community. The main drivers influencing the rapid transition are nutrition patterns, lifestyle, and socioeconomic shifts, consequent upon rural-to-urban migration. 12
Epidemiological studies have reported a high prevalence of MetS and cardiovascular mortality among Indians settled abroad. In a study conducted on Indian immigrants settled in the United States for more than 13 years, 40% of men and 28% of women were diagnosed with MetS (NCEP criteria). 13 Similar studies have reported 26% of Indian Canadian and 12% of Mauritians with MetS (NCEP criteria). 12 Emigration and urbanization probably account for the significant increase in risk factor prevalence, accounting for the high prevalence of MetS in our study of low-income South African Indians. 13,14 The high prevalence of MetS among the Indian population in our study is in keeping with the data reported in other population groups in South Africa. Erasmus et al. have reported prevalence of 60.6% (IDF) and 55.4% (NCEP) for the colored population in Cape Town. 15 Among corporate executives, however, a lower prevalence of 35% was reported by Ker et al. (2007) using the NCEP criteria. 16 Another study focusing on Caucasian and African women, who were equally matched for age and BMI, revealed that 30.4% of Caucasian and 24.8% of African women have MetS (IDF). 17
To date, most epidemiological studies on South African Indians have reported the major CV risk factor prevalences, but there have been no reports of the prevalence of MetS in this race group. 18 A study reported by Ranjith et al. showed a very high prevalence of MetS (NCEP 60% and IDF 57%) in young Indians with myocardial infarction. 19 Ranjith et al. showed that MetS was more predominant in females compared to males (NCEP) (P = 0.043), but there was no significant gender difference when the IDF definition was applied. 19 In our analysis, regardless of which criteria were used, MetS was also more common in females with a high prevalence across the definitions and, as expected, increased when the ethnic-specific waist measurements were applied. Increased waist circumference was present in 78.5% (IDF) of subjects making waist circumference the main driver of MetS in the whole sample. This was followed by raised blood pressure, which was equally present in males and females (57%–58%).
This study also revealed other anthropometric measurements and blood chemistry as predicators of MetS. Interestingly, total cholesterol, neck circumference, and HbA1c were also significant predictors of MetS (IDF/WHO), as was midarm circumference in women (IDF/WHO), offering simpler screening measures to detect MetS in this community. In the model inclusive of the MetS criteria, neck circumference was significant in males in the unadjusted but not in the adjusted model. When the MetS criteria were excluded, neck circumference remained a significant predictor of MetS in the adjusted model. Similarly, we have shown that in females, in the model inclusive of the MetS criteria, midarm circumference was significant in the unadjusted but not in the adjusted model (IDF). When the MetS criteria were excluded, midarm circumference remained a significant predictor of MetS in the adjusted model. This suggests that the neck circumference in males and the midarm circumference in females should be included as additional criteria in the diagnosis of MetS.
This study revealed an alarmingly high prevalence of obesity in this population. Using the harmonized criteria with ethnic cutoff levels, the prevalence of obesity rose from 34% to 68%. At least half of the males and three quarters of the females were obese. Abdominal obesity was also as common in males (54% WHO and IDF harmonized criteria) and in females (88%). This finding of generalized obesity is in contrast to published data showing an increase in abdominal obesity only in the Indian population across the diaspora 20 and highlights the importance of applying the harmonized ethnic-specific criteria in determining obesity prevalence. Apart from the gender differences in the prevalence of obesity, we also found that low HDL was present in 27% of males and 50% of females. The gender difference in the prevalence of MetS in our study could therefore be accounted for by both elevated BMI (males: 46.8%; females: 73.1%) and decreased HDL (males: 26.6%; females: 49.8%).
In addition, there was a high prevalence of sedentary behavior patterns in this study. Of importance, vigorous exercise was significantly associated with decreased BMI (P < 0.0001) and decreased waist circumference (P < 0.0001). Seemingly obvious, this finding has serious clinical implications and suggest population-wide measures to curtail the onslaught of NCDs in this community.
The purpose of this study was to evaluate simple bedside measurements in predicting the MetS. We measured insulin to calculate the HOMA-IR for the purpose of this study. We have shown that measuring insulin and HOMA-IR did not have a higher predictor value than the traditional MetS criteria. In addition, we have shown that neck circumference in men and midarm circumference in women may be used as alternative measurements when waist circumference is difficult to measure.
Conclusion
This study has established that both generalized and abdominal obesity are the main drivers for the diagnosis of MetS in this community. Total cholesterol, HbA1c, and neck circumference may also be used to increase the detection of MetS. A greater need for community-driven programs to institute appropriate measures is urgently required to combat obesity and sedentary activity.
Footnotes
Acknowledgments
The authors would like to acknowledge the participants of the Phoenix Lifestyle Project, the study team, and statisticians for their contributions to the article. Ethical approval was obtained from the Biomedical Research Ethics Committee (BREC) of the UKZN (BE047/11).
Author Disclosure Statement
No competing financial interests exist.