
Abstract
Background:
Insulin resistance and glucose intolerance have been associated with increased plasma levels of branched-chain amino acids (BCAA). BCAA levels do not predict T2DM in the population. We determined the discriminative ability of fasting BCAA levels for glucose intolerance in nondiabetic relatives of patients with T2DM of two different ethnicities.
Methods:
Based on oral glucose tolerance test (OGTT), first-degree relatives of patients with T2DM were categorized as normal glucose tolerance, prediabetes, or T2DM. Included were 34, 12, and 18 Caucasian and 22, 12, and 23 Asian Indian participants, respectively. BCAA levels were measured in fasting plasma together with alanine, phenylalanine, and tyrosine. Insulin sensitivity and beta-cell function were assessed by indices derived from an extended OGTT and their relationship with plasma BCAA levels was assessed in multivariate regression analysis. The value of the amino acids for discriminating prediabetes among nondiabetic family members was determined with the area under the curve of receiver-operated characteristics (c-index).
Results:
BCAA levels were higher in diabetic than in normoglycemic family members in the Caucasians (P = 0.001) but not in the Asian Indians. In both groups, BCAA levels were associated with waist–hip ratio (β = 0.31; P = 0.03 and β = 0.42; P = 0.001, respectively) but not with indices of insulin sensitivity or beta-cell function. The c-index of BCAA for discriminating prediabetes among nondiabetic participants was 0.83 and 0.74 in Caucasians and Asian Indians, respectively, which increased to 0.84 and 0.79 by also including the other amino acids. The c-index of fasting glucose for discriminating prediabetes increased from 0.91 to 0.92 in Caucasians and 0.85 to 0.97 (P = 0.04) in Asian Indians by inclusion of BCAA+alanine, phenylalanine, and tyrosine.
Conclusions:
Adding fasting plasma BCAA levels, combined with phenylalanine, tyrosine and alanine to fasting glucose improved discriminative ability for the prediabetic state within Asian Indian families at risk for T2DM. BCAA levels may serve as biomarkers for early development of glucose intolerance in these families.
Introduction
T
In predominantly lean Chinese and Asian Indian men, this combined amino acid profile correlated with insulin resistance. 4 In healthy young adults, fasting plasma levels of BCAA, phenylalanine, and tyrosine were associated with an increase of the HOMA-insulin resistance index at 6 years follow-up. 5 Similarly, in obese children, elevated BCAA levels were positively associated with an increase in HOMA-insulin resistance index during the following 18 months. 6 In two independent prospective cohorts with normoglycemic adults followed for 12 years, elevated levels of these amino acids at baseline were associated with future development of T2DM. 7 Although fasting plasma amino acid levels have limited predictive value for future glucose intolerance and T2DM in the general population, 5,7 it may have a strong value for at-risk individuals. 7
Patients with the early onset of T2DM often descend from families with high risk of T2DM. This holds particularly for the Asian Indians living in the Netherlands, who develop T2DM at a young age and relatively low BMI, resulting in a fivefold increased risk of T2DM compared to Dutch Caucasians. 8,9 We approached first-degree family members of these patients and identified individuals with normal and impaired glucose tolerance. We hypothesized that the fasting amino acid profile with raised BCAA, phenylalanine, tyrosine, and alanine levels is a potential biomarker for the development of early glucose intolerance or insulin resistance in family analyses.
In the present study, we determined the value of fasting BCAA and other amino acid levels in discriminating glucose-intolerant from glucose-tolerant subjects in families with a high risk of T2DM.
Materials and Methods
Subjects
Index cases (individuals with T2DM) had been referred to the Outpatient Clinic of Internal Medicine at the Erasmus University Medical Center in Rotterdam for complications associated with their T2DM. First-degree relatives were invited for the study; this resulted in participation of individuals from 24 Caucasian families and 36 Asian Indian families living in the Netherlands, with two generations taken into account and an average of approximately two members of each family. Power calculation was performed with Quanto version 1.0 10 and was based on differences in early-phase insulin secretion response (described further on in Materials and Methods section) between healthy South Asian and Caucasian individuals, during a pilot phase of the study, with alpha 0.05 and power 80%. At least 17 individuals with normal glucose tolerance, based on oral glucose tolerance test (OGTT), were required.
Caucasian subjects had to be born in the Netherlands and both their parents had to be of ethnic Dutch Caucasian origin. Asian Indian subjects were eligible for the study if they were born in Surinam or the Netherlands and when both their parents were of Asian Indian origin. Subjects had to be at least 18 years old. The exclusion criteria were as follows: insulin-dependent diabetes mellitus, use of antidiabetic medication other than metformin, a history of pancreatitis, insulinoma, or other reasons, which made participation impossible. All participants underwent an OGTT and were diagnosed to have normal glucose tolerance, impaired glucose tolerance, or T2DM (normoglycemic, prediabetic, and diabetic) according to the WHO OGTT criteria. 11 Details about the study setup have been previously reported. 12
Written informed consent was obtained from all participants. All procedures followed were in accordance with the ethical standards of the responsible committee on human experimentation (institutional and national) and with the Helsinki Declaration of 1975, as revised in 2008. The study protocol was approved by the Erasmus University Medical Center Medical Ethics Review Board (MEC-2009-242).
In vivo measurements
After an overnight fast, each participant underwent an extended OGTT and venous blood samples were collected at 15 min before and 15, 30, 45, 60, 90, 120, 150, 180, and 210 min after the oral administration of 75 grams glucose. Fasting blood was collected at 60 min before administration of glucose and used to reflect the t = 0 value. Body length and weight were measured to the nearest 0.1 cm and 0.1 kg, respectively. Waist and hip circumferences were measured to the nearest cm in the standing position, halfway between the lowest rib and the iliac crest, and the maximum hip circumference, respectively.
Assays
Plasma glucose was measured by a hexokinase-based method (Gluco-Quant; Roche Diagnostics). Plasma insulin and C-peptide were measured by a competitive chemiluminescent immunoassay, supplied by Euro/DPC. The assay was performed on a DPC Immulite 2000 analyzer (Euro/DPC) according to the manufacturer's recommendations. Serum creatinine was measured in fasting blood with the Creatinine Plus assay on a Roche/Hitachi analyzer.
Amino acid analysis
The amino acid concentrations in fasting plasma samples were determined by HPLC after precolumn derivatization with ortho-phthaldialdehyde/3-mercaptopropionic acid (OPA/MPA) and detection by fluorescence. 13 In short, 25 μL of plasma was deproteinized with 25 μL 6% sulfosalicylic acid and, thereafter, derivatized with OPA/MPA in the borate buffer (pH 10). After 2 min, the reaction was neutralized with citric acid (1 M) and 5 μL was applied to a 4.6 × 50 mm 1.8 μm Eclipse C18 column (Agilent). The HPLC system consisted of two LC-10ADvp pumps, a SIL-10ADvp autosampler, and a RF-10Axl fluorescence detector (Shimadzu). The mobile phase A was 40 mM NaPi buffer (pH 7.8), and mobile phase B consisted of acetonitrile/methanol/water (45/45/10, v/v/v). A linear gradient with a flow rate of 0.5 mL/min was started at 2% B in A, ending at 45.7% B in A at 16 min. Thereafter, the column was re-equilibrated. Concentrations of BCAA, alanine, phenylalanine, and tyrosine in plasma were calculated as the average of duplicate work-up.
Calculations
Indices for whole body insulin sensitivity and beta-cell function were derived from the extended OGTT, which included 11 blood samplings in 3.5 hr for glucose, insulin, and C-peptide measurements, as described in detail previously. 12 The clamp-validated insulin sensitivity index (ISI) was calculated according to Matsuda. 14 As a marker of beta-cell function, the overall disposition index (DI) was calculated as the product of ISI and the insulin secretion response. 15 As a measure of renal function, the estimated Glomerular Filtration Rate (eGFR) was calculated with the Modification of Diet in Renal Disease (MDRD) formula. 16,17
Statistical analyses
Data are expressed as mean ± SD, unless indicated otherwise. Differences between subgroups were analyzed with ANOVA, followed by Bonferroni, and considered significant when P value <0.0125. Inverse or log transformations were used when normality or equal variance assumptions were not met. Pearson correlation coefficients were determined by multivariate regression analysis and considered significant when P value <0.05. As glucose intolerance and T2DM progresses with age in affected individuals, age was not included as an independent parameter in the multivariate regression analysis. The value of BCAA and other parameters in discriminating the individual's state of glucose intolerance was determined by binary logistic regression analysis adjusted for family ties. 18 Differences between the area under the curve of receiver-operated characteristics (ROC AUC, concordance index or c-index) were calculated according to Hanley and McNeil 19 and considered significant when P < 0.05. All statistical tests were conducted using SPSS software, version 15.0, for Windows (SPSS Inc.).
Results
Subject characteristics
Family members of 24 Caucasian and 36 Asian Indian index patients were included in the study. From the Caucasian families, 34, 12, and 18 participants were normoglycemic, prediabetic, and diabetic, respectively. These numbers were 22, 12, and 23 for the Asian Indians. The characteristics of these groups are shown in Table 1; OGTT AUC of plasma glucose, insulin, and C-peptide concentrations for all groups is depicted in Fig. 1. Among the Caucasians, there were significant differences between the diabetic and the normoglycemic subgroups with respect to age, waist circumference, waist–hip ratio (WHR), ISI, and DI, but not for body weight, BMI, or eGFR MDRD. For the DI, the prediabetic subgroup was intermediate between the normoglycemic and diabetic subgroup. The diabetic subgroup was significantly older than the prediabetic subgroup. For the other parameters, the prediabetic subgroup did neither differ significantly from the normoglycemic nor the diabetic subgroup. The Asian Indian family members were more homogeneous, as only differences were observed among subgroups for age and for the DI. Compared to the Caucasian T2DM patients, the Asian Indian patients with T2DM were younger (P = 0.004), shorter (P < 0.001), and weighed less (P = 0.005). No other remarkable differences between similar subgroups of both ethnicities were evident.
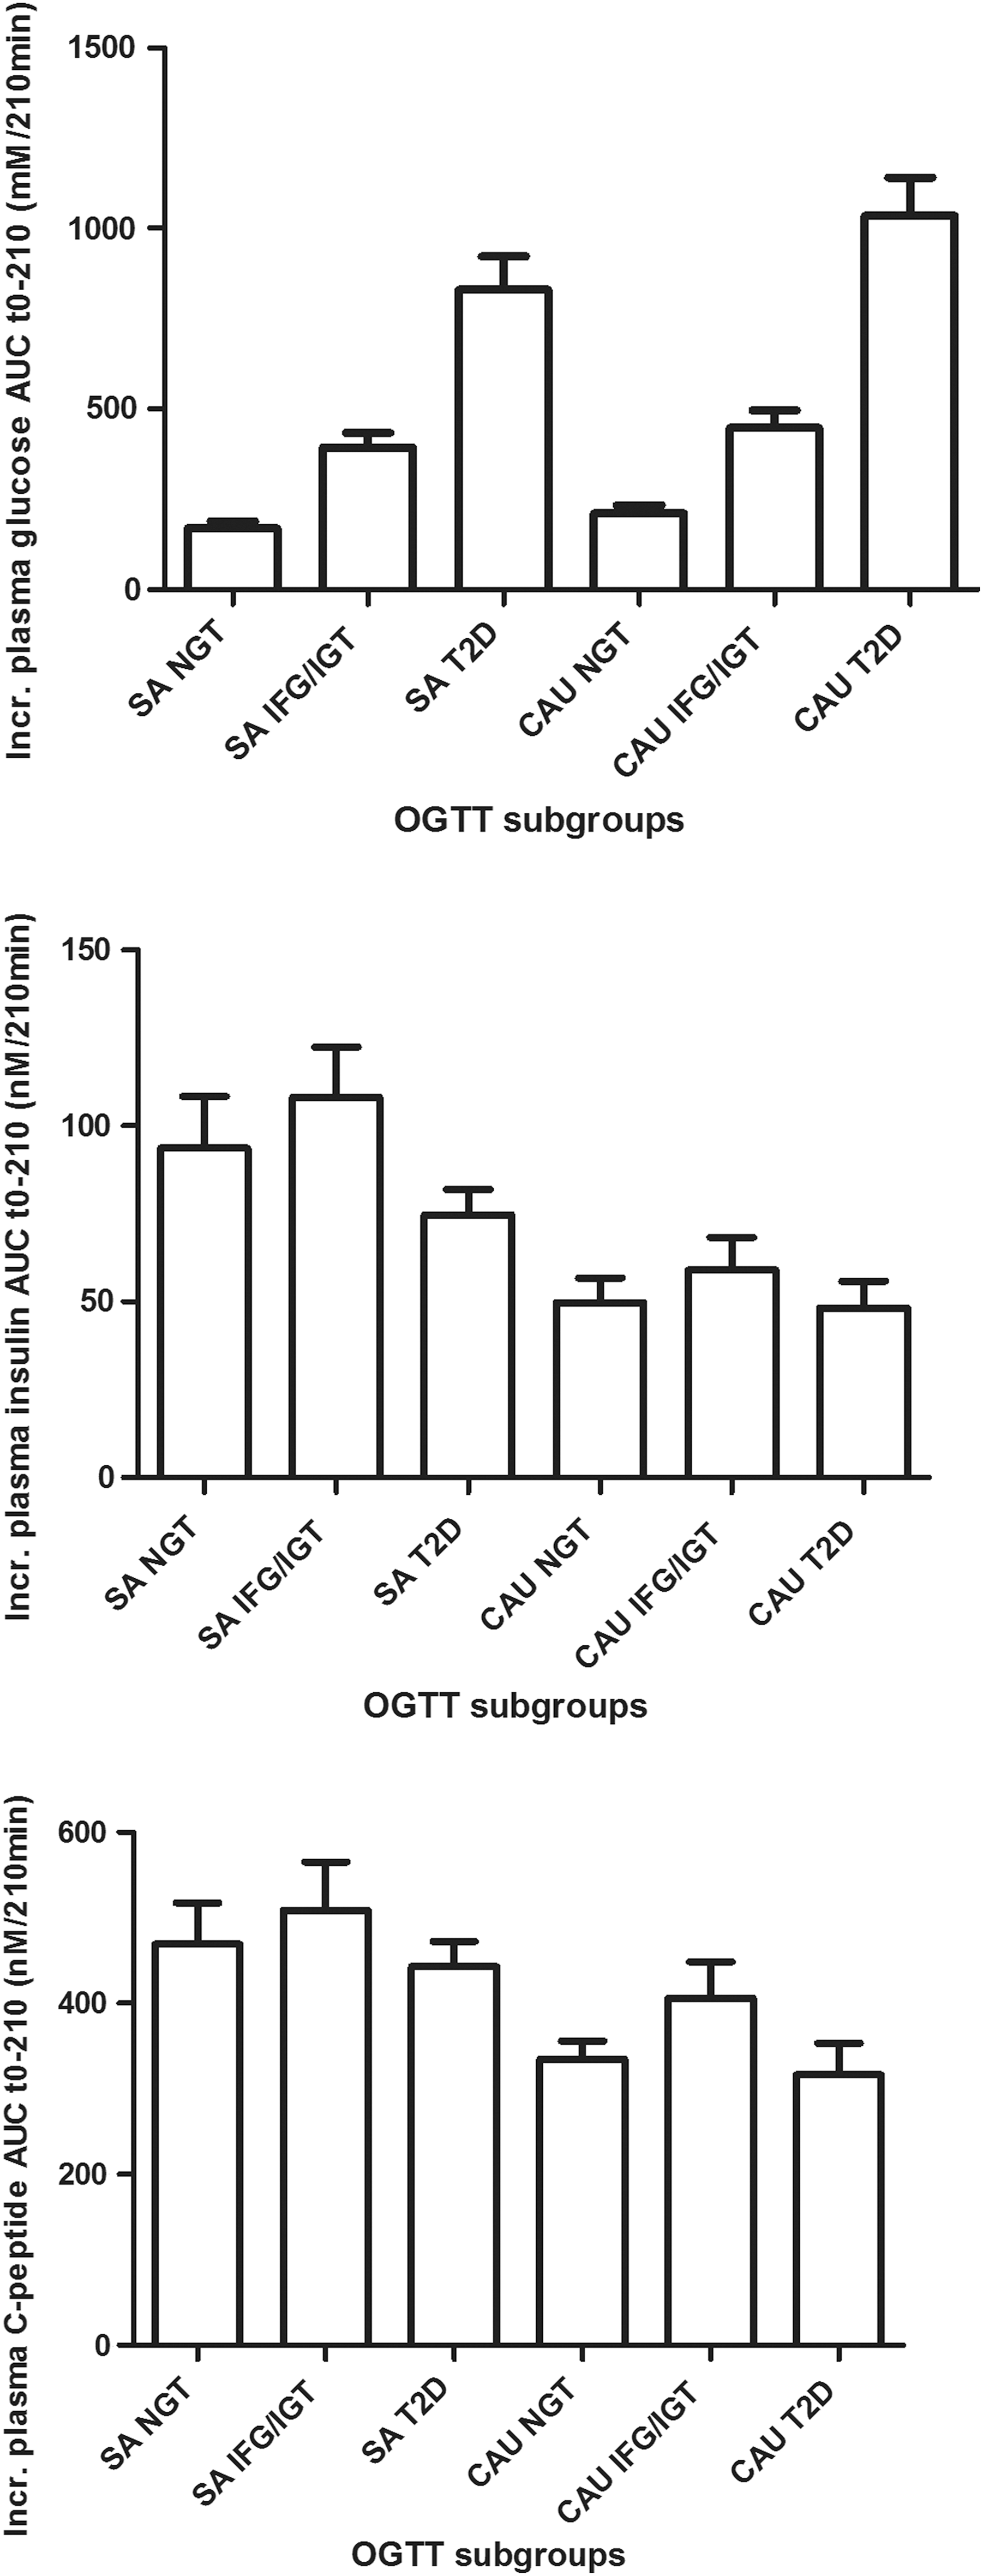
Incremental plasma AUC of glucose, insulin, and C-peptide during the 210 min oral glucose tolerance test (OGTT) (mean ± SEM) among WHO OGTT subgroups with normal glucose tolerance (NGT), impaired fasting glucose, and/or impaired glucose tolerance (IFG/IGT) and Type 2 Diabetes (T2D) from South Asian (SA) or Caucasian (Cau) origin. Increased (Incr.) plasma glucose AUC; SA NGT versus T2DM SA P < 0.001, SA IFG/IGT versus T2DM P < 0.001, Cau NGT versus Cau T2DM P < 0.001, and Cau IFG/IGT versus Cau T2DM P < 0.001. Incr. plasma insulin AUC; SA NGT versus Cau NGT P < 0.01.
Data are mean ± SD, except for ISI, insulin DI, and eGFR MDRD, which are in mean ± SEM. Symbols represent significance with P < 0.0125 in the corresponding subgroup versus other subgroups as stated in the Materials and Methods section; *versus Cau normoglycemics; †versus Cau prediabetics; ‡versus Cau diabetics; §versus AI normoglycemics; ||versus AI prediabetics; ¶versus AI diabetics.
AI, Asian Indians; BCAA, branched-chain amino acids; Cau, Caucasians; DI, disposition index; eGFR MDRD, estimated Glomerular Filtration Rate by Modification of Diet in Renal Disease; ISI, insulin sensitivity index; WHR, waist-hip ratio.
Fasting plasma amino acid levels
In the Caucasians, plasma levels of leucine, isoleucine, valine, alanine, phenylalanine, and tyrosine were all significantly higher in the T2DM than in the normoglycemic subgroup (Table 1). Although a similar trend is observed among the Asian Indians for most amino acids, none of the differences was significant. The Caucasian T2DM group had higher BCAA levels than the Caucasian normoglycemic group (P = 0.001). In contrast, the Asian Indian T2DM group did not have significantly higher total BCAA than the Asian Indian normoglycemic group (P = 0.21). There were no significant differences between fasting plasma amino acid levels between similar subgroups of the two ethnicities, except that most amino acids, including total BCAA, were higher in the normoglycemic Asian Indians than in the normoglycemic Caucasians. Notably, levels of total BCAA, phenylalanine, and tyrosine in the normoglycemic Asian Indians were not statistically different from the diabetic Caucasians. To replicate known relationships between BCAA and a number of traits, illustrated in Fig. 2, we have performed multivariate analyses that are shown in Table 2. In Caucasians, WHR significantly explained 15.4% (P = 0.03) of the variance in BCAA concentrations. In Asian Indians, WHR explained 32.5% (P = 0.001) and eGFR MDRD 9.5% (P = 0.009) of the variance in BCAA concentrations.
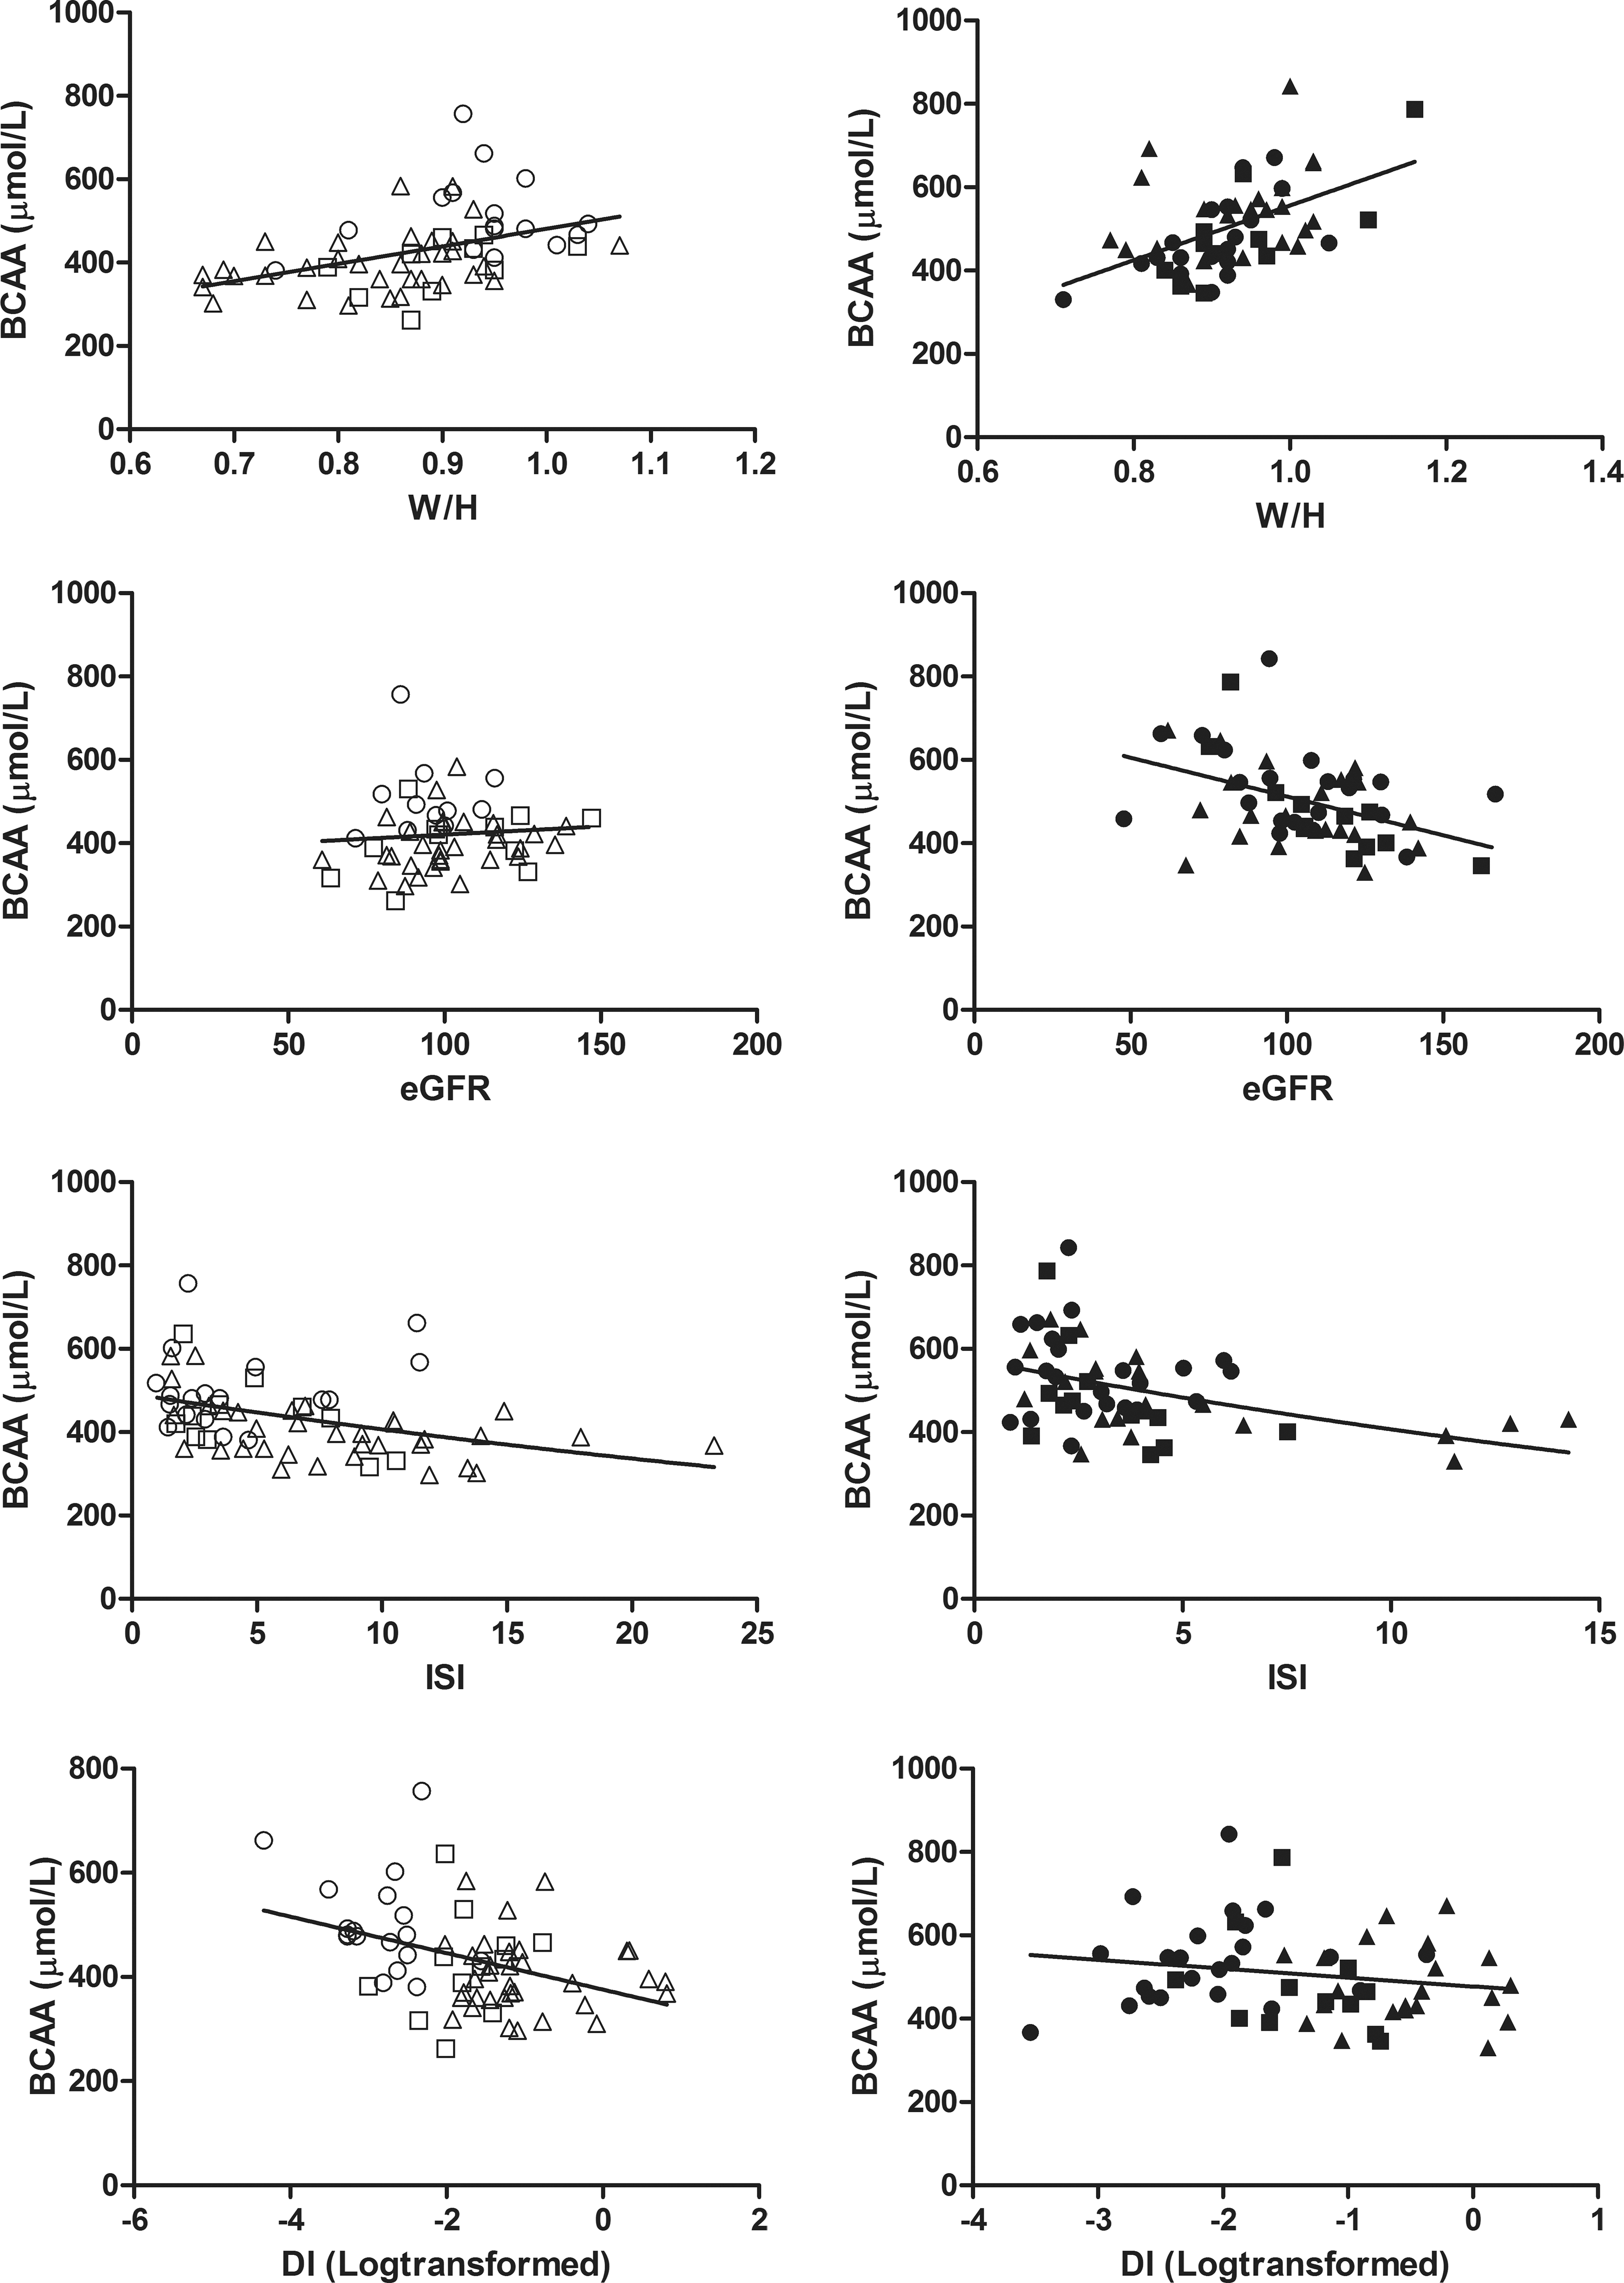
Relationships of branched-chain amino acids (BCAA) with waist/hip ratio (W/H), estimated Glomerular Filtration Rate (eGFR), insulin sensitivity index (ISI), and insulin disposition index (DI) in Caucasian (left, open circles) and Asian Indian (right, closed circles) families (triangles are normal individuals, squares are individuals with prediabetes, and circles individuals with T2DM, respectively). In Asian Indians, the relationship between BCAA and W/H (R 2 = 0.25; P < 0.001), eGFR (R 2 = 0.19; P = 0.001), and ISI (R 2 = 0.14; P < 0.001) was significant; the relationship between BCAA and DI (R 2 = 0.03; P = 0.18) was not significant. In Caucasians, the relationships between BCAA and W/H (R 2 = 0.18; P < 0.001), BCAA and ISI (R 2 = 0.14; P < 0.001), and BCAA and DI (R 2 = 0.16; P < 0.001) were significant; the relationship between BCAA and eGFR (R 2 = 0.007; P = 0.54) was not significant; WHR, waist-hip ratio.
In South Asians, WHR explained 32.5% and eGFR MDRD 9.5% of the variance in BCAA concentrations. ISI explained 3.8% in this model, although statistical significance was not reached (P = 0.073). DI did not contribute to the variance observed. In indigenous Dutch, WHR explained 15.4% of the variance in BCAA concentrations. DI may explain 5.5% in this model, however, this was not significant (P = 0.075). eGFR MDRD and ISI did not contribute to the differences observed.
WHR, waist–hip ratio.
Discriminative ability of amino acid profile for glucose intolerance
Before we tested the discriminative ability of BCAA between normoglycemia and prediabetes, we repeated our univariate analyses of BCAA with the earlier mentioned traits, but now restricted to the normoglycemic and prediabetic subgroups for both ethnicities. Even when we excluded their respective T2DM subgroups, our regression analyses remained significant (data not shown). The ability of the amino acid profile to discriminate between glucose-tolerant and glucose-intolerant family members was determined by the ROC curves (Table 3). The c-index of total BCAA was 0.83 in the Caucasians and 0.74 in the Asian Indians, which increased when combining BCAA levels with those of alanine, phenylalanine, and tyrosine to 0.84 and 0.79, respectively. The corresponding c-indices for fasting glucose were 0.91 and 0.85. When amino acid levels were combined with fasting glucose, the c-index increased to 0.92 and 0.97 (P = 0.04 vs. fasting glucose alone) for the Caucasian and Asian Indian family members, respectively (Fig. 3).

ROC curves for prediabetes among nondiabetic members of Caucasian (left) and Asian Indian (right) families with high T2DM risk. For both ethnicities, the ROC curve for fasting glucose alone (gray short dashed line) and fasting glucose+amino acids (BCAA, phenylalanine, tyrosine, and alanine, black continuous line), to discriminate between OGTT-defined prediabetic from normoglycemic condition, are depicted.
The c-index (ROC AUC) of BCAA, amino acids (BCAA, phenylalanine, tyrosine, and alanine), fasting glucose, and BCAA or amino acids as an add-on to fasting glucose, for prediabetes.
c-Index of fasting glucose+amino acids versus BCAA (P = 0.01), amino acids (P = 0.02), or fasting glucose (P = 0.04).
Discussion
We found that fasting BCAA, aromatic amino acids, and alanine levels were correlated with glucose intolerance and well discriminated between the prediabetic and the normoglycemic members of the Caucasian and fairly well for the Asian Indian families. However, in the Caucasian families, fasting glucose had high discriminative ability that was not improved by adding amino acid levels, whereas in the Asian Indian families, adding of amino acid levels to fasting glucose substantially improved the ability to discriminate normoglycemic from prediabetic family members in the Asian Indian families.
Prediabetes is defined by impaired fasting glucose and/or impaired glucose tolerance. We restricted the criteria for subgroups within the families to the OGTT measurements. Compared to prediabetic Caucasians, more Asian Indians had impaired glucose tolerance without impaired fasting glucose. This is the reason that an elevated level of plasma amino acids was a predictor of impaired glucose tolerance on top of the fasting glucose levels in Asian Indians but not in Caucasians. We also tested the discriminative ability of branched-chain alpha-keto acids, but we did not observe an improvement over BCAA (data not shown).
The Asian Indians living in the Netherlands have a high propensity to develop obesity and T2DM. They develop T2DM at an earlier age and at lower BMI than Caucasians. 8,9 In both ethnicities, ISI and adequate beta-cell function became less going from the normoglycemic through the prediabetic to the diabetic state, but ISI was not significantly different between the Asian Indian subgroups. In multivariate regression analysis, BCAA levels marginally associated with the ISI among Asian Indians and with the beta-cell function index among Caucasians. High BCAA levels are the result of impaired BCAA catabolism occurring in parallel with resistance to insulin, as has been observed during hyperinsulinemic euglycemic clamping of nonobese and T2DM subjects. 20
In line, metabolites related to BCAA catabolism associate with impaired fasting glucose and T2DM. 21 Moreover, insulin resistance decreases the hepatic expression of branched-chain alpha-keto acid dehydrogenase, the rate-limiting enzyme of BCAA catabolism. 22 Nonetheless, the causes for high BCAA levels may differ between ethnicities and an effect of beta-cell function has not been excluded.
We found that WHR was a stronger determinant of fasting plasma BCAA levels in our Asian Indians than in Caucasian subjects. A number of studies support a role of visceral fat in the BCAA catabolism: insulin resistant, obese sisters and brothers of monozygotic twins discordant for obesity had downregulated mitochondrial pathways for BCAA degradation in adipose tissue 23 ; expression of enzymes involved in BCAA catabolism in visceral fat was lower in obese women with than those without T2DM 24 ; and BCAA levels are reduced by bariatric surgery. 25,26 Visceral fat is clearly involved in the development of the metabolic syndrome among normoglycemic Asian Indians. 27 Moreover, large differences have been observed in distributions of fat tissue among Asian Indian neonates compared to other ethnic groups. 28 Intriguingly, our normoglycemic Asian Indians had fasting plasma BCAA and other amino acid levels that were already in the range of the Caucasian patients with T2DM. This may result from these differences in fat tissue distribution early in life.
Our work has a number of potential weaknesses: inherent to the used methodology of family screening, we studied relatively small groups. We did not assess prior food intake. However, fasting plasma BCAA originate predominantly from endogenous sources, 29,30 and diet does not influence fasting BCAA levels. 4,7 Screening of families with prevalent diabetes at our outpatient clinic resulted in selection on a high a priori chance of diabetes. In line, family ties increased the c-indices. However, we need to emphasize that our findings cannot be generalized to population-based screening approaches that are not based on family screening. Our findings are of interest to clinicians, who screen relatives of patients in high-risk families.
In conclusion, we found that BCAA levels increase with the degree of glucose intolerance in families at risk for T2DM of Caucasian descent, but not in Asian Indian families living in the Netherlands. However, when combined with fasting glucose, BCAA levels together with the other amino acids reliably discriminated normoglycemic from prediabetic family members in both ethnicities and significantly improved the discriminative ability of fasting glucose alone among the Asian Indian families. Amino acid profiles in fasting blood, particularly of BCAA, may be used as biomarkers to improve detection of the glucose-intolerant subject at risk for development of T2DM.
Statement of Human and Animal Rights
All procedures followed were in accordance with the ethical standards of the responsible committee on human experimentation (institutional and national) and with the Helsinki Declaration of 1975, as revised in 2008.
Statement of Informed Consent
Informed consent was obtained from all patients before being included in the study.
Footnotes
Acknowledgments
The authors thank Dr. Hovorka for providing them with the ISEC software. S.J. performed the patient experiments, determined and analyzed data, reviewed and edited the article, and contributed to the discussion. J.L.D.W. performed amino acid measurements, analyzed the data, and contributed to the discussion. T.R. performed glucose, insulin, and C-peptide measurements and contributed to the discussion. A.J.I., A.J.M.V., J.G.L., and E.J.G.S. reviewed and edited the article and contributed to the discussion. F.W.M.d.R and E.J.G.S. are the guarantors of this work, had full access to all the data in the study, and took responsibility for the integrity of the data and the accuracy of the data analysis. All individuals gave final approval for publication.
Author Disclosure Statement
No competing financial interests exist.