
Abstract
Aim:
Impaired insulin sensitivity and insulin secretion (ISEC) are major pathophysiologies of type 2 diabetes (T2DM). ISEC has two phases: the first and second phases (second ISEC). In this study, we derived equations to identify patients with second ISEC deficiency (ISEC-D).
Methods:
Data from 96 patients, namely 19 with a normal fasting plasma glucose (FPG) level, 21 with prediabetes, and 56 with T2DM, were enrolled. They underwent a modified low-dose graded glucose infusion test, which was originally proposed by Polonsky et al. The test results were interpreted as the slopes of the changes of plasma insulin against the glucose levels, which were considered second ISEC. Patients with the lowest quartile of the slopes were defined as having ISEC-D. We built three models: Model 0: FPG, Model 1: FPG + waist circumference, and Model 2: Model 1 + fasting plasma insulin. The area under the receiver operating characteristic (aROC) curve was used to determine the predictive power of these models.
Results:
Among the metabolic syndrome components, FPG had the largest aROC curve (78.2%). Although aROC curves of Models 1 and 2 (85.2% and 91.5%, respectively) were higher than the aROC curve of FPG, no difference was observed between Models 1 and 0. By contrast, the aROC curve of Model 2 was higher compared with Model 1.
Conclusions:
FPG showed the largest aROC curve. Model 2 had the highest predictive power, which could identify patients with ISEC-D with a sensitivity and specificity of 94.3% and 82.6%, respectively. These two models could be conveniently used in daily practice.
Introduction
I
Cerasi et al. first showed that by continually infusing glucose water, two phases of insulin secretion could be noted, namely the first phase (first ISEC) and second phase (second ISEC). 5 The first ISEC represents β-cell secretion within 10 min after a glucose challenge. This reflects the amount of insulin stored in β-cell granules. After the first ISEC, the second ISEC gradually rises and reaches a steady state within 2–3 hr. 5,6 This phase is considered to include the newly produced insulin from the β cells. Previous studies have shown that the first ISEC nearly completely disappears at the early stage of diabetes. 3,7 –9 By contrast, the second ISEC is preserved relatively well even years after diabetes onset. This fact indicates that the second ISEC is more crucial because it is essential for oral hypoglycemic drugs to be effective. Few studies have focused on the second ISEC, probably because measuring it is difficult. Consequently, its relevance is often overlooked.
Metabolic syndrome (MetS), the clustering of hyperglycemia, hypertension, obesity, and dyslipidemia, is known to be associated with higher risks of cardiovascular disease and diabetes. 10 Notably, the individual MetS components have also been found to be associated with β-cell function. 11 –15
The aforementioned information indicates that the second ISEC is crucial and is associated with MetS components. In this study, we used the modified low-dose graded glucose infusion test (M-LDGGI) to measure the second ISEC in patients with varying degrees of glucose tolerance. 7,16 Simultaneously, we attempted to develop a simple multivariable risk score model to identify patients with second ISEC deficiency (ISEC-D) with demographic data, MetS components, and fasting plasma insulin (FPI), which could be used in routine clinical practice. The associations between these factors and the second ISEC could also be further understood.
Materials and Methods
We enrolled 96 patients aged 40–70 years from our outpatient clinic, namely 16 with normal FPG (NFG), 28 with prediabetes (PreDM), and 52 with T2DM. Other than diabetes, they had no chronic medical diseases or history of diabetic ketoacidosis and had no changes in doses of oral hypoglycemic agents (OHA) during the study period. The patients with diabetes were on a stable dose of glibenclamide (average dose 2.1 ± 0.4 mg) and/or metformin (average dose 740 ± 80 mg) or both. They have been on the stable dose of OHA for at least 3 months before enrolled in the study.
Diabetes was diagnosed according to the criteria of the 2012 American Diabetes Association, with an FPG of ≥7 mmol/dL. 17 NFG and PreDM were defined as an FPG of <5.6 and 5.6–7.0 mmol/L, respectively.
The M-LDGGI test was originally proposed by Polonsky et al. Because it is time-consuming and complicated, we modified the original test to a shorter version. In unpublished data, the second ISEC derived from the original LDGGI test was highly correlated with that from the M-LDGGI test (r = 0.786, P = 0.000; data are shown in Supplementary Fig. S1; Supplementary Data are available online at
The homeostasis model assessment of insulin resistance (HOMA-IR) and β-cell function (HOMA-B) was calculated using Matthew equations. 18
The blood samples were immediately centrifuged and stored at −30°C for further analysis. Plasma insulin was measured using a commercial solid phase radioimmunoassay kit (Coat-A-Count insulin kit; Diagnostic Products Corporation). The intra- and interassay coefficients of variance for insulin were 3.3% and 2.5%, respectively. Plasma glucose was measured using a glucose oxidase method (YSI 203 glucose analyzer; Scientific Division, Yellow Spring Instrument Company, Inc.). Furthermore, serum total cholesterol, triglyceride (TG), and high-density lipoprotein cholesterol (HDL-C) were measured using the dry multilayer analytical slide method with the Fuju DR-Chem 3000 analyzer (Fuji Photo Film Corporation Minato-Ku). The hemoglobin A1c (HbA1c) level was evaluated through ion-exchange high-pressure liquid chromatography (Bio-Rad Variant II).
Statistical analyses
Data are shown as mean ± standard deviation. The independent t-test was used to compare the demographic data, clinical characteristics, and parameters of ISEC-N and ISEC-D, as well as the differences in plasma glucose and insulin levels at each time point between both groups. One-way analysis of variance was used to evaluate the same data between NFG, PreDM, and T2DM. The Bonferroni test was selected for post hoc examination. Because FPI, second ISEC, HOMA-IR, and HOMA-B showed the right skew, log transformation was performed for analysis.
We arbitrarily defined patients who had the lowest slope quartile of the slopes as ISEC-D (quartile 1). The other three-quarters of patients were considered to have ISEC-N (quartiles 2, 3, and 4; the control group).
All the possible related variables, such as age, sex, body mass index (BMI), waist circumference (WC), systolic blood pressure (SBP), diastolic blood pressure (DBP), TG, HDL-C, FPG, and log FPI, were first individually evaluated for their predictive performance for ISEC-D by using logistic regression analysis. The receiver operating characteristic (ROC) curve of each variable was then plotted by sensitivity (true-positive rate, y axis) against 1-specificity (false-positive rate, x axis). The area under the ROC (aROC) curve was calculated using the trapezoidal rule. A larger area typically corresponded to a more accurate prediction of that variable (model). 19
After the single logistic regression, factors with significant aROC curves were further entered into the multiple logistic regression model. They were considered the independent variables, whereas abnormal ISEC (1 for ISEC-D and 0 for ISEC-N) was considered the dependent variable. This analysis mainly aimed at adjusting the intercomponent effects between each factor and at simultaneously determining which factors remained significant. Finally, only FPG, WC, and FPI were identified. According to this finding, three binary logistic models were developed. The rationale for developing these models was to start from the FPG, which has the smallest aROC curve. In the order of the aROC curve, WC and FPI were added as follows.
Model 0: FPG
Model 1: FPG + WC (metabolic model)
Model 2: Model 1 + log FPI (complete model)
The model was selected using the enter method in the binary logistic regression analysis. The Hosmer–Lemeshow test was used to assess the goodness of fit of these models. The aROC curves of the two models were compared using the likelihood ratio test. Finally, we selected the optimal cutoff points, according to which the model sensitivity and specificity could be most accurately predicted. All statistical analyses were performed using the SPSS software system, Version 13.0 (SPSS, Inc.). P < 0.05 was considered statistically significant.
Results
The demographic data and other parameters (NFG, PreDM, and T2DM) of the patients were compared; the results are shown in Table 1. The data after patient grouping into ISEC-D and ISEC-N are shown in Table 2. The patients in the ISEC-D group had lower BMI, WC, second ISEC, HOMA-B, and FPI than the patients in the ISEC-N group. Meanwhile, the patients in the ISEC-D group had higher FPG and HbA1c levels and were more likely to have T2DM compared with the patients in the ISEC-N group. No statistically significant difference between the groups was observed in their age, sex, SBP, DBP, HOMA-IR, or lipid profiles. The mean plasma glucose and insulin levels at each time point during the M-LDGGI of the ISEC-D and ISEC-N groups are shown in Figure 1. During M-LDGGI, the patients with ISEC-D had higher plasma glucose and lower insulin concentrations than those with ISEC-N at each time point.
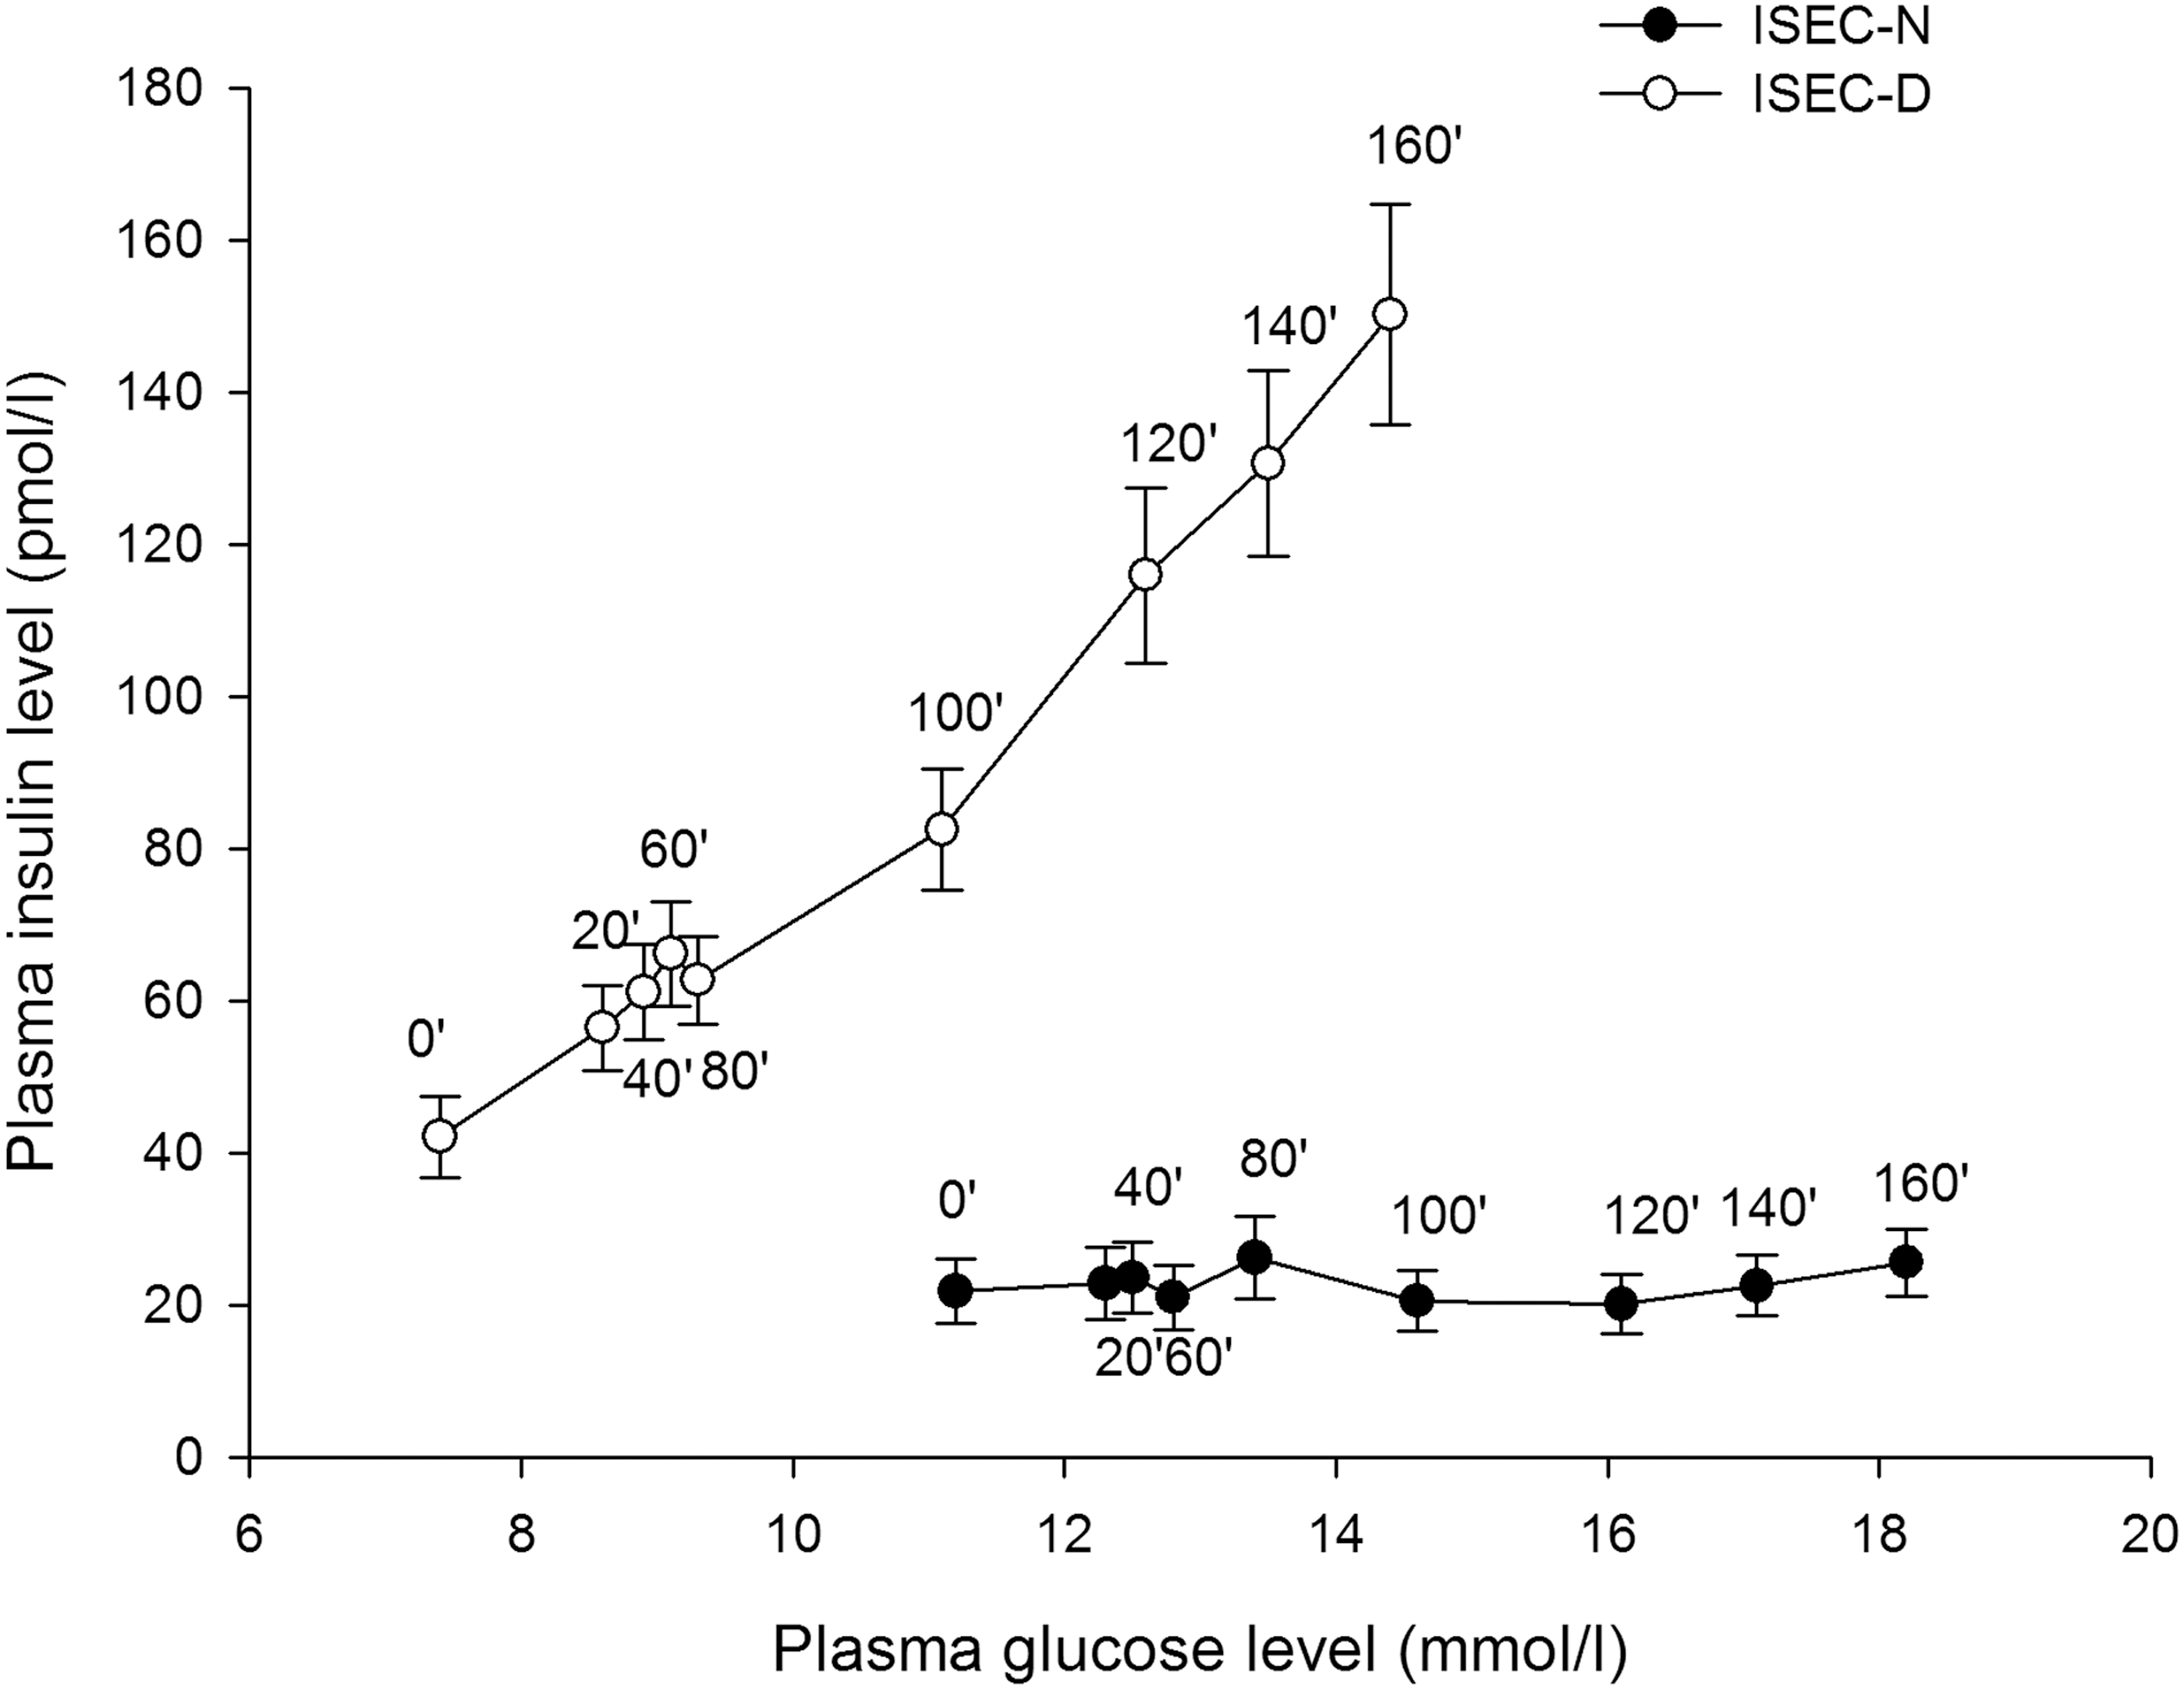
Plasma glucose and insulin concentration at each time point during modified low-dose graded glucose infusion test of the two groups.
The data are shown as mean ± standard deviation.
P < 0.05 against group 2.
P < 0.05 against group 3.
P < 0.05 against group 1.
FPI, fasting plasma insulin; HDL-C, high-density lipoprotein cholesterol; HOMA-IR and HOMA-B, homeostasis model assessment of insulin resistance and β-cell function, respectively; LDL-C, low-density lipoprotein cholesterol; NFG, normal fasting plasma glucose; second ISEC, second phase insulin secretion.
ISEC-D, second phase insulin secretion deficiency: defined by the lowest quartile of ISEC; ISEC-N, normal second phase insulin secretion: defined by the other higher quartile of ISEC.
The aROC curves of individual parameters and models, the results of their Hosmer–Lemeshow goodness-of-fit tests, and the statistical differences between models are shown in Tables 3 and 4. Among all clinical metabolic variables, FPG, WC, and log FPI had larger aROC curves than the diagonal reference line, indicating that the prediction of the second ISEC could be improved by these parameters but not by TG, SBP, DBP, or HDL-C. However, no significant difference was observed in the aROC curves of FPG (78.2%), WC (69.1%), or BMI (67.2%); the aROC curves of FPG and FPI were significantly different (67.7%).
Model 1: Fasting plasma glucose + waist circumference; Model 2: Model 1 + log FPI; ROC curve, receiver operating characteristic curve.
aROC, area under receiver operating characteristic curves; WC, waist circumference.
Model 0: fasting plasma glucose; Model 1: Fasting plasma glucose + WC; Model 2: Model 1 + log fasting plasma insulin.
After adding WC into Model 0, Model 1 did not show an improvement in predicting the second ISEC. Next, after entering log FPI into Model 1, Model 2 had significantly larger aROC curves (Tables 2 and 3), indicating that Model 2 has a more accurate predictive power than Model 1 (P = 0.023). The equation for Model 2 is P = 1/(1 − e−x ), where x = −5.629 + 0.110 × (WC) − 0.517 × (FPG) + 2.323 × (logFPI). In this equation, P refers to the risk of ISEC-D.
Finally, Figure 2 demonstrates the ROC curves of all models. The arrow indicates the arbitrarily selected risk cutoff point (0.58) of Model 2, which has a sensitivity and specificity of 94.3% and 82.6%, respectively.
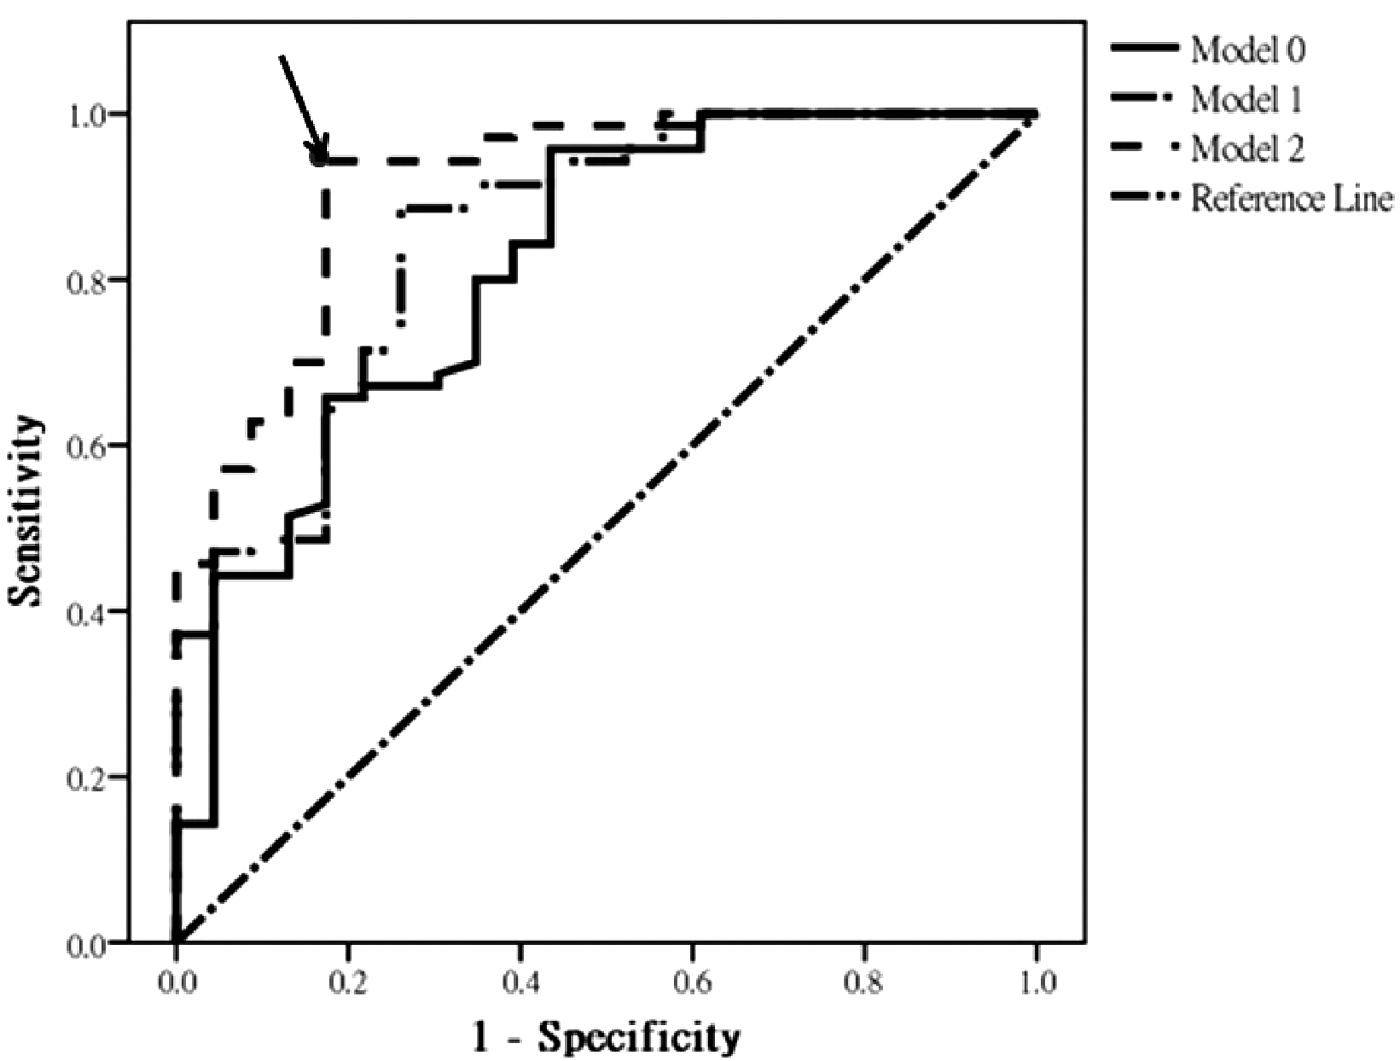
Area under the receiver operating characteristic curve of the models. The arrow indicates the arbitrarily selected risk cutoff point (0.58) of Model 2, which has a sensitivity and specificity of 94.3% and 82.6%, respectively. Model 0: fasting plasma glucose; Model 1: fasting plasma glucose + waist circumference; Model 2: Model 1 + log fasting plasma insulin.
Discussion
The relevance of the second ISEC is explained in the Introduction; specifically, it is the main factor determining for how long OHA, particularly insulin secretagogue, could maintain acceptable glucose control. In our study, by using only the MetS components, patients with ISEC-D were accurately identified with 80.6% sensitivity and 82.6% specificity. After adding FPI into analysis, patients with ISEC-D were identified with 94.3% sensitivity and 82.6% specificity. We consider that the equations provided in this study are easy to use and crucial in daily clinical practice.
Among the MetS components, only WC and FPG were found to be associated with the second ISEC. It is well established that obese people have higher ISEC. Park et al. reported that obese Korean patients with T2DM had higher C-peptide levels than their nonobese counterparts. 20 Our previous study revealed that young obese patients with T2DM had a more desirable first ISEC than nonobese patients. 21 Through immunocytochemistry, Kloppel et al. suggested that nondiabetic obese patients had a higher β-cell mass and, thus, higher ISEC. 22 This increased β-cell mass might be because of the compensatory reaction to the increased insulin resistance, which is associated with obesity itself. 23,24
Van Haeften et al. reported that the second ISEC could be predicted with a relatively poor accuracy in nondiabetic patients with a family history of T2DM, age, and BMI (r 2 = 0.185) 8 ; notably, no laboratory results were used in their study. By contrast, our study showed that age was not an estimator to distinguish ISEC-D from ISEC-N. Different ethnicity, inclusion criteria, and variables entered into the analysis in these two studies could explain the differences. To identify the role of age in determining the second ISEC, further evaluation with a larger population size and wider age ranges is required.
FPG had the largest aROC curve in this study; therefore, it was defined as a standard and basic model (Model 0). Because WC had the second largest aROC, it was added into Model 0 to form Model 1. Although the aROC increased from 78.2% to 85.2%, no improvement was observed in the predictive power. This unexpected finding could be explained by the following hypothesis. First, the second ISEC was separately correlated to FPG and obesity in simple correlation. However, the FPG was strongly affected by the degree of obesity. Therefore, in multiple regression analysis, the effect of FPG was attenuated by obesity, making the aROC nonsignificant. Second, in our study, the average BMI was ∼25.0 ± 3.0 kg/m2, which was in the range of overweight rather than obesity in a Chinese population. Not including obese patients in this study means that one extreme of the spectrum is excluded, thus reducing the statistical power. The effect of adiposity on the second ISEC could be clearer in a Chinese population by enrolling more obese patients. However, it should be emphasized that the BMI of Chinese patients with diabetes is typically lower compared with Caucasian patients. 25 Our data only reflect the true BMI of the general diabetic population.
FPI is not one of the MetS components and is not regularly examined in daily practice. However, the association between β-cell function and FPI level is widely investigated, and it has been well documented that a higher FPI level is associated with a more desirable first and second ISEC. 14,18,26 –28 In our study, although the aROC curve of FPI was smaller compared with WC (67.7% vs. 69.1%) after its addition into Model 1, it significantly improved the aROC from 85.2% to 91.5% (Models 1 and 2, respectively). This implies that obesity and FPI have different mechanisms for affecting the second ISEC. Previous studies have reported similar findings. For instance, Hanley et al. and Gower et al. had reported that FPI had a higher correlation with β-cell function than obesity in nondiabetic participants. 14,29 Simultaneously, Hansen et al. developed an equation to estimate first ISEC and independently included both BMI and FPI in the equation. 30 All of these findings support our results.
As per our review of relevant literature, our study is the first to develop a multivariable risk score model by using routinely measured and MetS components to identify failures in the second ISEC in Chinese patients with various degrees of glycemia. Although the predictive power of Model 1 was not high, after adding FPI, its aROC improved to 91.5%. Nevertheless, the study had several limitations. First, this was a cross-sectional study. Compared with a longitudinal study, our data are less reliable. Second, the family history of T2DM, which is established to be associated with β-cell dysfunction, was not assessed in the present study. 9 Third, the study cohort was relatively small, and the numbers of NFG were limited, which may have reduced the statistical power. Moreover, it would be interesting to individually construct models of various glucose tolerance groups. Additional studies with more patients and broader ranges of clinical metabolic variables are required to validate our model.
In conclusion, we revealed that among all the studied factors, FPG has the largest aROC. Model 2, developed with FPG, WC, and FPI, had an aROC curve of 91.5%, which could identify ISEC-D subjects with a sensitivity of 94.3% and specificity of 82.6%. Both the proposed models could be conveniently used in daily practice.
Footnotes
Acknowledgments
C.-H.H. analyzed the data. J.-D.L. drafted the article. C.-Z.W. and Y.-L.C. reviewed and edited the article. D.P. contributed to the discussion and edited the article. W.-C.L. and C.-H.H. analyzed the data and contributed to the discussion. The authors thank all the study patients.
Author Disclosure Statement
No competing financial interests exist.
References
Supplementary Material
Please find the following supplemental material available below.
For Open Access articles published under a Creative Commons License, all supplemental material carries the same license as the article it is associated with.
For non-Open Access articles published, all supplemental material carries a non-exclusive license, and permission requests for re-use of supplemental material or any part of supplemental material shall be sent directly to the copyright owner as specified in the copyright notice associated with the article.