
Abstract
Background:
The prevalence of obesity is increasing in young people in the United States. Lately, low-grade inflammation is recognized as accompanying obesity, a known risk factor for type 2 diabetes. Autonomic dysfunction is a prominent feature of adult diabetes, but its prevalence in adolescents in prediabetic states or with diabetes risk factors is unknown. We undertook to study obesity, inflammation, insulin resistance, and autonomic dysfunction together in a population of adolescents aged 13–18 years.
Methods:
Subjects gave a blood sample for cytokine analysis and a 5-min resting EKG for analysis of resting heart rate variability. TNF-α, IL-6, c-reactive protein (CRP), MCP-1, and IL-10 were analyzed by enzyme-linked immunosorbent assay, and Fourier Transform was applied to electrocardiographic recordings of R–R intervals for analysis in frequency space. The HOMA calculation was used as an index of insulin sensitivity.
Results:
TNF-α, IL-6, CRP, MCP-1, HOMA, and insulin levels, but not serum glucose or IL-10, were higher in the obese subjects. Low-frequency (0.04–0.15 Hz) and high-frequency (0.15–0.4 Hz) fluctuations of R–R intervals were lower in the obese subjects, but the normalized low-frequency power was not different, suggesting proportional reduction in variability in both ranges and impairment of both sympathetic and parasympathetic systems.
Conclusions:
Chronic low-grade inflammation, insulin resistance, and autonomic dysfunction are present at an early age in obese youths; early detection of inflammation may facilitate meaningful lifestyle changes in this high-risk group.
Introduction
T
Autonomic neuropathy is a common feature of both insulin-dependent and noninsulin-dependent diabetes. Small studies of symptomatic patients have shown that about 55% of diabetic patients with symptoms have demonstrable autonomic nervous system (ANS) dysfunction; the 5-year mortality rate in these series was 53% in those presenting with ANS dysfunction. 9,10 The point prevalence of ANS dysfunction in young patients, mean age at diagnosis 27 years, was reported to be 56%. 11 Studies in black patients have demonstrated reduced or absent heart rate variability (HRV) in 11% of patients. 12 The most sensitive and reliable indicator of ANS dysfunction is the measurement of second-to-second HRV at rest. 13 We used this technique to investigate the presence of autonomic dysfunction in young patients in prediabetic states or with risk factors for type 2 diabetes.
The importance of inflammation in childhood obesity and type 2 diabetes is less well established. Concentrations of TNF-α and soluble TNF-α receptors are higher in obese Japanese children than in nonobese Japanese children. 6 The concentration of soluble TNF-α receptors correlates positively with fasting plasma insulin and the homeostasis model assessment (HOMA) of insulin resistance. 14
The role of inflammatory cytokines in autonomic dysfunction needs further study; in particular, to our knowledge, the relationship of MCP-1 to autonomic dysfunction has not been investigated in obese adolescents. This study investigated whether obese children manifests early signs of abnormalities in the ANS as assessed by measurement of resting HRV, and whether the inflammatory processes characteristic of adult DM-2 is present in obese adolescents at this early age. We also undertook to determine whether inflammatory cytokines is related to autonomic dysfunction. Resting HRV was assessed using 12-lead electrocardiography, and TNF-α, IL-6, IL-10, MCP-1, and c-reactive protein (CRP) were measured in fasting blood of age-matched obese and lean adolescents.
Materials and Methods
This study was approved by the Institutional Review Board of the LSU Health Sciences System. All subjects had written informed parental consent and were accompanied by one parent for the study visit, and all subjects gave written assent before the procedures began. Recruitment and data collection took place between December 21, 2011 and March 1, 2014.
Subject characteristics
The subjects were adolescent boys and girls, 13–17 years old, inclusive, representative of an urban mostly indigent population. In the adult segment of this population, 52% are obese (mean body mass index [BMI] 31 kg/m2), 70% have hypertension, 32% have diabetes, 52% have the full metabolic syndrome, and 15% have coronary artery disease. 15
Inclusion and exclusion criteria
Subjects were eligible for inclusion if they met all these criteria: age at study entry ≥13 years and <18 years, overweight or obese subjects (OW/OB) weight ≥ 85th percentile for age, lean subjects weight <85th percentile for age, healthy (other than overweight status), not taking any medicines other than vitamins or antihistamines, at least one parent has given written informed consent, and child has given written assent. Subjects were rejected if they met any of the following criteria: pregnant or suspected to be pregnant, physician diagnosis of type 1 or type 2 diabetes mellitus, smoking or use of smokeless tobacco, any chronic illness or any inflammatory disease state, taking any medicine on prescription other than vitamins, using any recreational drug or substance, including more than occasional alcohol use, and taking any food supplement or health food known to have anti-inflammatory properties.
Data collection
After the parents or guardians had given written informed consent and the child had given written informed assent, urine was collected from the female subjects for urine pregnancy testing. Subjects were allowed to sit quietly for 10 min, after which time a 12-lead electrocardiogram was recorded for 5 min using a Nasiff CardioCard system and adhesive leads (Nasiff Associates, Inc.). A single 10-mL blood sample was obtained from an antecubital or easily accessible forearm vein using either a 21G Vacutainer® needle and tube or a 21G or smaller butterfly needle and Vacutainer® tube. The sample was allowed to clot and the separated serum was divided into suitable aliquots for analysis of each component of interest; aliquots were frozen immediately and stored at −80°C for future assay of cytokines.
Laboratory analyses
All chemical and data analyses were performed in our laboratories at LSU Health Sciences Center, Shreveport. Serum concentrations of glucose, insulin (Alpco Diagnostics), TNF-α (E Biosciences), IL-6, CRP® (D Systems), and IL-10 (Thermo Scientific) were measured for each sample by enzyme-linked immunosorbent assay (ELISA) using reagent kits supplied by the company. Absorbencies were measured with a plate reader and quantitated with standards provided by the manufacturer with the ELISA Kit. Insulin resistance was assessed by homeostasis model assessment (HOMA) calculation. 16
Analysis of heart rate variability
Techniques published by the Task Force of the European Society of Cardiology and North American Society of Pacing and Electrophysiology 13 were followed, and their terminology is used in this study. Components of the frequency-domain waveform were elucidated for each subject by means of a Rapid Fourier Transform, using the Spectra procedure of the Statistical Analysis System v. 8.3 (SAS Institute) to derive plots of amplitude versus frequency for each subject. The total variance within each range of low-frequency (LF, 0.04–0.15 Hz) and high-frequency (HF, 0.15–0.4 Hz) cycles was taken as the amplitude. Normalized LFPWR (LFNORM) was calculated as the fraction of the total variability due to LF.
Statistical analysis
Student's t-test was used to compare means of serum cytokines, glucose, insulin, HOMA, and EKG measurements between the two groups. If the variance of one group was more than an order of magnitude greater compared with the other, the method of unpooled variances was used. The correlation matrix of all variable measurements was used to identify possibly related pairs of variables for linear regression. Variables having an absolute value of Pearson's product moment greater than 0.25 were selected for linear regression analysis. Hypothesis testing was performed using SAS v. 8.3. Regression studies and figures in this article were performed using GraphPad Prism v. 6.07 (GraphPad Software, Inc.,
Results
Thirty-eight subjects were recruited and screened. One male subject was excluded because of an abnormal EKG, and he was referred to his family physician. One other male subject contributed blood, but an operator error prevented EKG recording for this subject. All other subjects completed the procedures (Table 1). One male subject and two female subjects experienced a vasovagal response to venipuncture and briefly felt faint. After sitting quietly for 5–10 min, this symptom resolved in all these subjects. This was not unexpected and there were no other adverse events.
Values are mean ± SD.
Mann–Whitney U-test.
BMI, body mass index; CRP, c-reactive protein; HRV, heart rate variability; SD, standard deviation.
EKG measurements
LFAMP and HFAMP were significantly lower in the OW/OB subjects (P = 0.0204 and 0.0060, respectively), but LFNORM was not significantly different (P > 0.05), suggesting proportional decreases in HFAMP and LFAMP (Table 1). HFAMP correlated negatively with IL-6 (P = 0.0373, r 2 = 0.1420; Fig. 1). A positive correlation between LFNORM and IL-6 was shown (P < 0.0472, r 2 = 0.1176; Fig. 1), but the difference between lean and OW/OB subjects was not statistically significant by t-test; this may be due to the large scatter in the observations. It is not necessary to show HFNORM, since there are only two frequency categories; HFNORM is therefore 1-LFNORM. No other inflammatory mediators correlated significantly with HRV.
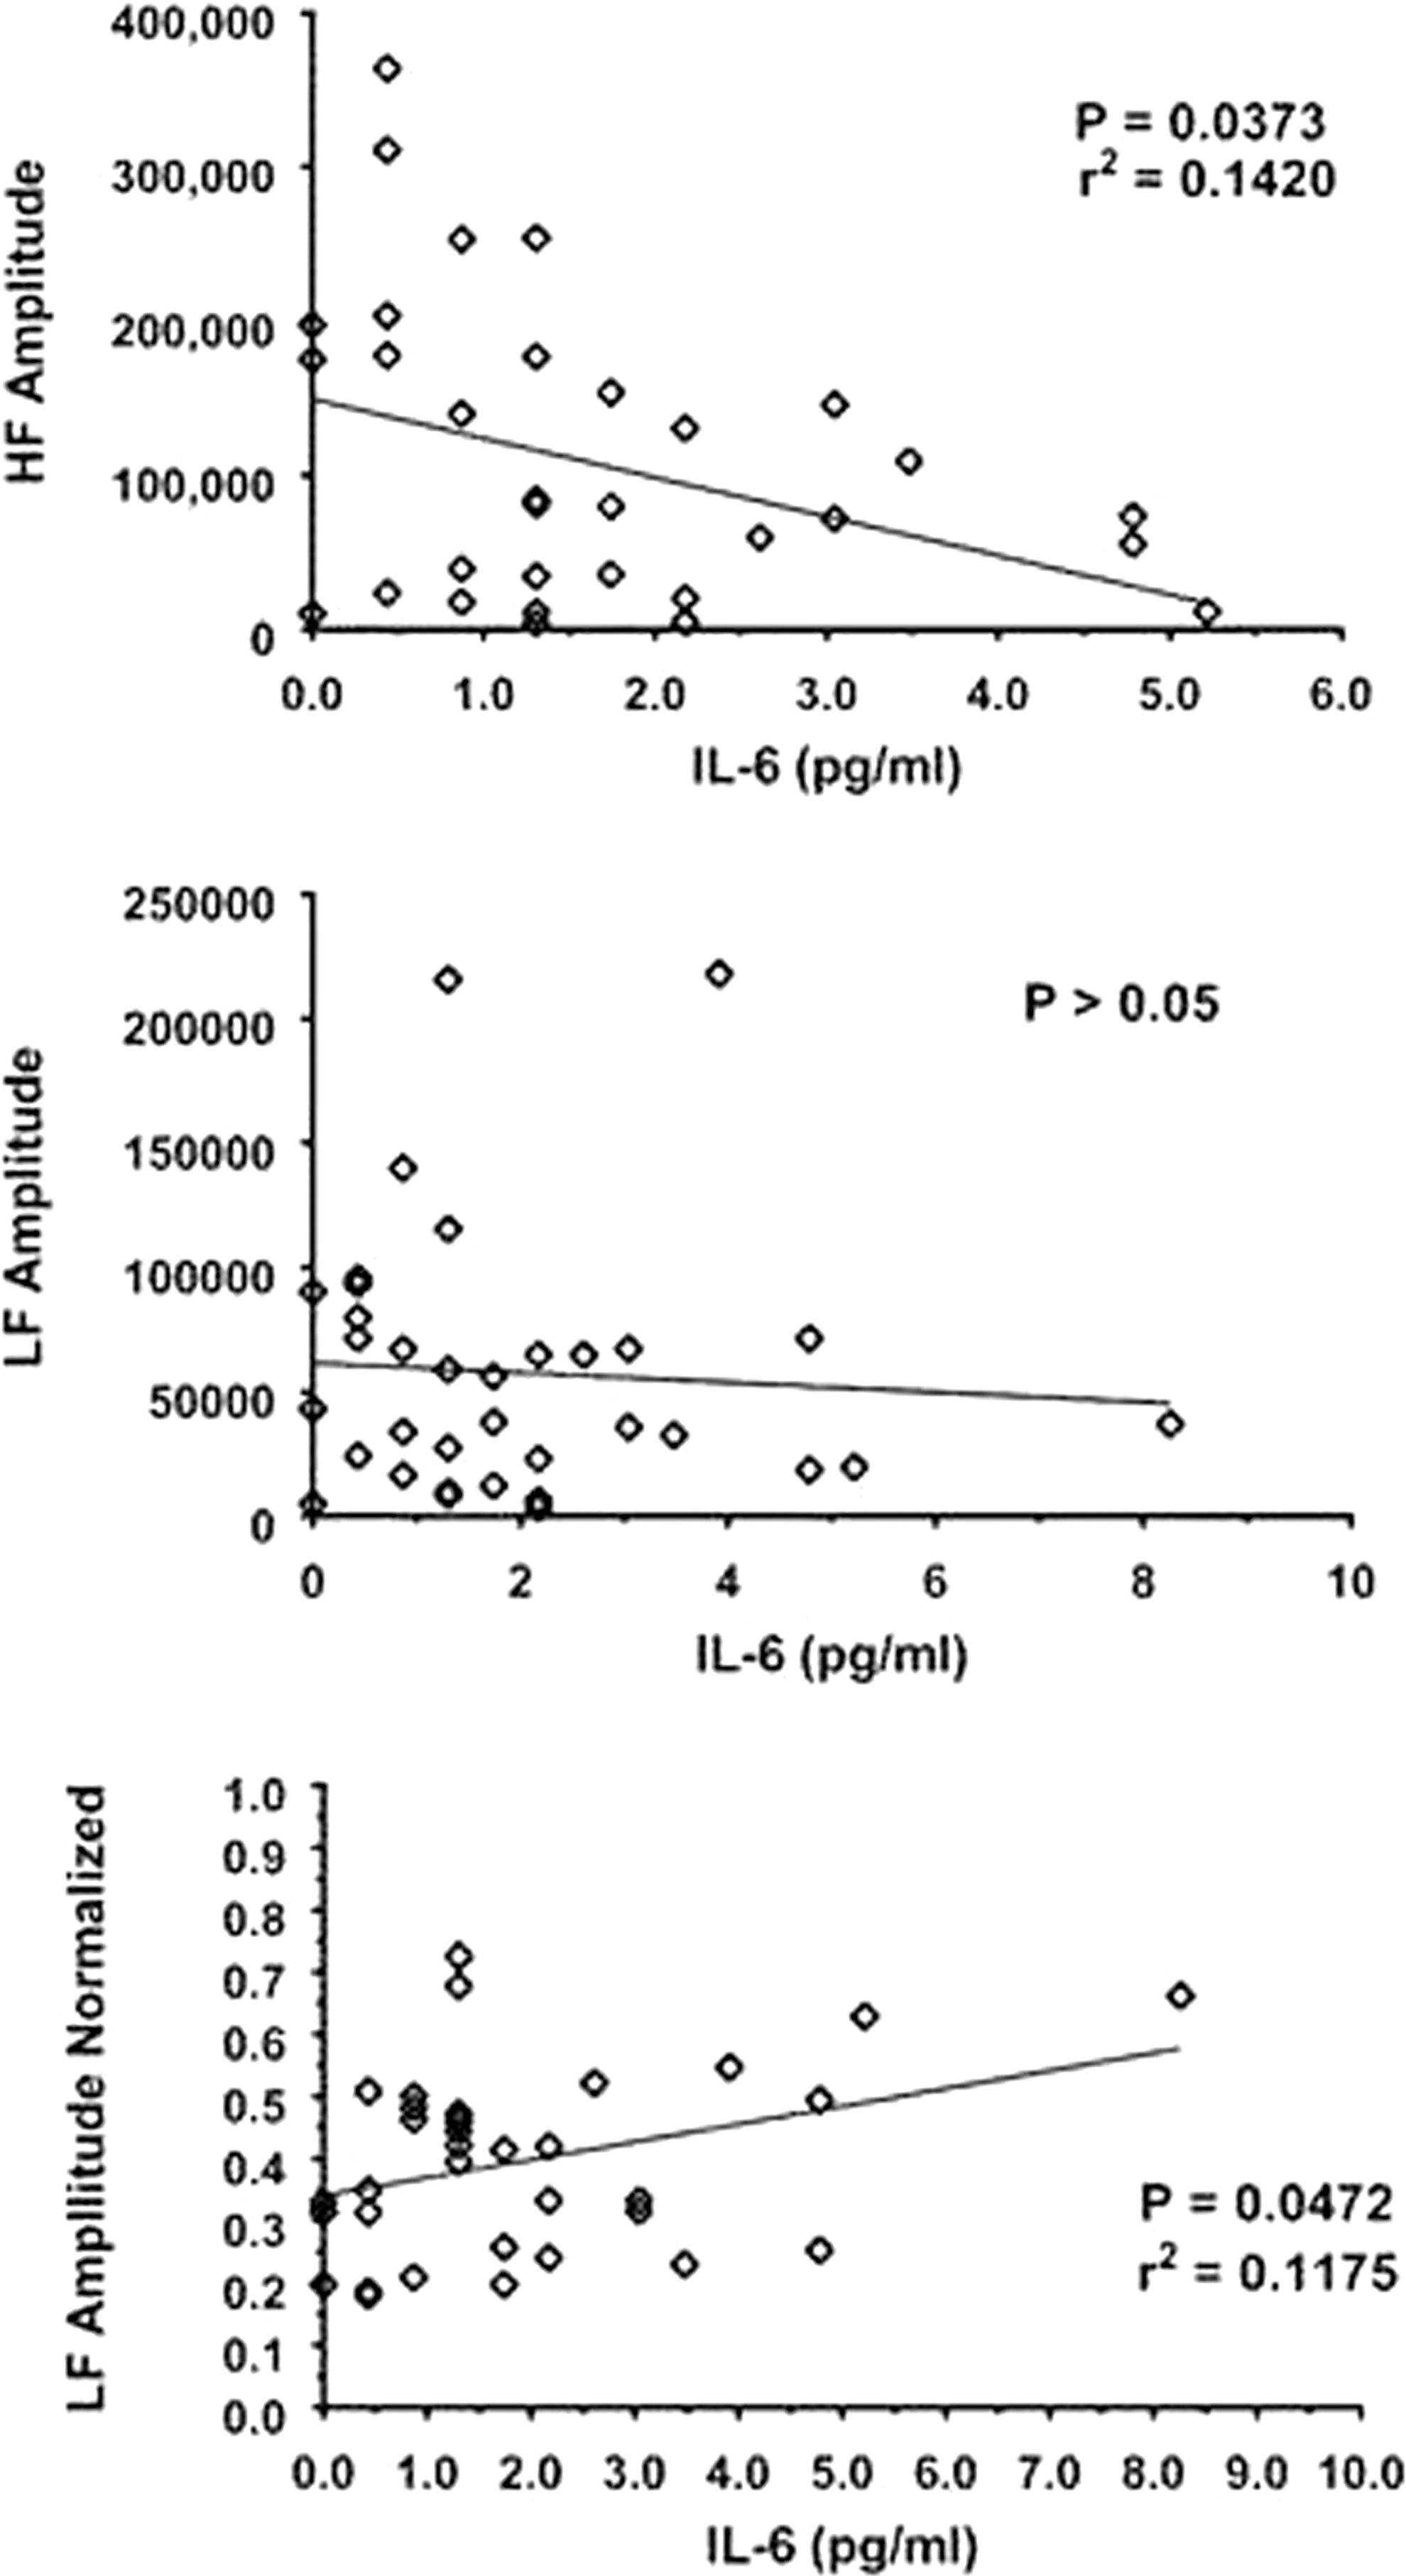
Indicators of resting heart rate variabilitiy related to IL-6. This cytokine (as independent variable) in particular is associated with signs of autonomic dysfunction in the adolescents studied. P values are for the null hypothesis H0: slope = 0.
Cytokines and insulin sensitivity
Serum concentrations of TNF-α, IL-6, MCP-1, and CRP were significantly higher in the OW/OB group (P = 0.0155, 0.0229, 0.0457, and 0.0003, respectively), but IL-10 was not significantly different between the groups (P > 0.05). These results are shown in the Table 1.
Insulin levels and HOMA were significantly higher in the OW/OB subjects (P < 0.0001 for both), with serum glucose not significantly different (Table 1). For variables selected by correlation coefficient, linear regression was performed with the null hypothesis H0: slope = 0. MCP-1, CRP, IL-6, and TNF-α increased smoothly and significantly with BMI (Fig. 2). Increasing HOMA (Fig. 3) was accompanied by significantly increasing IL-6, CRP, and MCP-1.

Body mass index and inflammatory mediators. Larger body mass index (as independent variable) is associated with evidence of low-grade inflammation in adolescents. P values are for the null hypothesis H0: slope = 0.

HOMA and inflammatory mediators. HOMA is associated with the inflammatory mediators studied (taken as independent variables). P values are for the null hypothesis H0: slope = 0.
Discussion
Heart rate variability and autonomic function
Although TNF-α is strongly associated with skeletal muscle insulin resistance, 18 it was not significantly correlated with HRV in this study, suggesting that HRV is affected, in part, by TNF-α-induced increases in IL-6, but not by TNF-α directly. The influence of the ANS on the sinus node is generally appreciated, with vagal (parasympathetic) tone predominating at rest and sympathetic tone and rapid modulation becoming dominant with exercise or stress. Many fluctuations, influenced by afferent vagal tone, central respiratory and vasomotor centers, and sympathetic–parasympathetic interaction, add to the total fluctuations in resting R–R intervals. Fourier analysis elucidates the underlying components.
It is well established that the HF component reflects efferent vagal activity; these fluctuations are rapid because vagal stimulation is mediated by the release of acetylcholine, which is rapidly hydrolyzed. 13 There is less agreement on the meaning of the LF fluctuations. Evidence supports an interpretation of LF activity as a measure of sympathetic modulation. 19 Other work 20 suggests that LF activity reflects both sympathetic and parasympathetic activity, especially when considered in normalized units.
Elevations of serum concentrations of both TNF-α and IL-6 are associated with reduced HRV in patients with chronic heart failure. 21 –23 Whether these cytokines are causative factors or merely markers is not known, but one study demonstrated that TNF reduces myocardial contractility in patients with heart failure through disturbances of intracellular calcium homeostasis, 24 suggesting a causative relationship for altered myocardial function, at least in heart failure.
Autonomic function and obesity
In normalized units (LFNORM), LF was not different between the two weight groups (P > 0.05). However, linear regression demonstrated a positive correlation between IL-6 and LFNORM and a negative correlation of IL-6 and HFAMP. Positive correlation of BMI and IL-6 was also found. This suggests that obesity, IL-6, and HRV are related, although whether in a complex cause–effect relationship or as markers of other influences cannot be determined from statistical analyses. Regression analysis did not demonstrate a relationship of TNF-α to HRV.
Both LF and HF components were significantly lower in the OW/OB subjects than in the non-OW/OB subjects (P = 0.0204 and 0.0060, respectively), indicating a reduction in total HRV in the OW/OB subjects. This is consistent with the findings of other studies. 25 –27 Interestingly, LFNORM increased weakly with increasing IL-6, but not enough to be significantly different between OW/OB and lean subjects (Fig. 1). Taken together, these findings suggest that, as in adult patients with diabetes, adolescents in prediabetic states may be experiencing autonomic dysfunction affecting both limbs of the ANS.
Markers of inflammation and insulin resistance
Serum concentrations of TNF-α, IL-6, MCP-1, and CRP are greater in our OW/OB subjects than in our lean subjects, as are insulin levels and HOMA, and all correlate positively with BMI (Fig. 2). Increased secretion of IL-6 is known to be a response to increased TNF-α levels, 28 and both TNF-α and IL-6 have been shown to be present in higher concentrations in children with diabetes or risk factors for diabetes. 5,14,29,30 Gupta et al. 14 studied the relationship of inflammatory mediators to obesity and insulin resistance in six nonobese and 21 obese children. One of the obese children was found to have diabetes and four others had impaired glucose tolerance. The obese children had significantly higher serum concentrations of soluble TNF-receptors than the nonobese children. The child with diabetes and the obese child with impaired glucose tolerance had significantly higher concentrations of soluble TNF receptors than the other obese children or the lean children.
TNF-α is secreted by adipocytes 28 and causes insulin resistance in skeletal muscle by altering insulin signal transduction. 31 Serum concentrations of TNF-α and its soluble receptors were shown to be significantly higher in obese Japanese children compared with those in nonobese children; higher TNF-a concentrations were associated with several components of the metabolic syndrome. 6 Fröhlich et al. report moderate correlations of CRP with BMI, glucose, and uric acid (Spearman's r = 0.32, 0.11, and 0.14, respectively, P < 0.0001 for all) in a group of 796 men and 956 women aged 18–89 years 32 ; however, fewer than 5% of these patients were younger than 21 years. The importance of inflammation in DM-2 is underscored by a case–cohort study spanning 9 years and including 10,275 patients 33 ; significantly elevated hazard ratios for DM-2 were found for patients in the fourth quartile versus the first quartile of IL-6 and the acute-phase reactants sialic acid and CRP; after adjusting for BMI, waist–hip ratio, fasting glucose, and fasting insulin, the IL-6 association was significant for Caucasian nonsmokers, but not for smokers or black patients. 33 This study compared interquartile values, so the statistical power was not optimized.
Markers of inflammation and diabetic morbidity
Glowenska et al. 5 compared levels of IL-6 and TNF in healthy children and those with atherosclerosis risk factors (obesity, hypertension, and diabetes). Obese children had significantly higher levels of IL-6 and TNF-α than the healthy nonobese controls; the highest concentrations were found in the obese children. TNFα and CRP have been shown to be associated with the risk of chronic kidney disease in patients with DM-2. 34 MCP-1 is implicated in the pathogenesis of diabetic nephropathy through monocyte infiltration; increased glucose concentration stimulates the release of MCP-1 35 and IL-6 36 in human mesangial cells, promoting the formation of crescentic glomerular injury. Pavkov et al. compared the incidence of diabetic end-stage renal disease and mortality in middle-aged Pima Indians with maturity-onset DM-2 to those with youth-onset DM-2 and found that DM-2 diagnosed at age <20 years contributed strongly to increased mortality and end-stage renal disease in middle age. 7 Although in our subjects, glucose concentrations were not different in the OW/OB and lean groups, insulin resistance and impaired plasma clearance of glucose by skeletal muscle may make increased amounts of glucose available to the kidney.
MCP-1 is known also to be involved with atherosclerotic changes in human and nonhuman primates. Elevated MCP-1 concentrations are associated with peripheral vascular disease, and MCP-1 has been shown to be an independent risk factor in coronary artery disease. 37 These findings strongly suggest that the inflammatory changes characteristic of adult type 2 diabetes are present in adolescent persons with obesity and are accompanied by impaired HRV. We have shown that increased serum concentrations of inflammatory markers, accompanied by evidence of ANS dysfunction and insulin resistance, are present in children aged 13–18, in agreement with most clinical studies. While this is not of itself a revelation, few studies have included children from a high-risk largely indigent population at risk for type 2 diabetes as a result of overweight or obesity, and fewer have explored the relationships between inflammation and autonomic function.
These subjects represent a group of people with obese parents and friends, eating an unhealthy regional diet of fried and fatty foods, who may benefit from early identification of this risk and interventions to reduce BMI through lifestyle changes. Weight loss has been associated with reduced serum concentrations of inflammatory cytokines and improvement in insulin sensitivity. 38 Although not routine screening tests, measurement of IL-6, TNFα, CRP, MCP-1, and perhaps other markers may enable early detection of diabetes risks and early intervention. It is possible that not all overweight children are at high risk for diabetes.
Our study has several weaknesses, particularly its small sample size. Recruitment was open and subjects actively sought for more than 2 years; the lack of willingness of children to participate in medical activities is understandable and may be grounded in educational levels and community attitudes toward research in charity hospitals. Some of the regression studies show statistically significant, but weak correlations (low r 2 values); this suggests that the factors studied may be relatively minor participants in a larger and more complex system of immune response control. More study is needed.
Evaluation of HRV, presently a research tool of undetermined clinical utility, reliably assesses ANS function with 5-min recordings 13 and is easily performed with bedside EKG testing. In the course of early studies, we found manual measurement of R–R intervals imprecise; electrocardiographs that generate a list of all R–R intervals provide data that can subsequently be interpreted using spectral analysis. This may be particularly important for young patients; clinical studies have shown that the 5-year survival rate may be as high as 50% once clinical signs of ANS neuropathy emerge. 10 Since overt neuropathy may coincide with the diagnosis of diabetes, early detection offers promise for reducing morbidity and mortality.
Footnotes
Acknowledgments
The authors are supported by the Tom and Mayme Scott Endowed Chair for Clinical Pharmacy Research (University of Louisiana at Monroe) and by grants from NIH R01 AT007442 and the Malcolm Feist Endowed Chair in Diabetes (LSU Health Sciences Center, Shreveport). The authors thank Ms. Georgia Morgan for her review of this article and Ms. Tammie Stapleton, R.N., for her diligent work in data collection.
Author Disclosure Statement
No competing financial interests exist.