
Abstract
Objective:
To compare the metabolic status and pancreatic β-cell function in first-degree relatives (FDRs) of type 2 diabetic patients with normal glucose tolerance (NGT).
Materials and Methods:
Three hundred twelve subjects, who were NGT-FDR of type 2 diabetic patients and 1348 subjects, who were NGT individuals with no family history of diabetes, were defined as NGT-FDRs and NGT-controls (NGT-C), respectively. Blood pressure, body weight, waist circumference, plasma glucose, lipid profile, and insulin levels were measured in all subjects. Homeostasis model assessment of insulin resistance (HOMA-IR), HOMA-β, insulin sensitivity index (ISI), and disposition index (DI) was used to evaluate insulin resistance and insulin sensitivity.
Results:
The HOMA-IR and HOMA-β indices were significantly higher in the NGT-FDR group relative to the NGT-C, while the ISI, DI, and ΔI30/ΔG30 were lower (P < 0.05). The prevalence rate of greater than or equal to three metabolic disorders was higher in the NGT-FDR group compared to the NGT-C (P < 0.05). In the NGT-FDR group, compared to people with normal metabolism, HOMA-β decreased when there was only one metabolic disorder, increased slightly when there were two to three metabolic abnormalities, and decreased again when there were four or more metabolic abnormalities. The data also indicated that having a family history of type 2 diabetes maybe an independent risk factor of β-cell dysfunction.
Conclusions:
Metabolic disorders developed frequently in the NGT-FDRs of type 2 diabetic patients. As the number of coexisting metabolic disorders increased, pancreatic β-cell secretory ability and insulin sensitivity decreased. Therefore, it is necessary to provide early preventive interventions and monitoring of metabolic indices for NGT-FDRs of type 2 diabetic patients.
Introduction
T
Metabolic syndrome (MS) comprises metabolic abnormalities that include central (intra-abdominal) obesity, dyslipidemia, hyperglycemia, and hypertension, all of which are important risk factors of type 2 diabetes. The prevalence of individuals with MS has steadily increased over the past two decades and the heritability of MS has also been reported. 12 –14 However, the nature of the association between insulin secretory function and these metabolic abnormalities in NGT-first-degree relatives (FDRs) of type 2 diabetes patients has not been clearly documented.
In the present study, we compared metabolic abnormalities and pancreatic β-cell function between a population of NGT-FDRs of type 2 diabetic individuals and an NGT population without type 2 diabetic relatives. We also studied the diversity of insulin resistance and islet β-cell function among individuals of different abnormal metabolic status.
Materials and Methods
Study designs
Subjects
This is a cross-sectional study. The subjects (comprising people living in areas of Chengdu and Xichang in Sichuan province, age ≥18 years old) were recruited from the 2007 nationwide diabetes and MS epidemiological investigation conducted by the China National Diabetes and Metabolic Disorders Study Group. In total, 2309 subjects were investigated, including 559 FDRs of type 2 diabetic patients and 1750 individuals with no family history of diabetes. All subjects provided their written informed consent. The Ethics Committee from West China Hospital approved the protocol.
Data on each subject's family history of diabetes were collected using a questionnaire written by the authors and administered by an interviewer. A positive family history was defined as having at least one diabetic FDR. The oral glucose tolerance test (OGTT) was used to confirm NGT status in accordance with the World Health Organization. 15 Of the potential 559 FDRs of type 2 diabetic patients, 312 (55.81%) were verified as NGT and constituted the NGT-FDR group of the present study (130 men, 182 women, mean age 38.89 ± 14.39 years). Similarly, of the original 1750 individuals with no family history of diabetes, 1348 (77.03%; 463 men, 885 women, mean age 41.99 ± 14.24 years), were defined as the NGT-control (NGT-C) group.
Diagnostic criteria of MS
The diagnostic criteria for MS were based on the definition set by the International Diabetes Federation (IDF) 16 as follows: central obesity concomitant with at least two of the following signs: (1) serum triglycerides (TG) ≥150 mg/dL (≥1.7 mmol/L) or under specific treatment for elevated TG; (2) high-density lipoprotein cholesterol (HDL-C) <40 mg/dL (<1.03 mmol/L) in men and <50 mg/dL (<1.29 mmol/L) in women or under treatment for lipid abnormality; (3) arterial hypertension (systolic blood pressure ≥130 mmHg or diastolic blood pressure ≥85 mmHg), or under treatment; and (4) diagnosed type 2 diabetes or fasting plasma glucose ≥100 mg/dL (≥5.6 mmol/L).
In our study, we also enrolled the normal glucose-tolerant people (fasting glucose <6.0), so the higher fasting glucose as a component of MS in the article means >5.6 and <6.0 mmol/L.
Measurements
Questionnaire and physical examinations
Detailed histories (including smoking, alcohol drinking, and family history) were recorded for all subjects in the questionnaire for this study. Trained staff measured physical parameters such as height, weight, waist circumference (WC), hip circumference, and blood pressure.
Blood analysis
A 75 grams OGTT was administered to all subjects after 8–12 hrs of fasting. Blood was collected at fasting status, and 30 and 120 min after glucose loading. Plasma glucose, lipids [total cholesterol (TC), TG, HDL-C, low-density lipoprotein cholesterol (LDL-C)], and serum insulin were measured in accordance with standard laboratory procedures. Serum insulin (Beckman insulin kit, Prague, Czech Republic) and plasma glucose (Linco GL-32K kit, Anaheim, CA) were measured by radioactive immunoassay. The enzymic method was used to measure plasma lipids.
Assessment of insulin resistance and β-cell function
The homeostasis model assessment of insulin resistance (HOMA-IR) was applied for the evaluation of insulin resistance, where HOMA-IR = (fasting plasma glucose, mmol/L) × (fasting plasma insulin, mU/L)/22.5). 17 Two indices were utilized for the composite evaluation of pancreatic β-cell secretory function, namely the HOMA for β-cell function (HOMA-β), 18 where HOMA-β = 20 × fasting insulin/(fasting plasma glucose – 3.5), and the ratio of incremental insulin to glucose responses over the first 30 min during the OGTT, ΔI30/ΔG30. 19
We applied the glucose disposition index (DI) principle proposed by Bergman et al. 19 –21 to demonstrate that glucose homeostasis was maintained by pancreatic β cells, where DI = HOMA-β/HOMA-IR. The insulin sensitivity index (ISI) was used for estimating insulin sensitivity, where ISI = 1/(fasting blood glucose × fasting insulin). 22
Statistical analyses
The source data were unscrambled with EpiDATA3.0 and Excel. Data are expressed as mean ± standard deviation. Non-normal distribution data (insulin, HOMA-IR, HOMA-β, DI, ISI, and ΔI30/ΔG30) were transformed into normal distribution data with natural logarithms and then analyzed. Variance–covariance analysis was used for comparison of data between the two groups. The chi-squared test and multinomial logistic regression were used for the comparison of numerated data. Multiple linear regression was used to determine risk factors. All P values are two tailed, and P < 0.05 was considered statistically significant. All the statistical analyses mentioned above were completed with SPSS version 11.0 for Windows software.
Results
Comparison of clinical biochemical indicators
The mean age and sex of the two groups were comparable (Table 1). The following parameters were found to be significantly higher in the NGT-FDR group than in the NGT-C: WC, systolic pressure, fasting plasma glucose and insulin, 2-hr plasma glucose and insulin, TC, LDL-C, uric acid (UA), HOMA-IR, and HOMA-β. Similarly, in the NGT-FDR group, the mean ISI, DI, and ΔI30/ΔG30 were significantly lower in the NGT-FDR group compared with the NGT-C (P < 0.05, each).
Compared with NGT-control, P < 0.05.
ΔI30/ΔG30, the ratio of incremental insulin to glucose responses over the first 30 min during the OGTT; DBP, diastolic blood pressure; DI, disposition index; FDR, first-degree relative; FPG, fasting plasma glucose; HDL-C, high-density lipoprotein cholesterol; HOMA-IR, homeostasis model assessment of insulin resistance; ISI, insulin sensitivity index; LDL-C, low-density lipoprotein cholesterol; NGT, normal glucose tolerance; NGT-C, NGT-control; OGTT, oral glucose tolerance test; SBP, systolic blood pressure; TC, total cholesterol; TG, triglyceride; UA, uric acid.
Prevalence of MS in NGT-FDR and NGT-C groups
We did not find significant differences between the experimental groups in terms of the prevalence of subjects with three or less complicating metabolic abnormalities (Table 2). However, the NGT-FDR group had a remarkably higher proportion of individuals with greater than or equal to three complicating metabolic abnormalities than the NGT-C. The risk of MS in the NGT-FDR group was 1.737-fold that of the NGT-C group (Table 3).
Compared with NGT-C, P < 0.05.
MS, metabolic syndrome.
95% CI, 95% confidence interval; OR, odds ratio.
The impact of metabolic disorders on HOMA-IR, HOMA-β, DI, ISI, and ΔI30/ΔG30
The HOMA-IR value increased gradually in both experimental groups and correlated with the metabolic abnormalities of MS, but the increase in range was much higher in the NGT-FDR (Fig. 1). In the NGT-FDR group, those with only one metabolic disorder had a decreased HOMA-β compared to those with normal metabolism. In those with two or three metabolic abnormalities, the mean HOMA-β increased slightly. When there were greater than or equal to four metabolic abnormalities, the mean HOMA-β decreased again. However, in the NGT-C groups, there was no clear change in the HOMA-β as the number of metabolic abnormalities increased (Fig. 2).

Effect of metabolic abnormalities on HOMA-IR. Correlated with metabolic abnormalities, the HOMA-IR value increased gradually in both experimental groups, but the increase in range was much higher in the NGT-FDR compared to NGT-C (P < 0.05). FDR, first-degree relative; HOMA-IR, homeostasis model assessment of insulin resistance; NGT, normal glucose tolerance; NGT-C, NGT-control.
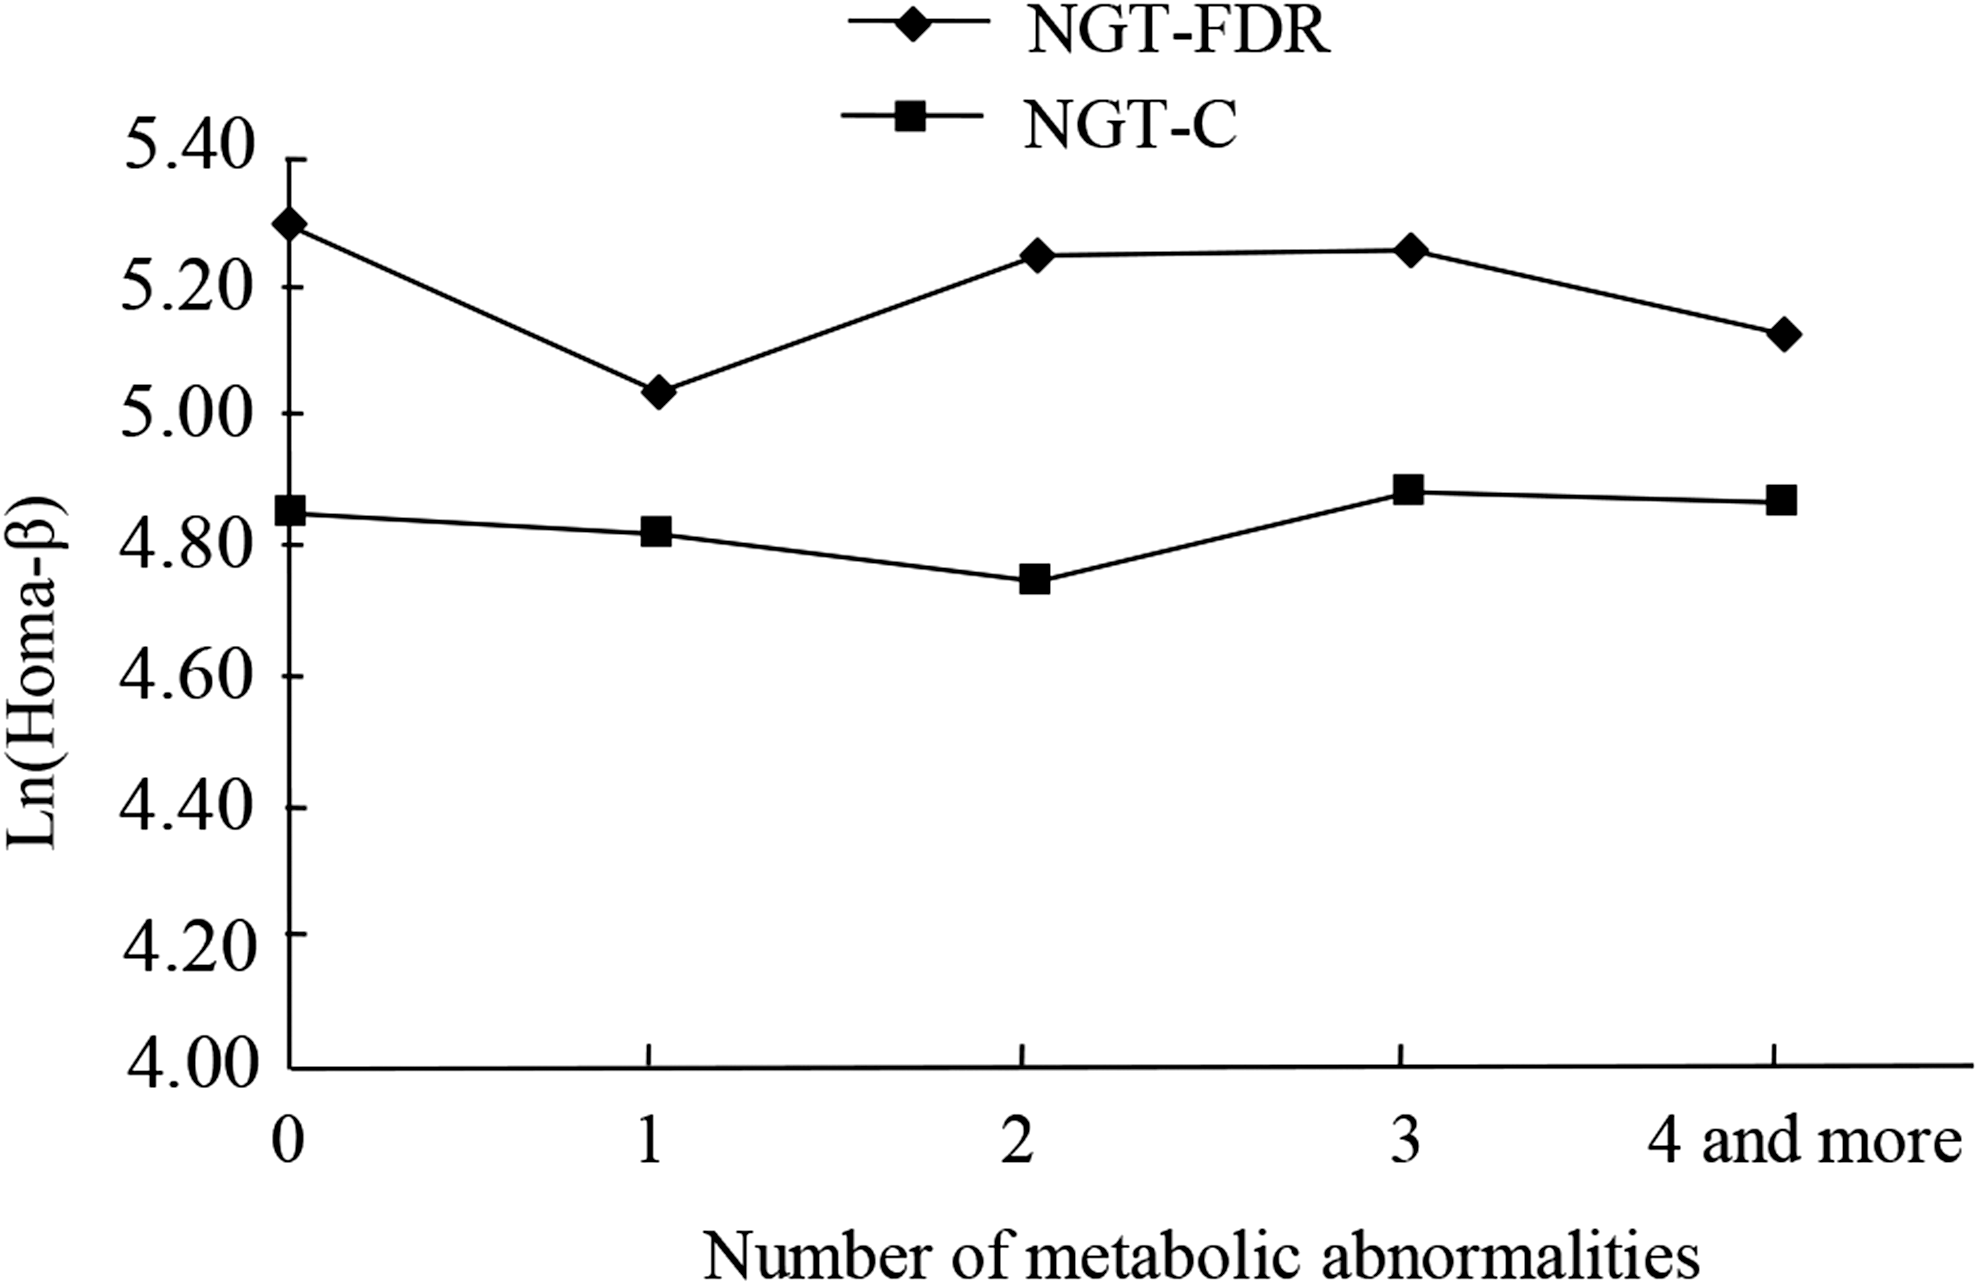
Effect of metabolic abnormalities on HOMA-β. In the NGT-FDR group, those with only one metabolic disorder had a decreased HOMA-β compared with those with normal metabolism (P < 0.05). In those with two or three metabolic abnormalities, the mean HOMA-β increased slightly. When there were greater than or equal to four metabolic abnormalities, the mean HOMA-β decreased again (P < 0.05). However, in the NGT-C groups, there was no clear change in the HOMA-β as the number of dysbolisms increased (P > 0.05).
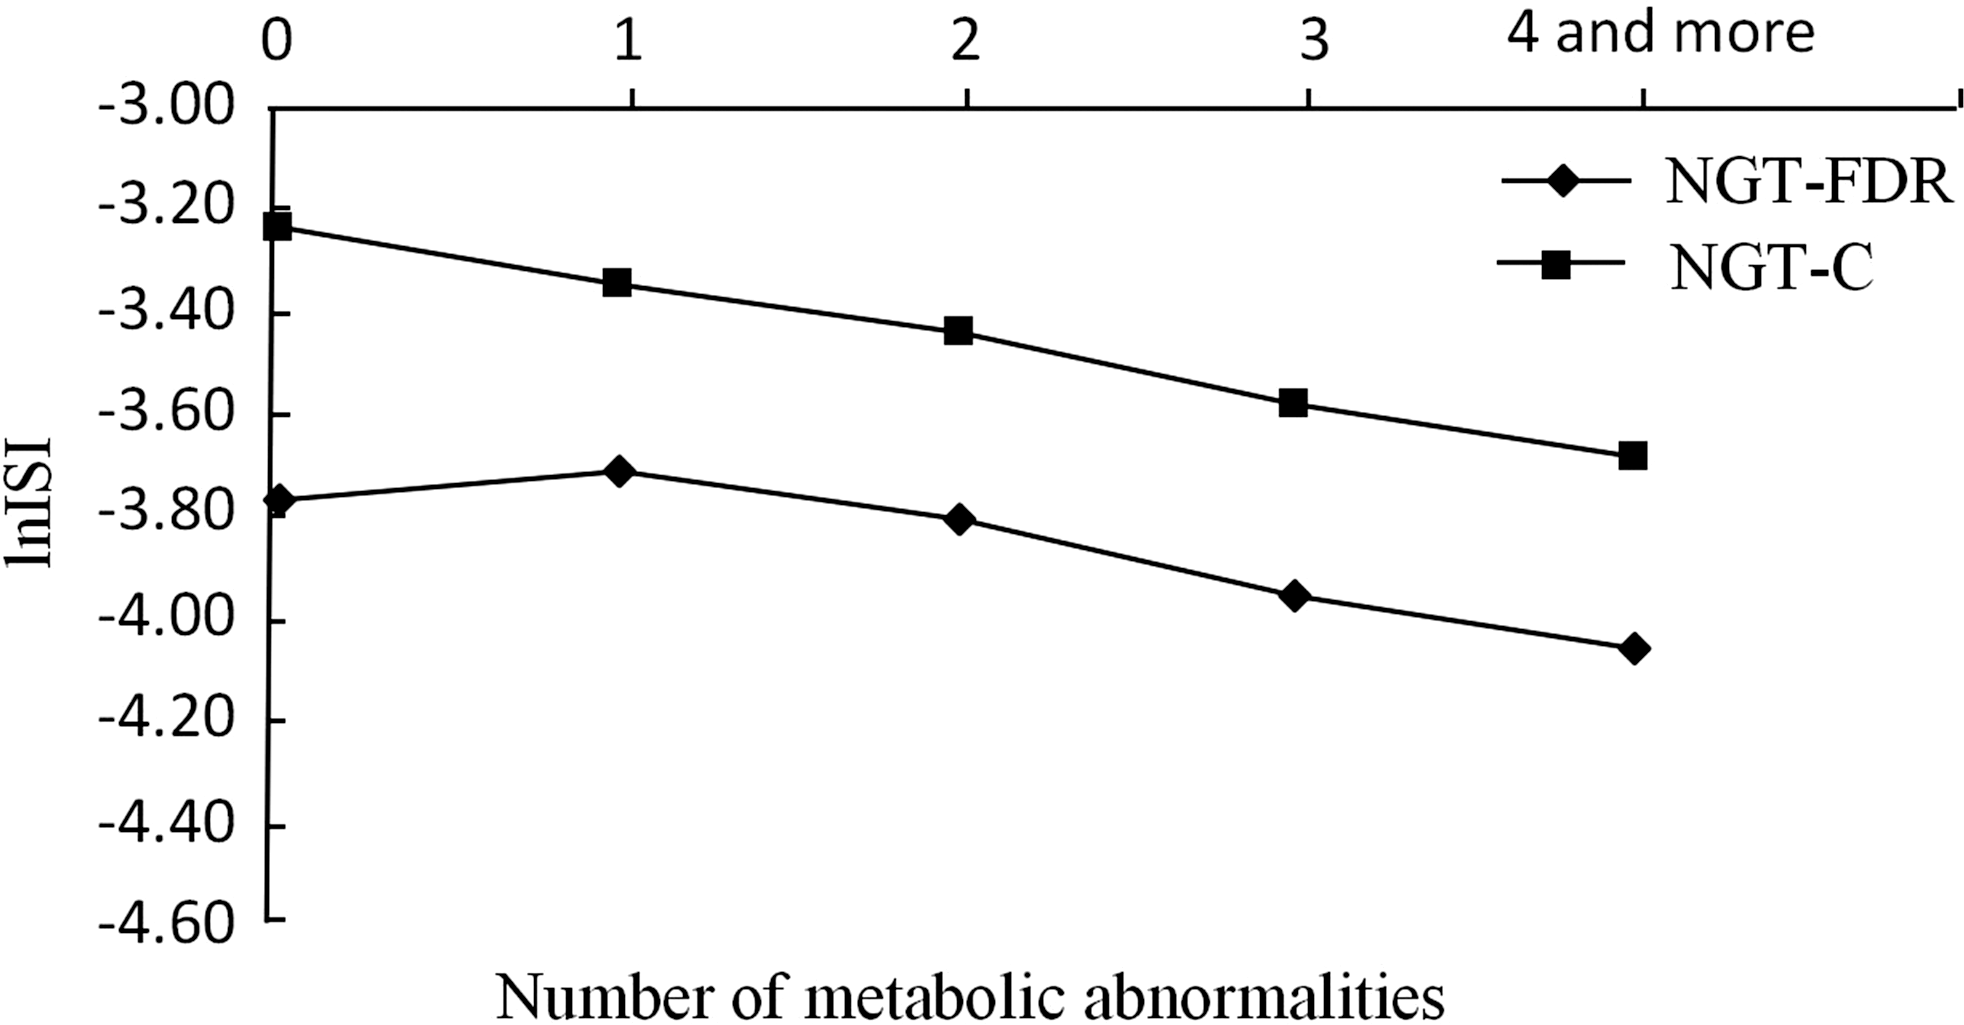
As the number of metabolic abnormalities increased, a downward trend in the ISI value in the NGT-FDR group was more obvious than in the NGT-C (Fig. 3). There was no significant difference between the experimental groups in DI value for those with three or less metabolic abnormalities. However, when the number of coexisting metabolic abnormalities increased to four or more, the mean DI decreased. (Fig. 4). In the NGT-C group, ΔI30/ΔG30 was positively associated with the number of coexisting metabolic disorders, but the ΔI30/ΔG30 value in the NGT-FDR group did not change significantly (Fig. 5).
Effect of metabolic abnormalities on ISI. As the number of metabolic abnormalities increased, a downward trend in the ISI value in the NGT-FDR group was more obvious than in the NGT-C (P < 0.05). ISI, insulin sensitivity index.
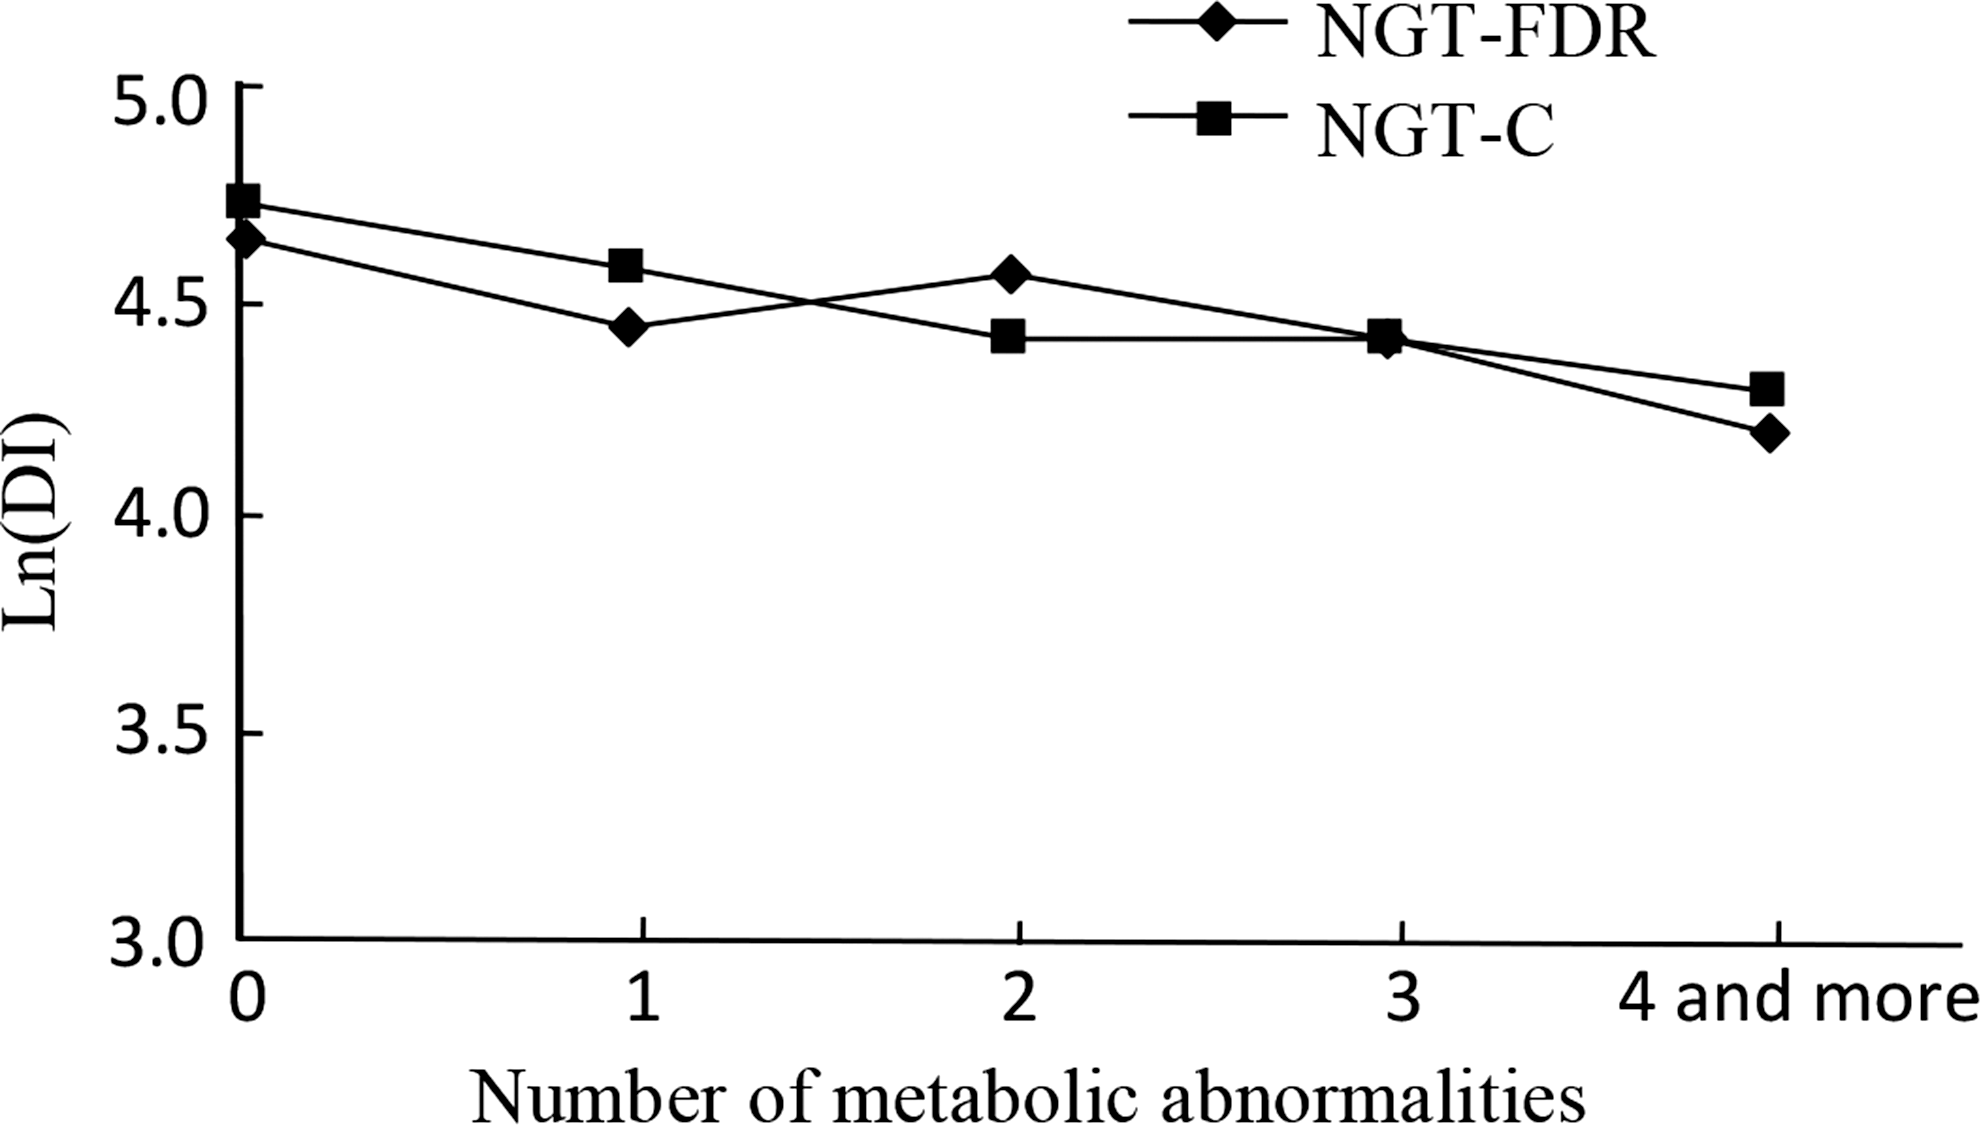
Effect of metabolic abnormalities on DI. There was no significant difference between the experimental groups in DI value for those with three or less metabolic abnormalities (P > 0.05). However, when the number of coexisting metabolic abnormalities increased to four or more, the mean DI decreased (P < 0.05). DI, disposition index.
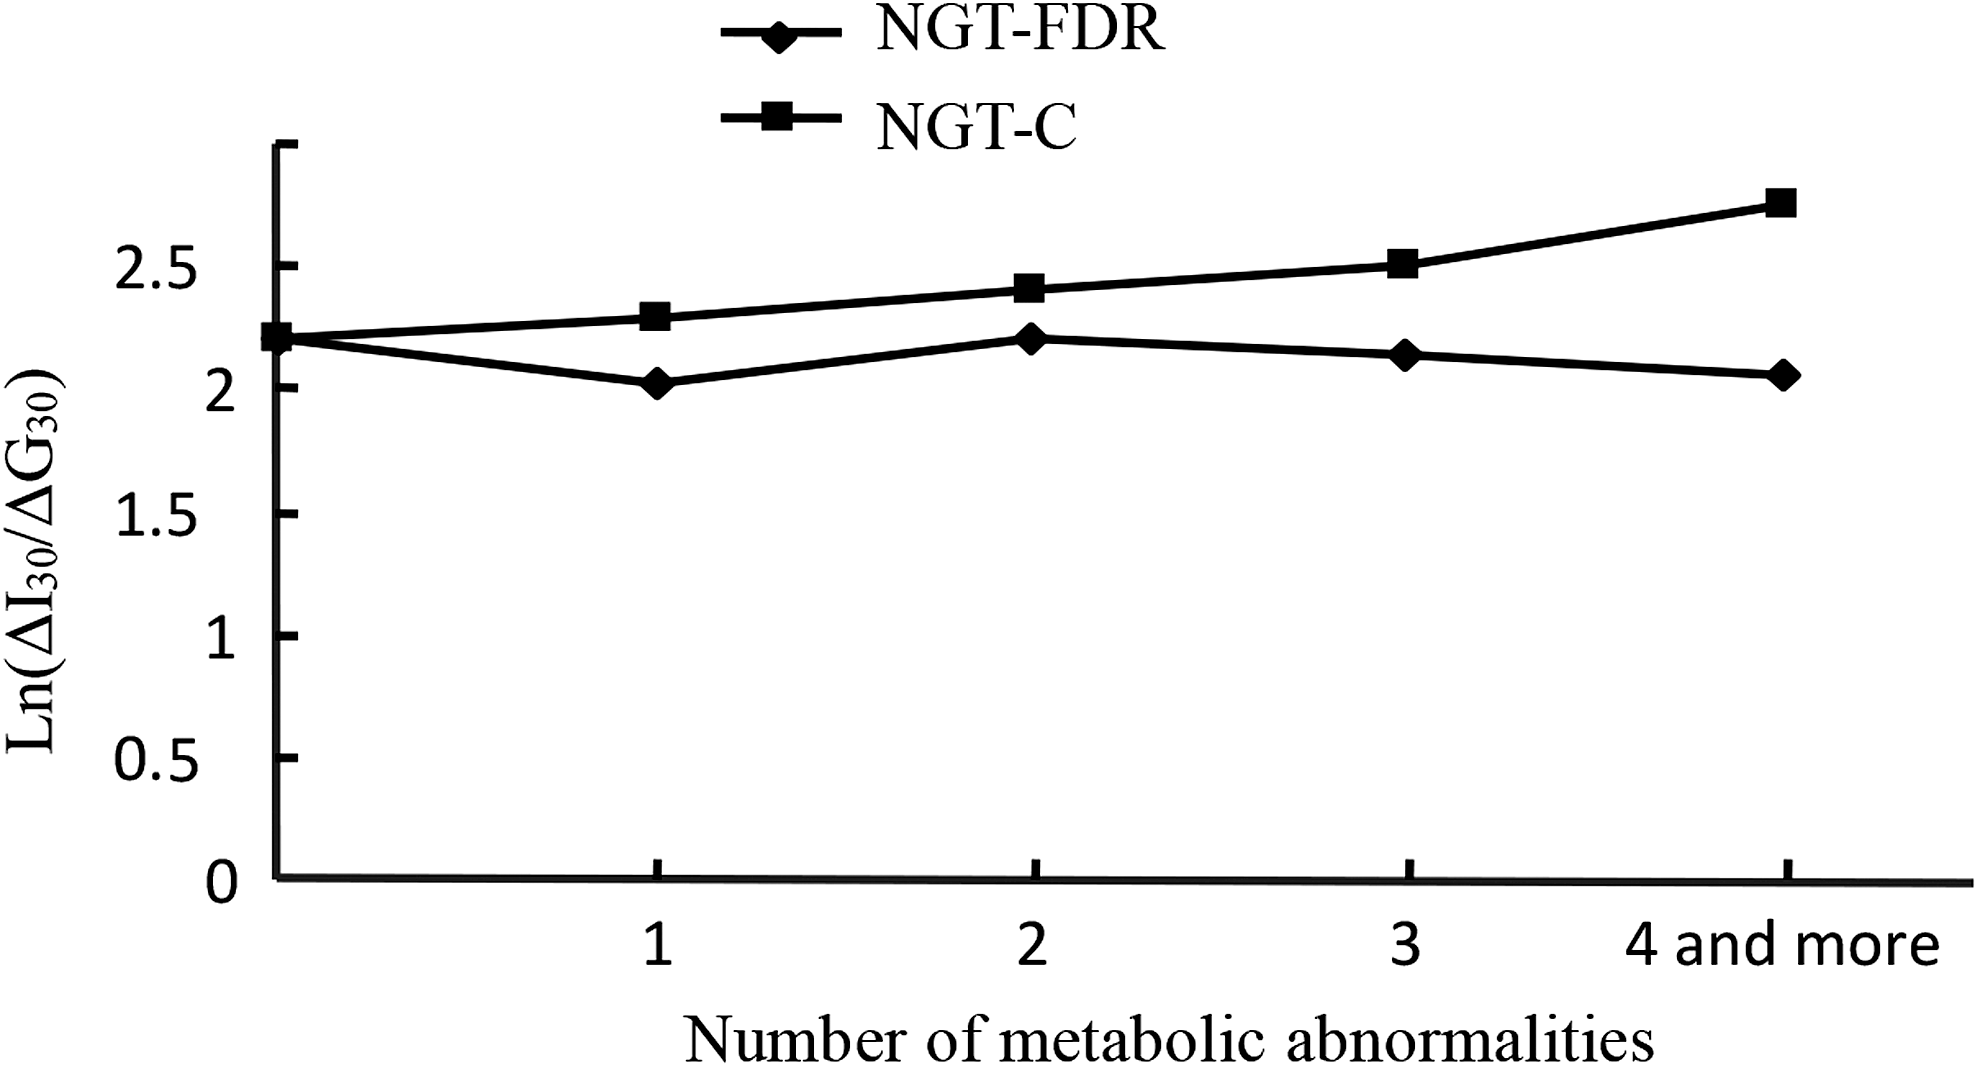
Effect of metabolic abnormalities on ΔI30/ΔG30. In the NGT-C group, ΔI30/ΔG30 was positively associated with the number of coexisting metabolic disorders, but the ΔI30/ΔG30 value in the NGT-FDR group did not change significantly (P > 0.05).
Risk factors for disorders in pancreatic islet β-cell function
Risk factors of high HOMA-IR included BMI, systolic pressure, TG, and family history of T2DM. The risk factors related to high HOMA-β were age, BMI, waist, TG, and family history of type 2 diabetes. The risk factors related to low ISI included BMI, systolic pressure, TG, and family history of T2DM. The risk factors related to low DI included age and waist measurement. The risk factors related to low ΔI30/ΔG30 were gender, BMI, UA, and HDL-C (Table 4).
BMI, body mass index; SE, standard error.
Discussions
Previous studies have reported that NGT-FDRs of type 2 diabetic patients have higher insulin resistance and islet β-cell dysfunction than NGT individuals whose relatives are without T2DM. 5,23 Consistent with this, our result showed that in the NGT-FDR group, the HOMA-IR and HOMA-β indices were significantly higher, and ISI, DI, and ΔI30/ΔG30 were lower, than that in the NGT-C group. These results suggested that in the NGT-FDR group, there was compensatory pancreatic β-cell hypersecretion.
Many studies have indicated that the prevalence of MS is higher in the FDRs of patients with T2DM than the respective control group. 24,25 In particular, 90% of overweight Hispanic children who have a positive family history have at least one MS feature. Furthermore, 30% of these subjects had MS. 26 In our study, we found that NGT-FDRs of T2DM patients were prone to more metabolic disorders than the NGT-C group: 13.0% of the NGT-FDR group had MS, while only 9.6% of the NGT-C group had MS. The risk of MS in the NGT-FDR group was 1.737-fold that of the NGT-C group. Therefore, we hypothesize that the prevalence of MS is higher in NGT-FDRs of T2DM patients. A similar result was reported for NGT Brazilian adolescents with a family history of T2DM. 27
Several prospective studies have shown that β-cell dysfunction is the determinative factor for glucose tolerance abnormality in American Indians and postmenopausal women. 28 –30 However, whether β-cell function changes with metabolism in NGT-FDRs of T2DM patients is unknown. In our study, we found that β-cell sensitivity was lower and insulin resistance was higher in the NGT-FDR group. In the NGT-FDR group, when there was only one metabolic disorder; HOMA-β was significantly lower relative to that of the NGT-C group. This suggests that a genetic type 2 diabetic background may reduce the person's ability to defend against a metabolic disorder, resulting in injured β cells. However, we cannot explain why the function of β cells increased in subjects with two or three metabolic disorders, although we may assume this may be due to compensatory activities of β cells. If the metabolic disorder cannot be overcome, the function of β cells finally cannot compensate.
Similar to our data, a previous study showed that the acute-phase serum insulin response was significantly attenuated in individuals with insulin resistance who were relatives of patients with T2DM. 23 We also found that early-phase insulin secretion increased with the number of coexisting metabolic disorders in the NGT-C group. However, this was not observed in the NGT-FDR group. Thus, the β cells of NGT-FDRs of type 2 diabetic patients have lost their ability to compensate during the early phase of insulin secretion.
Our results also indicated that a family history of T2DM was associated with high HOMA-IR, high HOMA-β, and low ISI in people whose glucose tolerance is normal. Therefore, we assume that a family history of T2DM may be an independent risk factor of insulin resistance and β-cell dysfunction. In addition, BMI and TG are also apparent risk factors of insulin resistance and β-cell dysfunction in NGT people.
Several limitations existed in this study. First, the numbers of subjects in the NGT-FDR group are much smaller than those in the control group, which may weaken the statistical power of the results to some extent. Second, this was a cross-sectional study, and therefore, the causation between metabolic disorders and pancreatic islet β-cell function cannot be clearly established.
In summary, our study shows that although glucose tolerance may be normal, FDRs of people with T2DM were more prone to obesity, insulin resistance, and MS, with an increased number of coexisting metabolic disorders, β-cell dysfunction, and insulin resistance. To improve the insulin sensitivity and β-cell function of NGT-FDRs of T2DM patients, it is necessary to regularly monitor metabolic indices.
Footnotes
Acknowledgment
The China National Diabetes and Metabolic Disorders Study Group supported this work.
Authors' Contributions
L.D. and S.L. performed research, analyzed data, and contributed to the discussion and writing of the manuscript. Y.G. performed research, analyzed data, and contributed to the discussion. H.T., Y.L., J.S., and X.R. contributed to the discussion and edition of the manuscript. H.Y., X.Z., and Y.L. performed research. Y.R. designed research, analyzed data, contributed to the discussion, and edited the manuscript. Y.R. is the guarantor of this work and, as such, had full access to all the data in the study and takes responsibility for the integrity of the data and the accuracy of the data analysis.
Author Disclosure Statement
No conflicting financial interests exist.