
Abstract
Background:
Abdominal obesity and presence of the metabolic syndrome (MetS) are associated with cardiac abnormalities. Among those, left ventricular diastolic dysfunction (LVDD) is the most frequently encountered in clinical practice. Few studies evaluated the reversibility of LVDD by an approach promoting lifestyle modifications in abdominally obese subjects with MetS.
Methods:
We assessed the impact of a 1-year lifestyle modification program combining nutritional and physical activity counseling on LVDD and metabolic profile of abdominally obese men with MetS. Echocardiograms, oral glucose tolerance test, lipids profile, dual energy X-ray absorptiometry, computed tomography scans (visceral obesity assessment), heart rate variability (HRV), as well as maximal and submaximal exercise tests were performed in participants before and after a 1-year program combining healthy eating and a physical activity/exercise program.
Results:
Fifty-one abdominally obese men participated in this study. At baseline, 86% of the participants had LVDD (n = 44). After the 1-year program, LVDD improved in 57% of participants (n = 29, P < 0.0001). All metabolic, adiposity, and exercise tolerance measures improved from baseline (P < 0.0001), but were not associated with improvement in LVDD. Participants who improved LVDD had better exercise performance at baseline. Exercise tolerance during the submaximal exercise test, parasympathetic cardiac autonomic activity, and fasting insulin predicted 50% of LVDD improvements.
Conclusions:
There was a significant improvement in LVDD after a 1-year lifestyle intervention program in abdominally obese men with MetS, such an improvement being associated with increased exercise tolerance, enhanced HRV, and reduced insulin levels.
Introduction
I
Studies have suggested that LVDD could be reversible following pharmacological or surgical interventions. 6,10 –13 However, few data are available regarding the reversibility of LVDD following a lifestyle modification program, including healthier nutritional habits and increased physical activity among subjects with features of the MetS, as well as assessing body composition, HRV, and different stages of LVDD. Although it has been reported that LVDD may limit exercise capacity in well-controlled patients with type 2 diabetes 14 and an aerobic exercise training program may reverse LVDD in these patients, 13 the links between LVDD and exercise capacity and the determinants of LVDD reversibility after a comprehensive nonpharmacological approach consisting of healthy eating and physical activity/exercise program in MetS are unknown.
This study aims to evaluate the impact of a lifestyle modification program on the reversibility of LVDD in participants with the MetS and explore the factors potentially associated with improved LVDD. We tested the hypothesis that the participants’ LVDD would improve after the 1-year program and changes in some of the metabolic risk variables and HRV would be associated with the improvement in LVDD.
Materials and Methods
Study design
A subgroup of 51 men, aged between 30 and 65 years, presenting abdominal obesity [waist circumference (WC) ≥90 cm], triglyceride levels ≥1.7 mmol/L, and/or HDL-cholesterol <1.03 mmol/L, who participated in a 1-year lifestyle modification program (the “SYNERGIE” study 15 ) underwent echocardiography and 24-hr Holter monitoring. Participants with type 2 diabetes, body mass index (BMI) values <25 or >40 kg/m2, or taking medication targeting glucose, lipid metabolism, or blood pressure (BP) were excluded. Written informed consent was obtained from all participants before their inclusion in the study.
Participants were individually counseled once every 2 weeks during the first 4 months of management with subsequent monthly visits to improve their nutritional and physical activity/exercise habits. Details regarding the intervention have been published elsewhere. 15 –19 The study was approved by both the Medical Ethics Committee of Université Laval and the Institut universitaire de cardiologie et de pneumologie de Québec.
Echocardiography and 24-hr Holter monitoring
Echocardiograms were performed according to the recommendations of the American Heart Association and the American Society of Echocardiography 20 using a commercial ultrasound system (Sonos 5500; Hewlet Packard, Andover, Massachusetts). Transmitral and pulmonary Doppler measurements with and without the Valsalva maneuver were performed to diagnose LVDD at baseline and after a 1-year follow-up, as previously published. 21 LVDD was graded as follows based on pulsed E and A wave mitral flow. Specifically, Grade 1 LVDD was based on E/A ratio <1, Grade 2: E/A ratio ≥1, but <2 at rest, and <1 after Valsalva maneuver, and Grade 3: resting E/A ratio >2. After the 1-year intervention, participants were classified as “Improved” or “Not Improved” LVDD versus baseline values. Improvements at 1 year compared to baseline were considered as follows: (1) from abnormal to normal left ventricular diastolic function, (2) improvements in inter-LVDD grades (e.g.: from grade 2 to grade 1), or (3) maintenance of normal left ventricular diastolic function throughout the study. Sizes of the left atrium and left ventricle were also measured, but reported as unindexed because of limited validity in obesity. 22 HRV was calculated from a 24-hr Holter monitoring system (Del Mar Medical Systems, Irvine, CA) as previously described. 23
Oral glucose tolerance test and lipid profile
Participants underwent an oral glucose tolerance test (OGTT) and lipid profile after a 12-hr fast. 15 –19 Plasma glucose and insulin were, respectively, analyzed enzymatically and by a radioimmunoassay. 24,25 Areas under the curve (AUC) for glucose and insulin were calculated by the trapezoid method between 0 and 180 min. Homeostasis model assessment of insulin resistance was calculated from fasting glucose and insulin values. 26
Bruce treadmill protocol
All participants underwent a maximal treadmill exercise test using the Bruce protocol (Q65 treadmill, Quinton Instrument Co., Bothel, Washington). 27,28 Participation was terminated at the point of exhaustion. During exercise testing, BP was measured noninvasively with an automated sphygmomanometer equipped with a headphone circuit option (Model 412. Quinton Instrument Co., Bothell, WA). During the test, participants were regularly shown a validated Borg perceived effort scale to assess their exertion level. 29 The same cardiologist supervised all tests at baseline and after the 1-year follow-up.
Submaximal exercise test
Participants also underwent a submaximal exercise test using a treadmill with gas exchange analyses on a breath-by-breath basis (TMX 425 treadmill, Trackmaster, Newton, KS; QuarkB2 monitor, Cosmed, Rome, Italy). The protocol of this test was conducted as previously described, 16 and participants were regularly shown a validated Borg perceived effort scale to assess their exertion level. 29
Computed tomography, dual-energy X-ray absorptiometry, and anthropometric measurements
Computed tomography (CT) scans were performed on a HiSpeed CT/I (General Electric, Milwaukee) as previously described. 30,31 With their arms stretched above their head, participants were examined in the supine position. Cross-sectional areas of visceral adipose tissue (VAT) were measured between L2-L3 and L4-L5. Data expressed in cm3 are means of L2-L3 and L4-L5 measurements multiplied by the distance separating the two slices. 18 Body weight in kilogram was assessed by dual-energy X-ray absorptiometry (DEXA) (LUNAR Protigy; General Electric, Madison, WI). Height and WC were measured according to standardized procedures. 32,33
Statistical analyses
Data are presented as means ± standard deviations (SD) unless specified otherwise. Unpaired t-tests were performed to compare groups of men at baseline and after the 1-year intervention. Groups were defined according to their improvement or nonimprovement in LVDD after the 1-year lifestyle intervention. Paired t-tests were then performed within each group and the whole sample to determine if changes in targeted variables were significant. Finally, an unpaired t-test was performed to assess changes (deltas) of each targeted variable between groups.
Pearson correlations evaluated relationship between changes in targeted variables and improvements in LVDD and E/A ratio. Univariate and multivariate analyses were adjusted for the age of participants at baseline. Stepwise multiple linear regression models were used to assess predictors of E/A ratio improvement. The final model included the following variables (deltas): exertion assessment at the second stage of the submaximal test, fasting insulin, total abdominal adipose tissue volume, and the daytime proportion of mean successive RR interval differences greater than 50 ms (pNN50). The significance level was set at P < 0.05. All analyses were performed with the software SAS version 9.4 (SAS Institute, Inc., Cary, NC).
Results
Baseline characteristics and echocardiogram measures of the 51 participants classified on the basis of improvement of LVDD after the intervention are presented in Tables 1 –4. Eighty-six percent of participants (n = 44) had LVDD before the lifestyle intervention: 2 with undetermined grade, 18 with grade 1 and 24 with grade 2 LVDD. The E/A ratio was significantly higher for normal versus abnormal LVDD at baseline (respectively 1.76 ± 0.46 and 1.19 ± 0.37, P = 0.0005). Left atrial size, LV diastolic diameter, and LV ejection fraction were normal in all groups, without any statistically significant differences. Tissue Doppler measurements were normal, but highly variable between subjects, therefore, there was no statistical difference between groups (data not shown). After the program, 57% of patients showed an improvement in left ventricular diastolic function (n = 29/51; P < 0.0001; Figs. 1a, b and 2). Five participants showed a deterioration of their left ventricular diastolic function through the study, that is, 4 went from grade 1 to 2 LVDD, and 1 went from normal left ventricular diastolic function to undetermined grade LVDD. Both undetermined grade LVDD at baseline normalized their left ventricular diastolic function after 1 year.

; abnormal relaxation (undetermined grade) =  ; abnormal relaxation (grade 1) =
  ; and abnormal relaxation (grade 2) =
  .
.
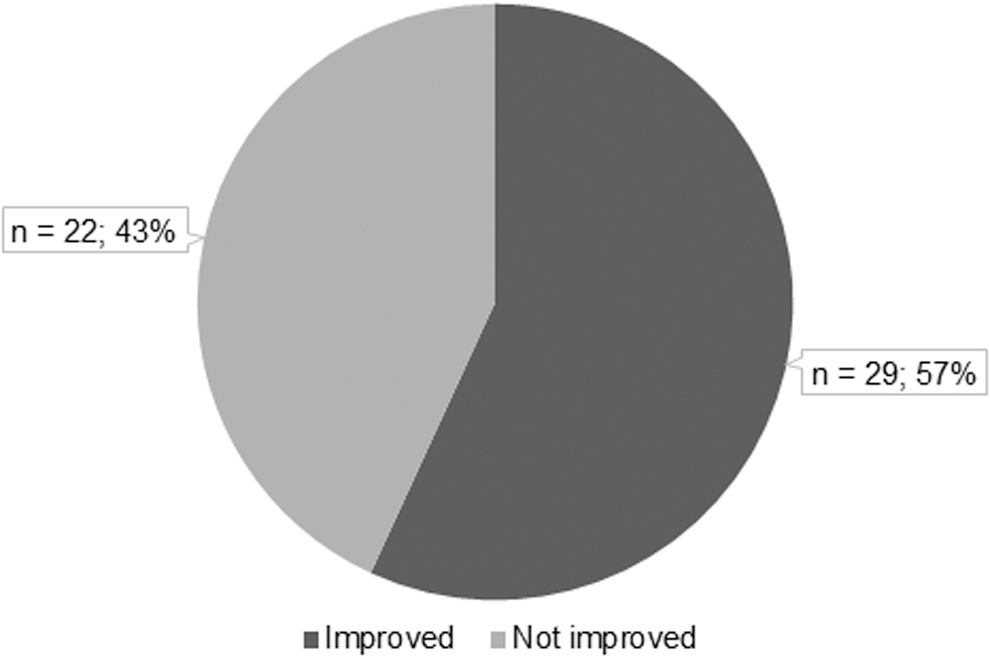
Proportion of improved LVDD at 1 year. LVDD, left ventricular diastolic dysfunction.
Data are presented as means ± SD.
P < 0.05 versus not improved at baseline.
P < 0.05 versus not improved at 1 year.
LVDD, left ventricular diastolic dysfunction; OGTT, oral glucose tolerance test; HOMA-IR, homeostasis model assessment of insulin resistance; SD, standard deviations.
Data are presented as means ± SD.
P < 0.05 versus not improved at baseline.
VO2peak, maximal exercise capacity.
Data are presented as means ± SD.
P < 0.05 versus not improved at baseline.
P < 0.05 versus not improved at 1 year.
HRV, heart rate variability; SDNN, the SD of the RR intervals; pNN50, the proportion of interval differences of successive NN intervals >50 ms; rMSSD, the square root of the mean squared differences of successive RR intervals; Ln, natural logarithm; HF, high frequency; LF, low frequency; LF/HF, the power in LF divided by the power in HF.
Data are presented as means ± SD.
Vmax, maximal velocity. T test compares normal versus abnormal LVDD parameters.
Characteristics differentiating the groups at baseline are presented in Tables 1 –3. Age, oxygen consumption (VO2) at the second and third stage of the submaximal exercise test, exertion assessment at the first and second stage of the submaximal exercise test, and rate pressure product (RPP) at maximal exercise were significantly different at baseline for participants who improved LVDD versus participants who did not (P < 0.05). At baseline, participants who improved their LVDD were younger and had a better exercise capacity, but worst perceived exertion during the submaximal test (higher VO2 and Borg scale, respectively) than participants who did not improve LVDD. RPP at maximal exercise was higher in the improved group (40,339 vs. 37,036 mmHg.bpm, P = 0.036). Fasting glycemia and insulin, as well as respective AUC after 180-min after OGTT were similar in both groups.
After the intervention, the only difference between groups was fasting glucose, which was lower in the improved group (P = 0.0253). VAT volume tended also to be lower in this group (P = 0.0711). Both groups improved similarly all adiposity measures (P < 0.0001), submaximal exercise performance (P < 0.05), insulin resistance variables (P < 0.05), and some features of the lipid profile (HDL, TG, and Apo A-1, P < 0.0001). Univariate correlations showed associations between improvements in the E/A ratio and exercise tolerance (r = −0.67, P < 0.0001), as well as with adiposity indices, particularly WC, BMI, body weight (r = −0.35 to −0.40, P < 0.01), and HRV variables (r from 0.20 to 0.40, P < 0.05). Stepwise multiple linear regression model revealed that deltas in exertion assessment at the second stage of submaximal test, pNN50, and fasting insulin predict 50% of the E/A ratio improvements (P = 0.0001; Table 5). RPP did not correlate with LVDD or E/A ratio improvements.
Adjusted model r 2 = 0.5013.
Discussion
We assessed the determinants of improved LVDD in men with features of the MetS following a 1-year lifestyle intervention program and documented that LVDD is reversible in a substantial proportion of participants. Determinants of LVDD reversibility have not been clearly characterized previously 13,34 –38 with conflicting results. 39,40 While many pharmacological approaches have been undertaken to positively impact LVDD, data suggest that in the presence of obesity, weight loss improves some features of LVDD. 34 We used refined evaluation of LVDD as per recommendations. 20 As expected, LVDD at baseline was age related. 41 Even though participants significantly improved several adiposity indices, performance on the treadmill test, as well as glucose metabolism, only some of these changes were associated with improvements in LVDD. Insulin resistance has been reported to be associated with LVDD and its reversibility. 37 In our study, fasting glucose was similar in participants with not improved versus improved LVDD after the intervention. No difference was observed in other glucose/insulin parameters between the “improved LVDD” versus the “not improved LVDD” groups. Looking at the two groups separately, there was a significant difference in VO2 and the Borg scale at the second stage of the submaximal test between the groups at baseline, as well as the RPP at maximal exercise. Participants who improved LVDD had a worst exercise tolerance (higher score on Borg scale assessment), a better maximal exercise capacity (higher VO2peak), and higher RPP. The improved group tended to perceive more discomfort during the first two stages of the submaximal exercise test at baseline, as expressed with the Borg scale, which could be a reflection of LVDD-induced subtle pulmonary congestion during exercise. 42
Cardiac parasympathetic modulation has been associated with LVDD in men with type 2 diabetes. 21 We documented a relationship of the same magnitude between pNN50 and E/A ratio reversibility (r = 0.47, P = 0.0006). In addition to body fat distribution and glucose tolerance, LVDD is also associated to HRV. 7,43 With a shorter intervention, sicker and more heterogeneous participants, Kosmala et al. reported that improved HbA1c was an independent predictor of LVDD improvement defined by E-wave velocity. 37 Similarly, we observed that fasting insulin improvements may be related to E/A ratio improvements (r = −0.28, P = 0.07). This association is coherent with the literature asserting that insulin is modulated by adiposity 44,45 and there is a link between LVDD and MetS. 8
The association between LVDD reversibility and improvements in adiposity, insulin resistance, and exercise capacity have previously been published. 34 –37 Other studies found that some indices of weight loss were associated with improved E wave, E/A ratio, or isovolumetric relaxation time after lifestyle modifications. 34,35,46,47 The association between weight loss following a lifestyle intervention and LVDD improvement (E wave velocity) was demonstrated in a study, including 48 patients who lost 4.5% of body weight in 12 weeks. However, body composition was not reported. 48 The magnitude of weight loss was greater in our study (7.1% over 52 weeks) and correlated with improvements in the E/A ratio. However, unlike some features of glucose metabolism, it was not a predictor of LVDD reversibility. To the best of our knowledge, this is the only study reporting correlations between E/A ratio improvements and VAT reduction after lifestyle modifications (r = −0.42; P = 0.0033), as well as body composition changes (% fat-free mass and % fat mass, r = 0.41 and −0.42, respectively; P = 0.0048). However, when included into the regression model, only fasting insulin was found to be a significant, but weak, predictor of E/A ratio improvements (r 2 = 0.07, P = 0.0226). This may be explained by the fact that insulin levels and visceral obesity are intrinsically linked together. Along with exercise tolerance assessed by Borg scale, HRV was found to be a predictor of LVDD improvement. This is innovative as exercise tolerance, in terms of maximal exercise capacity (VO2peak), has never been clearly associated with LVDD reversibility. 13,39,40 Lipotoxicity is known to mechanistically alter the active transport of ions during early LV relaxation and filling, 49,50 and to chemically alter endothelial function. 51 For those reasons, improvements in adiposity modulation may have had a positive impact on LVDD. Finally, improvement in adiposity measures could generate a less oxidative environment, 52 which could contribute to enhanced endothelial function.
Study limitations
This study has no control group and this may limit internal validity. Also, only men without diabetes were included. A selection bias could also be present because participants were volunteers. These may limit generalization of results to the general population or to highly LVDD-prevalent diabetic population. However, the aim of this study was to assess the determinants of LVDD reversibility after a lifestyle intervention. Along with the small sample size of this study and obviously the lack of power, the association between improvements of MetS features and LVDD may have been underestimated. Therefore, this study should be considered exploratory.
Conclusion
We found in viscerally obese men with features of the MetS that predictors of LVDD reversibility were exercise tolerance, fasting insulin, and HRV improvements. Further interventional studies including more participants, as well as including women, randomized with a control group, are required to better characterize the reversibility of LVDD.
Footnotes
Acknowledgments
This study was supported by the Institut universitaire de cardiologie et de pneumologie de Quebec (IUCPQ) research foundation and the Canadian Diabetes Association granted to Dr. Paul Poirier, and the Canadian Institute of Health Research granted to Dr. Jean-Pierre Després. Jacinthe Leclerc is recipient of a studentship from the Fonds d'enseignement et de recherche–Laval University, Faculty of Pharmacy. Dr. Patrice Brassard is a Junior 1 research scholar from the Fonds de Recherche du Québec—Santé (FRQS). A.A. is recipient of a studentship from the Fonds de Recherche du Québec—Santé (FRQS). Dr. Jean-Pierre Després is the scientific director of the International Chair on Cardiometabolic Risk. Dr. Paul Poirier is a senior clinical researcher of the Fonds de recherche en santé du Québec (FRSQ). We would like to express our gratitude to the study participants for their contribution to this study and to the staff for their dedicated work.
Author Disclosure Statement
No competing financial interests exist.