
Abstract
Background:
Obesity and its associated metabolic complications continue to increase worldwide. We investigated the development of metabolic syndrome (MetS) during aging in relation to body mass index (BMI) and exercise habits. We assigned special emphasis to the metabolic stability in individuals with obesity, but without MetS, a condition often referred to as metabolically healthy obesity.
Materials and Methods:
Cross-sectional analysis was carried out in a sample of 19,129 men and women aged 45–75 years from the EpiHealth study. In addition, longitudinal analyses were carried out in the ULSAM study (2322 men at baseline followed from age 50 to age 77) and in the PIVUS study (1016 men and women at baseline followed from age 70 to age 80). Participants were categorized into six groups according to BMI category (normal weight/BMI <25 kg/m2, overweight/BMI 25–30 kg/m2, and obesity/BMI >30 kg/m2) and MetS status (+/−, National Cholesterol Education Program criteria).
Results:
MetS prevalence and number of MetS components increased with age in all three samples. The PIVUS study showed that high baseline BMI, low baseline physical activity, and increasing BMI during follow-up were related to increasing MetS prevalence and increasing numbers of MetS components during follow-up. One-third to half of individuals initially belonging to the obesity without MetS category acquired MetS during aging.
Conclusions:
MetS prevalence increased during aging, especially in individuals with high BMI, low level of physical activity, and weight gain. Obesity without MetS was not a stable condition over time as many of those individuals gained metabolic disturbances during aging.
Introduction
O
In recent years, it has been highlighted that not everyone with obesity has a deranged metabolic profile, and the term metabolically healthy obesity (MHO) has been coined. 6,7 Individuals with MHO, defined according to the degree of insulin sensitivity, have exhibited less dyslipidemia, less inflammation, and less visceral fat than subjects with obesity and insulin resistance. 6 –8 A few studies with limited follow-up have suggested that MHO individuals would not be at an increased risk for cardiovascular disease compared with normal weight individuals without MetS. 9,10 However, we have previously shown that with a long follow-up period (decades), obesity without MetS is associated with increased total mortality and increased risks for developing cardiovascular disease and diabetes. 11,12 Two recent systematic reviews and meta-analyses also support the notion that obesity without MetS is not a harmless condition. 13,14
However, it is inherently problematic to assess cardiovascular risks based on body mass index (BMI) values and metabolic statuses from decades ago as both BMI and metabolic status may change with age. It is well known that body weight (and thus BMI) tends to increase during aging in adults of the Western world, except in the very old. In addition, several large, community-based cohort studies have shown that MetS prevalence is higher among older individuals 15 –19 and longitudinal studies have shown increasing MetS prevalence over time, especially in individuals with overweight or obesity. 9,17,20,21 Recent studies of weight development and metabolic stability over time indeed suggest that MHO is a transitory classification and that most MHO individuals develop MetS over time unless they lose weight. 17,22,23
In the present study, we aimed to investigate how MetS prevalence evolves during aging in relation to BMI and exercise habits, with special emphasis on the metabolic stability of individuals initially exhibiting obesity without MetS. We assessed this in men and women in Sweden, both in a cross-sectional manner using the population-based database EpiHealth and in a longitudinal manner using the well-characterized PIVUS and ULSAM cohorts. The hypotheses tested were that (i) MetS prevalence would increase during aging in relation to obesity and longitudinal weight gain and that (ii) obesity without MetS would not be a static condition and many individuals with obesity without MetS would acquire MetS over time.
Materials and Methods
The ULSAM study
In 1970–1973, all men aged 50 years (born in 1920–1924), residing in Uppsala county, were invited to a health survey aimed at identifying risk factors for cardiovascular disease. Eighty-two percent of the invited men participated (n = 2322). The design and selection criteria for the cohort have been described previously. 11 All participating men were invited to follow-up investigations at ages 60, 70, and 77 years.
The initial examination at age 50 has been described in detail previously. 11 Blood samples for fasting concentrations were drawn in the morning after an overnight fast. Cholesterol, triglyceride, and high-density lipoprotein concentrations in serum were assayed by enzymatic techniques. Fasting blood glucose was determined by an oxidase method. Supine systolic and diastolic blood pressures were measured twice in the right arm after 10-min rest and means were calculated. These characteristics were measured in a similar way at follow-ups. Exercise habits were assessed by questions on light and heavy leisure-time physical activities and expressed as sedentary, light, moderate, and athlete.
We used a modified version of the National Cholesterol Education Program (NCEP) definition of MetS 4 in the present study as waist circumference (WC) was not measured in all subjects at the age 50 examination. Instead of the WC >102 cm criterion, we used a BMI cut point of 29.4. The BMI cut point was determined by linear regression analysis of BMI versus WC in the 480-person subsample where both variables were determined (regression equation: BMI [kg/m2] = 0.298 × WC [cm] − 1.027) 24 and is similar to BMI cut points used in previous modified NCEP definitions of the MetS. 25,26 BMI did not differ between this subsample (25.2 kg/m2, standard deviation [SD] 3.1) and the rest of the cohort (25.0 kg/m2, SD 3.3, P = 0.32). For consistency, and to allow comparisons over time, we applied the same modified version of the NCEP criteria also at follow-ups, although WC was measured at later time points.
The PIVUS study
All men and women aged 70 years residing in the community of Uppsala, Sweden, were eligible. The subjects were chosen from the register of community living and were invited in a randomized order from April 2001 to June 2004. The subjects received an invitation by letter within 1 month of their 70th birthday. Of 2025 invited subjects, 1016 subjects were investigated, giving a participation rate of 50.1%. 27 All subjects still alive were invited to reexaminations at ages 75 and 80 years.
The initial examination at age 70 has been described in detail previously. 27 All participants were investigated in the morning after an overnight fast. No medication or smoking was allowed after midnight. Blood pressure was measured by a calibrated mercury sphygmomanometer to nearest mm Hg after at least 30 min of rest and the average of three recordings was used. Lipid variables and fasting blood glucose were measured by standard laboratory techniques. MetS was defined using the standard NCEP definition. 4 These characteristics were measured in a similar way at follow-ups.
Exercise habits were assessed by questions on light and heavy leisure-time physical activities and expressed as sedentary, light, moderate, and athlete.
The EpiHealth study
Starting April 27th, 2011, men and women aged 45–75 years in the Swedish towns of Uppsala and Malmö have been invited in a random manner to an ongoing health screening survey, EpiHealth. 28 The present evaluation of the sample was conducted in a sample of 19,129 individuals with complete BMI and MetS data, included in EpiHealth before Jan 1, 2015.
Blood samples were drawn after a minimum of 6 hr of fasting. Blood glucose and lipids were measured by standard laboratory techniques. Blood pressure was measured manually in triplicate in the sitting position. WC was measured at the umbilical level. MetS was defined using the standard NCEP definition. 4
Informed consent
Informed consent was obtained from all participants and all three studies were approved by the Uppsala University Ethics Committee.
Statistical analyses
By defining normal weight as BMI <25 kg/m2, overweight as BMI 25–30 kg/m2, and obesity as BMI >30 kg/m2, we placed participants in six categories: normal weight without MetS, normal weight with MetS, overweight without MetS, overweight with MetS, obesity without MetS, and obesity with MetS.
In the cross-sectional EpiHealth study, age as a continuous variable was transformed by a restricted cubic spline function with three knots (10th, 50th, and 90th percentiles). This spline function was used to model potential nonlinear relationships in logistic or linear regression models for the two outcomes, MetS and number of MetS components, respectively. Interaction terms between age and sex and between age and BMI were also evaluated.
In the two longitudinal ULSAM and PIVUS cohorts, development over time for MetS or number of MetS components was evaluated by mixed models with random intercept (for individual) and slopes (for time) (STATA commands, xtmelogit and xtmixed, respectively). If convergence was not found for random slopes, only random intercept models were used. Interaction terms between age and sex and between age and BMI were included in the models to evaluate need of stratification.
STATA 14 (College Station, TX) was used for all analyses and P-values <0.05 were regarded as statistically significant in all analyses.
Results
EpiHealth
Number of participants, mean BMI, exercise habits, MetS prevalence, and mean number of MetS components in the cross-sectional EpiHealth study are given in Table 1.
Participants have been grouped by age for data visualization purposes only; age was used as a continuous variable in all analyses.
For change in overall physical activity with age.
BMI, body mass index expressed in kg/m2; MetS, metabolic syndrome; SD, standard deviation.
A significant relationship was seen between age and prevalent MetS (P < 0.0001, Table 1 and Fig. 1A). This relationship was nonlinear in men (P < 0.0001). A significant interaction was seen between age and sex (P < 0.0001). Odds ratios for a 1-year change in MetS status were 1.044 in women (95% CI 1.038–1.050, P < 0.0001) and 1.023 in men (95% CI 1.017–1.029, P < 0.0001), meaning that each additional year of age was associated with an increased MetS risk of 4.4% and 2.3% in women and men, respectively.
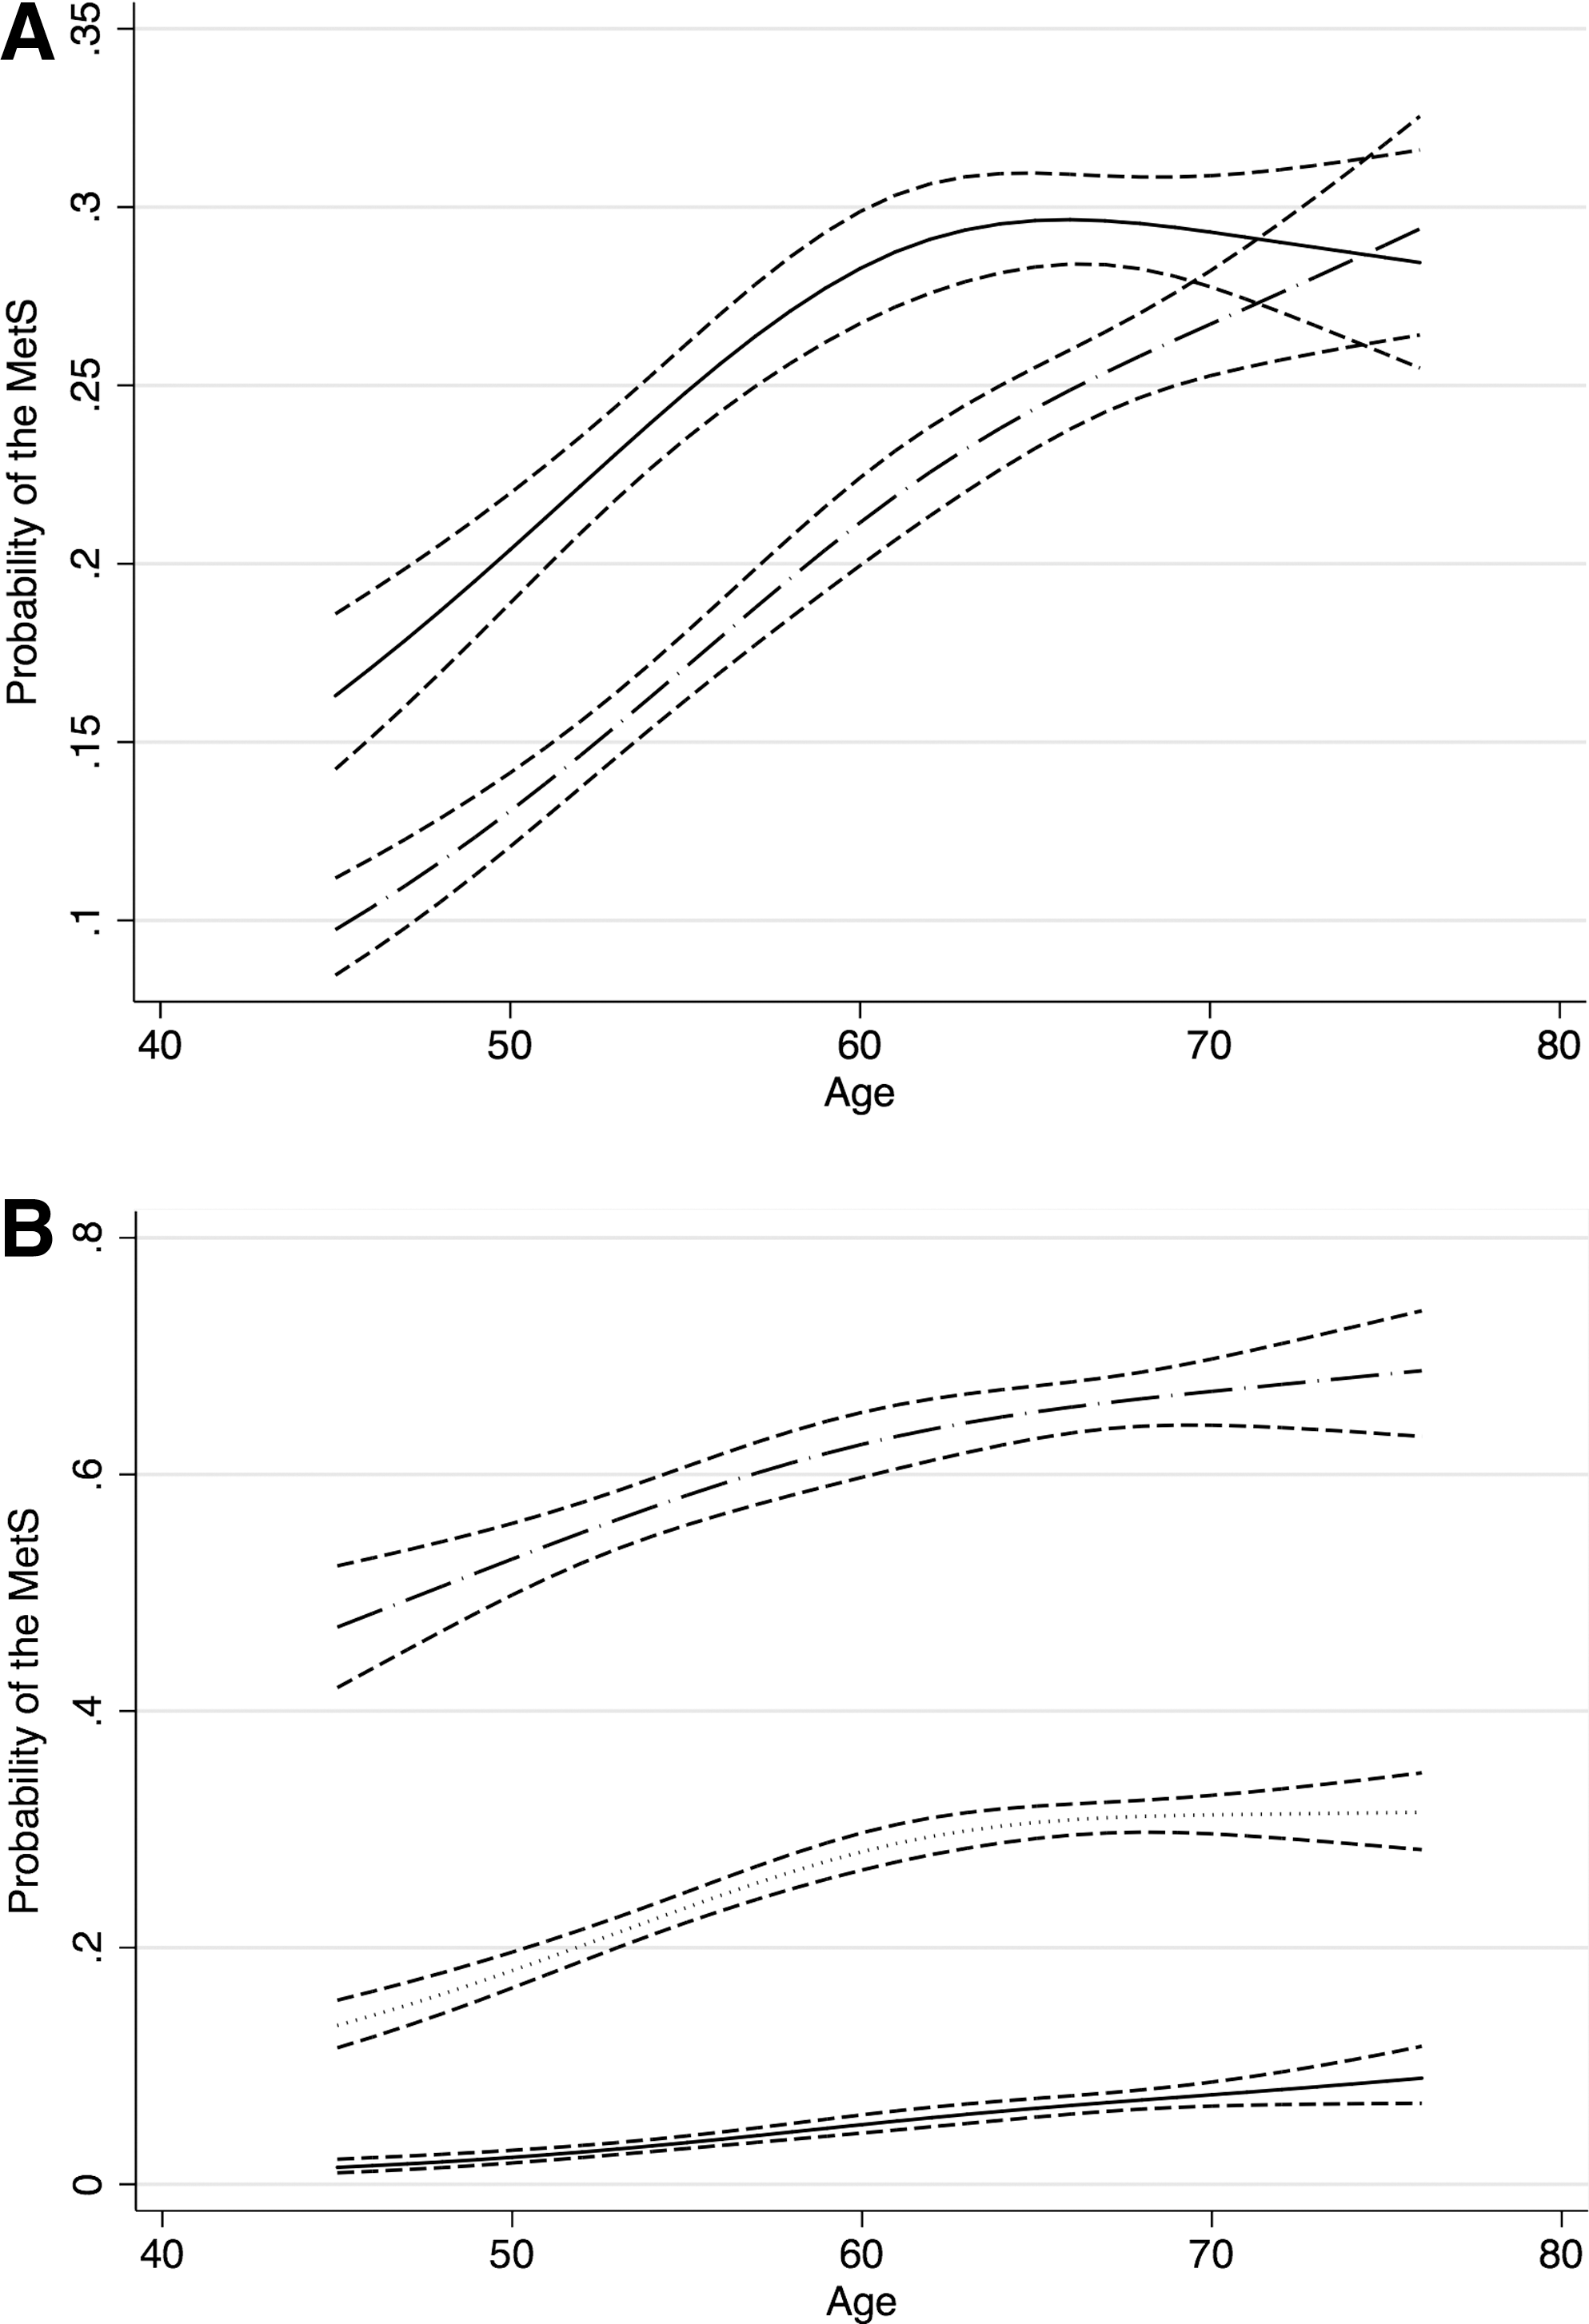
A similar pattern was seen when age was related to the number of MetS components (P < 0.0001, Table 1). In addition, this relationship was nonlinear in men (P < 0.0001), and a significant interaction was seen between age and sex (P < 0.0001). Beta values for a 1-year change in the number of MetS components were 0.036 in women (95% CI 0.034–0.039, P < 0.0001) and 0.022 in men (95% CI 0.019–0.025, P < 0.0001).
Leisure-time physical activity, assessed on a five-level scale from sedentary to athlete, was negatively related to MetS prevalence when adjusting for age, sex, and BMI (OR 0.84, 95% CI 0.80–0.88, P < 0.0001 for trend). No interaction was found between age and physical activity regarding prevalent MetS (P = 0.32).
In contrast, a significant interaction was seen between age and BMI regarding prevalent MetS (P = 0.0013). The largest absolute increases in MetS prevalence with age were seen in the groups with obesity and overweight (Fig. 1B). Between the age groups, 45–55 years and 66–75 years, MetS prevalence increased from 51.4% to 66.4% in the obesity group, from 17.8% to 31.2% in the overweight group, and from 2.3% to 7.3% in the normal weight group.
EpiHealth participants were categorized into six groups according to their BMI group and MetS status (Fig. 2A). The proportion of normal weight/MetS− subjects declined significantly with age (P < 0.0001), more pronounced in women than in men (P < 0.0001). The proportion of normal weight/MetS+ subjects increased with age (P < 0.0001), slightly more in women than in men (P = 0.03). No significant change with age was seen in the proportion of overweight/MetS− subjects (P = 0.21); however, the proportion of overweight/MetS+ subjects increased (P < 0.0001), especially in women (P = 0.0010 for sex × age interaction). The proportion of obesity/MetS− subjects declined significantly (P = 0.0008), while the proportion of obesity/MetS+ subjects increased (P < 0.0001). No significant sex × age interactions were found in the two obesity subgroups (P = 0.14 and P = 0.24, respectively).
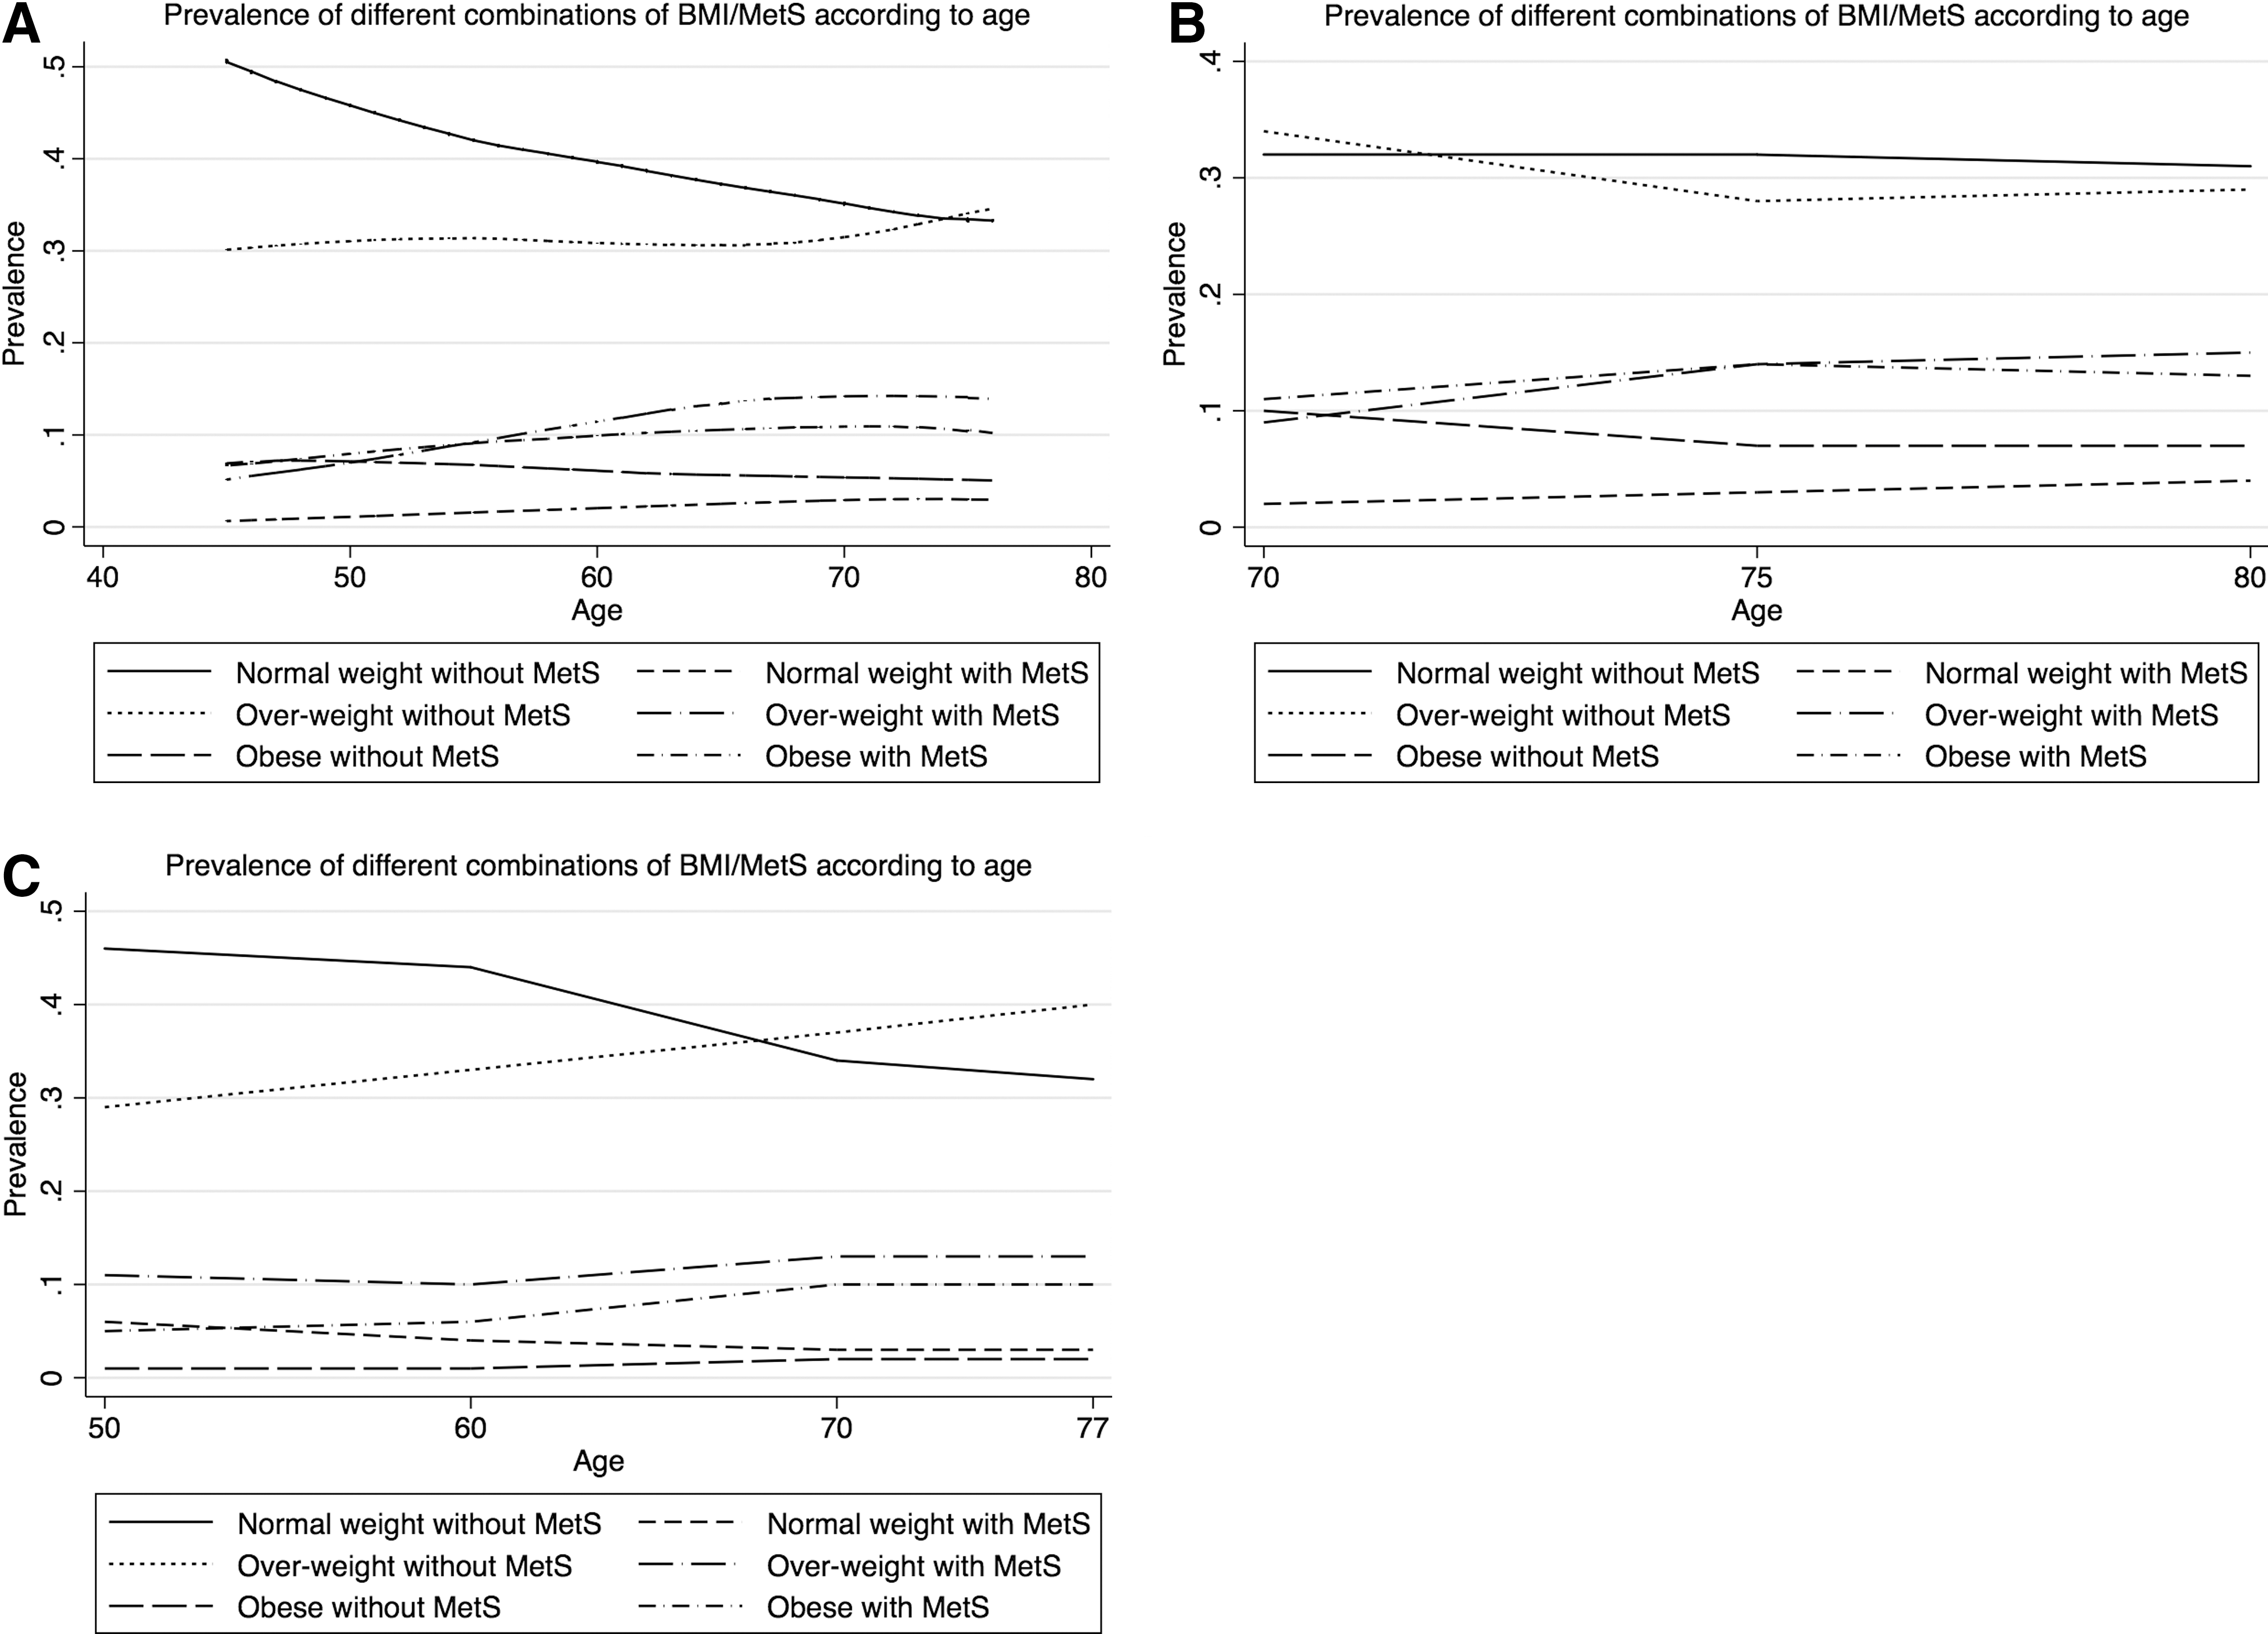
MetS prevalence in different BMI/MetS groups according to age in the EpiHealth
PIVUS
Number of participants, mean BMI, exercise habits, MetS prevalence, and mean number of MetS components in the longitudinal PIVUS study at baseline and at follow-up exams are given in Table 2. MetS prevalence increased significantly over time (P < 0.0001), but in a slightly less pronounced way in women (P = 0.032 for sex × time interaction). The number of MetS components also increased significantly over time (P < 0.0001), but with no differences between men and women (P = 0.66 for sex × time interaction). No significant interactions between BMI and time were found either when MetS prevalence or when number of MetS components were used as outcome (P = 0.25 and P = 0.41, respectively).
Men and women in PIVUS, men only in ULSAM.
For change in overall physical activity with age.
BMI, body mass index expressed in kg/m2.
The increase in MetS prevalence over time was significantly related to baseline values for BMI, baseline exercise habits, and to changes in BMI over the follow-up period, but not to changes in exercise habits (Table 3). The increase in number of MetS components over time was similarly related to baseline BMI, baseline exercise habits, and BMI changes (P < 0.0001 for all), but not to changes in exercise habits (P = 0.065).
Omitted due to collinearity problems.
BMI, body mass index; OR, odds ratio; CI, confidence interval.
PIVUS participants were categorized into six groups according to BMI and MetS and followed over time (Fig. 2B). The proportion of normal weight/MetS− subjects did not change (P = 0.95), while the proportion of normal weight/MetS+ subjects increased (P = 0.0012). A significant decline over time was seen in the proportion of overweight/MetS− subjects (P < 0.0001), while the proportion of overweight/MetS+ subjects increased (P < 0.0001). The proportion of obesity/MetS− subjects declined significantly (P < 0.0001), while the proportion of obesity/MetS+ subjects remained largely the same (P = 0.44).
One hundred two subjects were classified as obesity/MetS− at age 70; of which 82 were reinvestigated at age 75 and 59 were reinvestigated at age 80. In our subanalysis of their metabolic and weight stability, 45.1% and 40.6% were still classified as obesity/MetS− at 75 and 80 years, respectively, yielding kappa values for belonging to the obesity/MetS− group of 0.45 over the first 5 years and 0.41 over the entire 10-year follow-up period. Around one-third of the initial obesity/MetS− individuals still had obesity, but had developed MetS at follow-up (30.2% at age 75 and 32.3% at age 80). The remaining individuals had lost weight and were overweight with or without MetS at follow-up. The reduction over time was related to baseline BMI and changes in BMI over time (P < 0.0001 for both), but neither to exercise habits at baseline nor to changes in exercise habits over time (P = 0.30 and P = 0.14, respectively).
ULSAM
Number of participants, mean BMI, exercise habits, MetS prevalence, and mean number of MetS components in the longitudinal ULSAM study at baseline and at follow-up exams are given in Table 2. Both MetS prevalence and number of MetS components increased significantly over time (P < 0.0001 for both). Individuals with obesity exhibited the largest increases in both MetS prevalence and change in number of MetS components over time (P < 0.0001 for BMI × time interaction for both outcomes).
The increase in MetS prevalence over time was significantly related to baseline BMI (P < 0.0001) and exercise habits (P = 0.010), but not to changes in BMI over time (P = 0.24, Table 3). The increase in number of MetS components over time followed the same pattern with significant associations with baseline BMI (P < 0.0001) and exercise habits (P = 0.001), but not with changes in BMI (P = 0.10). Changes in exercise habits over time could not be evaluated for either outcome due to collinearity problems.
ULSAM participants were categorized into six groups according to BMI and MetS and followed over time (Fig. 2C). The proportion of normal weight subjects both without MetS and with MetS declined significantly (P < 0.0001 for both). The proportions of subjects with overweight increased significantly, both without MetS (P < 0.0001) and with MetS (P = 0.032). The proportions of subjects with obesity also increased, both without and with MetS (P < 0.0001 for both).
Twenty-seven subjects were classified as obesity/MetS− at age 50, of which 25, 16, and 13 were reinvestigated at ages 60, 70, and 77 years, respectively. The proportion of subjects initially classified as obesity/MetS− who were still obesity/MetS− at follow-up was 40% at age 60, 25% at age 70, and 15% at age 77. Kappa values for belonging to the MHO group were 0.32 over the first 10 years, 0.11 for 20 years, and 0.10 for the full 27-year follow-up period. Around half of the individuals initially classified as obesity/MetS− still had obesity, but had developed MetS at follow-up (40%, 56%, and 46% at ages 60, 70, and 77 years, respectively). The remaining individuals had lost weight and were found in the groups with overweight without or with MetS at follow-up.
Discussion
We found increasing MetS prevalence during aging to be related to both higher BMI and lower leisure-time physical activity in three population-based samples. Moreover, we found poor metabolic stability in individuals initially classified with obesity without MetS, a condition sometimes referred to as MHO. The large sample size of EpiHealth and the long follow-up periods of the PIVUS and ULSAM studies with repeated reexaminations make our results add weight to recent reports with similar results. 15 –19
In the cross-sectional analysis of EpiHealth data from around 19,000 individuals, MetS prevalence increased with age in a nonlinear manner with different patterns for men and women. Similar relationships were observed when the number of MetS components was used as outcome. MetS prevalence also increased during aging in the longitudinal PIVUS and ULSAM studies, with minor sex differences observed in the PIVUS study. Sex differences, due to behavioral as well as hormonal and genetic factors, are known to exist for both MetS prevalence and risk of cardiovascular disease, but need further attention. 29
Higher BMI at baseline was associated with increased risks of developing MetS or acquiring more MetS components during aging in both longitudinal studies. In the PIVUS study, the risks were also increased in individuals who gained weight during follow-up. In the ULSAM study, participants with obesity at baseline exhibited a greater increase in MetS prevalence or change in number of MetS components than leaner subjects. An elevated BMI was also related to a more pronounced increase in MetS prevalence with age in the cross-sectional analysis of the EpiHealth sample. These results are well in line with recent findings from the Framingham Offspring Study, where increasing BMI over time led to increased clustering of metabolic traits. 30 Studies of clustering of components of the MetS in different cohorts also found a central role for obesity. 31,32
Lower levels of leisure-time physical activity at baseline were also associated with increased prevalence of MetS and more MetS components during aging in both PIVUS and ULSAM. Increased leisure-time physical activity and reduced sedentary time have frequently been shown in cross-sectional analyses to reduce MetS prevalence and cardiovascular risk. 33,34 However, only a few studies have considered the effects of changes in exercise habits over time. 35 –37 The present study confirms the importance of an active lifestyle, although we found no associations between MetS and changes in physical activity over time. It should be noted, however, self-reported physical activity is a crude measure of exercise habits and also subject to reporter bias. Our results on the impact of exercise habits on obesity and MetS during aging must therefore be interpreted with caution.
We categorized all study participants according to standard BMI categories and MetS status. Despite some variations between the three samples, the overall picture showed decreases in the normal weight/MetS− and obesity/MetS− groups, variable results for the overweight/MetS− group, and increases in all MetS+ groups regardless of BMI during aging. Similar results, especially for the increasing normal weight/MetS+ and decreasing obesity/Met− proportions, have been reported by others. 15,16
It is well known that individuals with MetS have a worse prognosis with regard to cardiovascular disease than individuals without MetS at all levels of weight during long-term follow-up. 9 –11,38 There has, however, been a discrepancy between studies regarding the role of obesity in cardiovascular risk. 9 –11,13,14,18 The term MHO has been coined to describe a subset of individuals with obesity who would not be at an increased risk for cardiovascular disease. 6,8,9
To shed further light on the metabolic fate of obesity/MetS− individuals over time, we performed a subanalysis of PIVUS and ULSAM participants who were classified as obesity/MetS− at baseline. Of those attending reexaminations, approximately one-third (PIVUS) to half (ULSAM) developed MetS during aging. This was particularly true for individuals who had higher baseline BMI and/or gained further weight during the follow-up period. However, we found no influence of exercise habits, which has previously been reported to confer a protective effect in the transition from MHO to obesity/MetS+. 17,19,23
The present study, together with several recent studies of metabolic stability over time, 17,20 –23,30,39 provides ample evidence from various populations that a large proportion of so-called MHO individuals actually acquire additional cardiovascular risk factors and develop MetS during aging. Obesity without MetS should therefore not be considered as a stable condition and major preventive measures should be undertaken in this group to prevent the development of metabolic disturbances.
Strengths and Limitations
The major strengths of the present study are the long follow-up periods in two well-characterized, population-based longitudinal studies, together with similar results from a large cross-sectional study. The large size of the EpiHealth sample enabled the evaluation of nonlinear relationships as well as interactions with good statistical power. The major limitation is that the ULSAM study was performed in men only. However, the PIVUS and EpiHealth studies investigated both sexes and found similar results. All three studies were conducted in individuals of northern European descent, limiting the generalizability to other ethnic groups.
An unavoidable bias in longitudinal studies with prolonged follow-up periods occurs if the risk factor studied impacts mortality. During the 27/10 years of follow-up in the ULSAM/PIVUS studies, a number of the original participants died, obviously preventing them from participating at follow-up.
We performed a large number of tests using the conventional statistical significance level of 0.05, thereby possibly generating false-positive results. However, as our main findings (that MHO is not a stable condition over time) were highly significant (typically P < 0.0001) in all three samples, we are confident that our main results were not merely chance findings.
Conclusions
MetS prevalence increases during aging, especially in individuals with higher BMI and lower levels of physical activity. Obesity without the MetS, often called MHO, is not a stable condition over longer periods of follow-up. Substantial proportions of subjects with obesity, but without MetS at baseline, acquired MetS during aging. As MetS is an established and powerful risk factor for cardiovascular disease, our findings further emphasize the notion that obesity without MetS should not be regarded as a harmless condition.
Footnotes
Author Disclosure Statement
Johan Sundström serves on the advisory board for the fitness company Itrim. No potential competing financial interests exist for the other authors.