




Abstract
Purpose:
To estimate the contribution of accelerometer-derived physical activity to the relationship between sleep and cardiometabolic health.
Methods:
Data from the 2005 to 2006 US National Health and Nutritional Examination Survey were used (N = 1226; 20 years+). Metabolic syndrome (MetS) was defined by the Joint Interim Statement, and sleep quality and quantity by the Sleep Disorders Questionnaire. Physical activity intensities were defined by activity thresholds (counts per minute) as sedentary activity (0–99), light intensity (100–759), lifestyle activity (760–2019), moderate intensity (2020–5996), and vigorous intensity (≥5999). Outcomes were MetS, number of MetS components, waist circumference (WC), systolic and diastolic blood pressure (BP), triglycerides, HDL-cholesterol, fasting plasma glucose, and fasting insulin concentration. The bootstrap method was used to estimate the amount of mediation or contribution of activity intensities (ab) to the sleep–cardiometabolic health relationships, which were quantified as large (≥0.25) or moderate (≥0.09).
Results:
Lifestyle activity level contributes to several sleep duration and cardiometabolic health relationships, most notably for WC (ab: 0.28), systolic BP (0.39), and fasting insulin concentration (0.85). While moderate intensity and lifestyle activity intensities were large contributors to the sleep quality–fasting insulin concentration relationship (0.47 and 0.48, respectively), light intensity activity only moderately contributed to the relationship between sleep duration and quality with abdominal obesity (0.15).
Conclusion:
Lifestyle and moderate intensity physical activity have a large effect on the relationship between sleep and cardiometabolic health, including WC, BP, and fasting insulin concentration. Appropriate sleep hygiene, in combination with regular physical activity should be considered mutually beneficial targets for cardiometabolic health.
Introduction
S
Despite the consistent finding of a moderate-to-strong relationship between metabolic syndrome (MetS) and sleep duration, this relationship may be distorted by socioeconomic and behavioral factors. 7,13 Indeed, the association between sleep quality and MetS is similarly confounded by differences in lifestyle, 2,14 and the relationship between sleep disturbance and insulin resistance, in particular, has been suggested to be moderate and bidirectional. 15 Despite clear evidence of the interrelationship between sleep, activity, and cardiometabolic health, the pathways involved are rarely explored. Of note, studies on sleep and cardiometabolic health consider physical activity as a confounding (rather than explanatory) variable, 16 –21 and most previous studies on physical activity and cardiometabolic health do not consider sleep in any context. 22 –24 Therefore, the extent to which various physical activity intensities contribute to the sleep–cardiometabolic health relationship is currently unknown.
The purpose of our study is to address this knowledge gap and quantify the contribution of physical activity intensities to the relationship between sleep and cardiometabolic health. In this study, we use accelerometer-derived, rather than self-reported, physical activity data to minimize recall and healthy responder bias associated with the latter form of data. We hypothesize that physical activity contributes to the relationship between sleep and cardiometabolic health, with higher intensities of activity having greater influence, indicative of a dose–response relationship.
Research Design and Methods
Study design, setting, and participants
Data for this analysis were obtained from the United States (US) National Health and Nutrition Examination Survey (NHANES), a nationally representative cross-sectional study designed to assess the health and nutritional status of its noninstitutionalized civilian population. 25 Data were collected from personal interviews, standardized physical examinations, and laboratory samples. 25 Approximately, 10,000 people are sampled biannually; NHANES 2005–2006 cycle with an initial sample of 10,348 individuals was used in this study. Subsequent exclusions for age (<20 years; N = 5,369), pregnancy (N = 336), invalid accelerometer data (N = 1,770), missing cardiometabolic health variables [i.e., waist circumference (WC, N = 75), fasting triglycerides (N = 88), blood pressure (BP, N = 41), fasting plasma glucose (N = 1,263), high-density lipoprotein (HDL) cholesterol (N = 0), fasting insulin (N = 170)], and missing sleep (N = 10) data were made in sequence. The final analytic sample was 1,226. Fasting samples were obtained during the morning examination session after an overnight fast with a mean of 11.66 hr (SEM: 0.09 hr). 25
Exposures: sleep duration and quality
The Sleep Disorders Questionnaire was administered to participants aged ≥16 years, who reported their typical sleep habits for the past month. 25 This analysis used data from those aged ≥20 years. A single question was used to collect sleep duration information: “How much sleep do you usually get on weekdays or workdays?” Response to this question was collected in whole numbers between 1 and 11 hr, and truncated at ≥12 hr. 25 Based on previous literature, sleep duration was categorized as “very short” (≤4 hr), “short” (5–6 hr), “adequate” (7–8 hr), and “long” (≥9 hr). 26 Overall sleep quality was determined from the following six questions: “How often did you have trouble falling asleep?”; “How often did you wake up during the night and had trouble getting back to sleep?”; “How often did you wake up too early in the morning and were unable to get back to sleep?”; “How often did you feel unrested during the day, no matter how many hours of sleep you had?”; “How often did you feel excessively or overly sleepy during the day?”; and “How often did you not get enough sleep?”. 25 Responses to these questions [0 = Never; 1 = Rarely (once a month); 2 = Sometimes (2–4 times a month); 3 = Often (5–15 times a month); and 4 = Almost always (16–30 times a month)] were summed to obtain an overall sleep quality score. 17,25,27 The sleep quality score was subsequently categorized as: “good” (0 to <3); “fair” (3 to <7); “poor” (7 to <12); and “very poor” (≥12–24) on the basis of previous work. 17,27
Outcomes: cardiometabolic health
MetS, an indicator of cardiometabolic health, was defined according to the Joint Interim Statement 28 as ≥3 of the following: elevated WC (men: ≥102 cm; women: ≥88 cm); elevated fasting triglycerides (≥1.69 mM) or medication; low HDL cholesterol (men: <1.04 mM; women: <1.29 mM) or medication; elevated BP (systolic: ≥130 mmHg; diastolic ≥85 mmHg) or medication; and elevated fasting plasma glucose (≥5.6 mM) or medication. 28 Subsequently, these criteria were summed to create a number of MetS components [0, 1, 2, 3, 4, 5] variable. 26 Finally, fasting insulin concentration [pM], as well as each MetS component listed above were used as individual outcome variables.
Mediators: physical activity and sedentary activity behavior
Objective measures of movement intensity and duration were collected over seven consecutive days (AM-7164; ActiGraph, Walton Beach, FL). 25 Because the ActiGraph monitors are not waterproof, participants were instructed to wear the device on the waist during all waking activities that were nonwater related, and thus, water-related activities, such as swimming, were not captured. 25,29 We obtained the downloadable file from NHANES that contained valid accelerometer data, defined as a wear time of ≥10 hr per day for 4 days. 25 Physical activity monitor data were used to define thresholds for activity in counts per minute (cpm): 0–99 for sedentary activity, 100–759 for light-intensity activity, 760–2019 for lifestyle activity, 2020–5998 for moderate-intensity activity, 2020 or more for moderate- and vigorous-intensity activity, and 5999 or more for vigorous-intensity activity. 29
Mediation model
The mediation model that helps explain the underlying relationship between an exposure and an outcome variable through a third (mediatory) variable was used to estimate the contributions of physical activity intensities to the sleep–cardiometabolic health relationship. 30 Briefly, the mediation model (Fig. 1) is a series of regression analyses that contain four path analyses: (1) path a is a regression between the exposure and the mediator; (2) path b is a regression between the mediator and the outcome, while adjusting for the exposure; (3) path c is a regression between the exposure and the outcome; and (4) path c′ is a regression between the exposure and the outcome, while adjusting for the mediator. 30 In the mediation model, the products of ab and c-c′ are mathematically equivalent, and ab is considered the “amount” of mediation or contribution a mediator provides to the relationship between an exposure and an outcome. 30

Multiple regression method of the indirect mediation model. 30 Path a is a regression analysis between the exposure (e.g., sleep duration) and the mediator (e.g., moderate-intensity physical activity level). Path b is a regression analysis between the mediator and the outcome (e.g., fasting insulin concentration [Insulin]) adjusting for the exposure. Path c is a regression analysis between the exposure and outcome. Path c′ is a regression analysis between the exposure and the outcome adjusting for the mediator. The indirect effect (ab) estimate is the amount of contribution a mediator provides to the relationship between an exposure and an outcome. MetS, metabolic syndrome; #MetS, number of MetS components; WC, waist circumference; SBP, systolic blood pressure; DBP, diastolic blood pressure; TG, fasting triglycerides; HDL, high-density lipoprotein cholesterol; Glu, fasting plasma glucose; Insulin, fasting insulin concentration.
Demographic and behavioral characteristics
Demographic variables used to describe the sample include age, sex, ethnicity, income, and education. Age was categorized as 20 to <40 years, 40 to <65 years, and ≥65 years. Ethnicity was self-ascribed and categorized as non-Hispanic white, non-Hispanic black, Mexican American, and Other. Income was categorized as <$20,000, $20,000–44,999, and ≥$45,000, and education as <high school, high school, and at least some college. Alcohol intake was categorized as none, <3, and ≥3 drinks per day, and smoking history as current (if smoking now), past (if smoked ≥100 cigarettes in one's life, but not a current smoker), or never (if smoked <100 cigarettes in one's life). 26
Statistical analyses
Mean and 95% confidence interval (CI) for continuous variables, and frequency (percentage) and 95% CI for categorical variables were stratified by sleep duration and sleep quality. ANOVA and χ 2 tests were used, as appropriate, to test for any differences in demographic and behavioral characteristics across groups. The medical examination sample weight from the demographic data file was used to weigh descriptive analyses and thus make them representative of the U.S. adult population. 25 Our primary statistical method is the bootstrapped mediation analysis. We used the bootstrap method with 5000 iterations to estimate the amount of mediation or contribution (ab) by each mediator and present the bias-corrected ab estimates with 95% CI and p-values. 31 The contribution of each mediator is also described as “large” (≥0.25), “moderate” (≥0.09), “modest” (≥0.01), and “weak” (<0.01), based on the recommendations of Kenny. 30 All analyses were conducted in SAS v9.3 (Cary, NC), except when the outcome was binary (i.e., MetS). As per the recommendation of Hayes, 32 mediation analyses for MetS were conducted using SPSS v22 (Chicago, IL). Statistical significance was set at an α of 0.05.
Results
Demographic and behavioral characteristics
Table 1 describes the sample characteristics by sleep duration. Very short sleep duration was higher among 40–65 year olds, men, non-Hispanic blacks, lower educational attainment, and current smokers. As expected, a greater proportion of participants reporting shorter sleep duration also reported lower sleep quality. On the other hand, non-Hispanic whites and those with a college education had a higher proportion of adequate and long sleepers. All participants (n = 1,226) had accelerometer data to suggest that they engaged in sedentary, light intensity, and lifestyle activities. One thousand two hundred and twenty-one participants had moderate-intensity and moderate- and vigorous-intensity activity data, and 417 participants had vigorous-intensity activity data.
Mean (95% CI) for continuous variables and frequency% (95% CI) for categorical variables. Sleep durations are very short (≤4 hr per night), short (5–6 hr per night), adequate (7–8 hr per night), and long (≥9 hr per night). Responses to six sleep quality habits were summed and categorized as quartiles as good (<3), fair (≥3–7), poor (≥7–12), and very poor (≥12). A P < 0.05 indicates significant difference between the sleep duration categories. Two-sided ANOVA or χ 2, as appropriate. NS is not significant.
Estimates of mediations or contributions
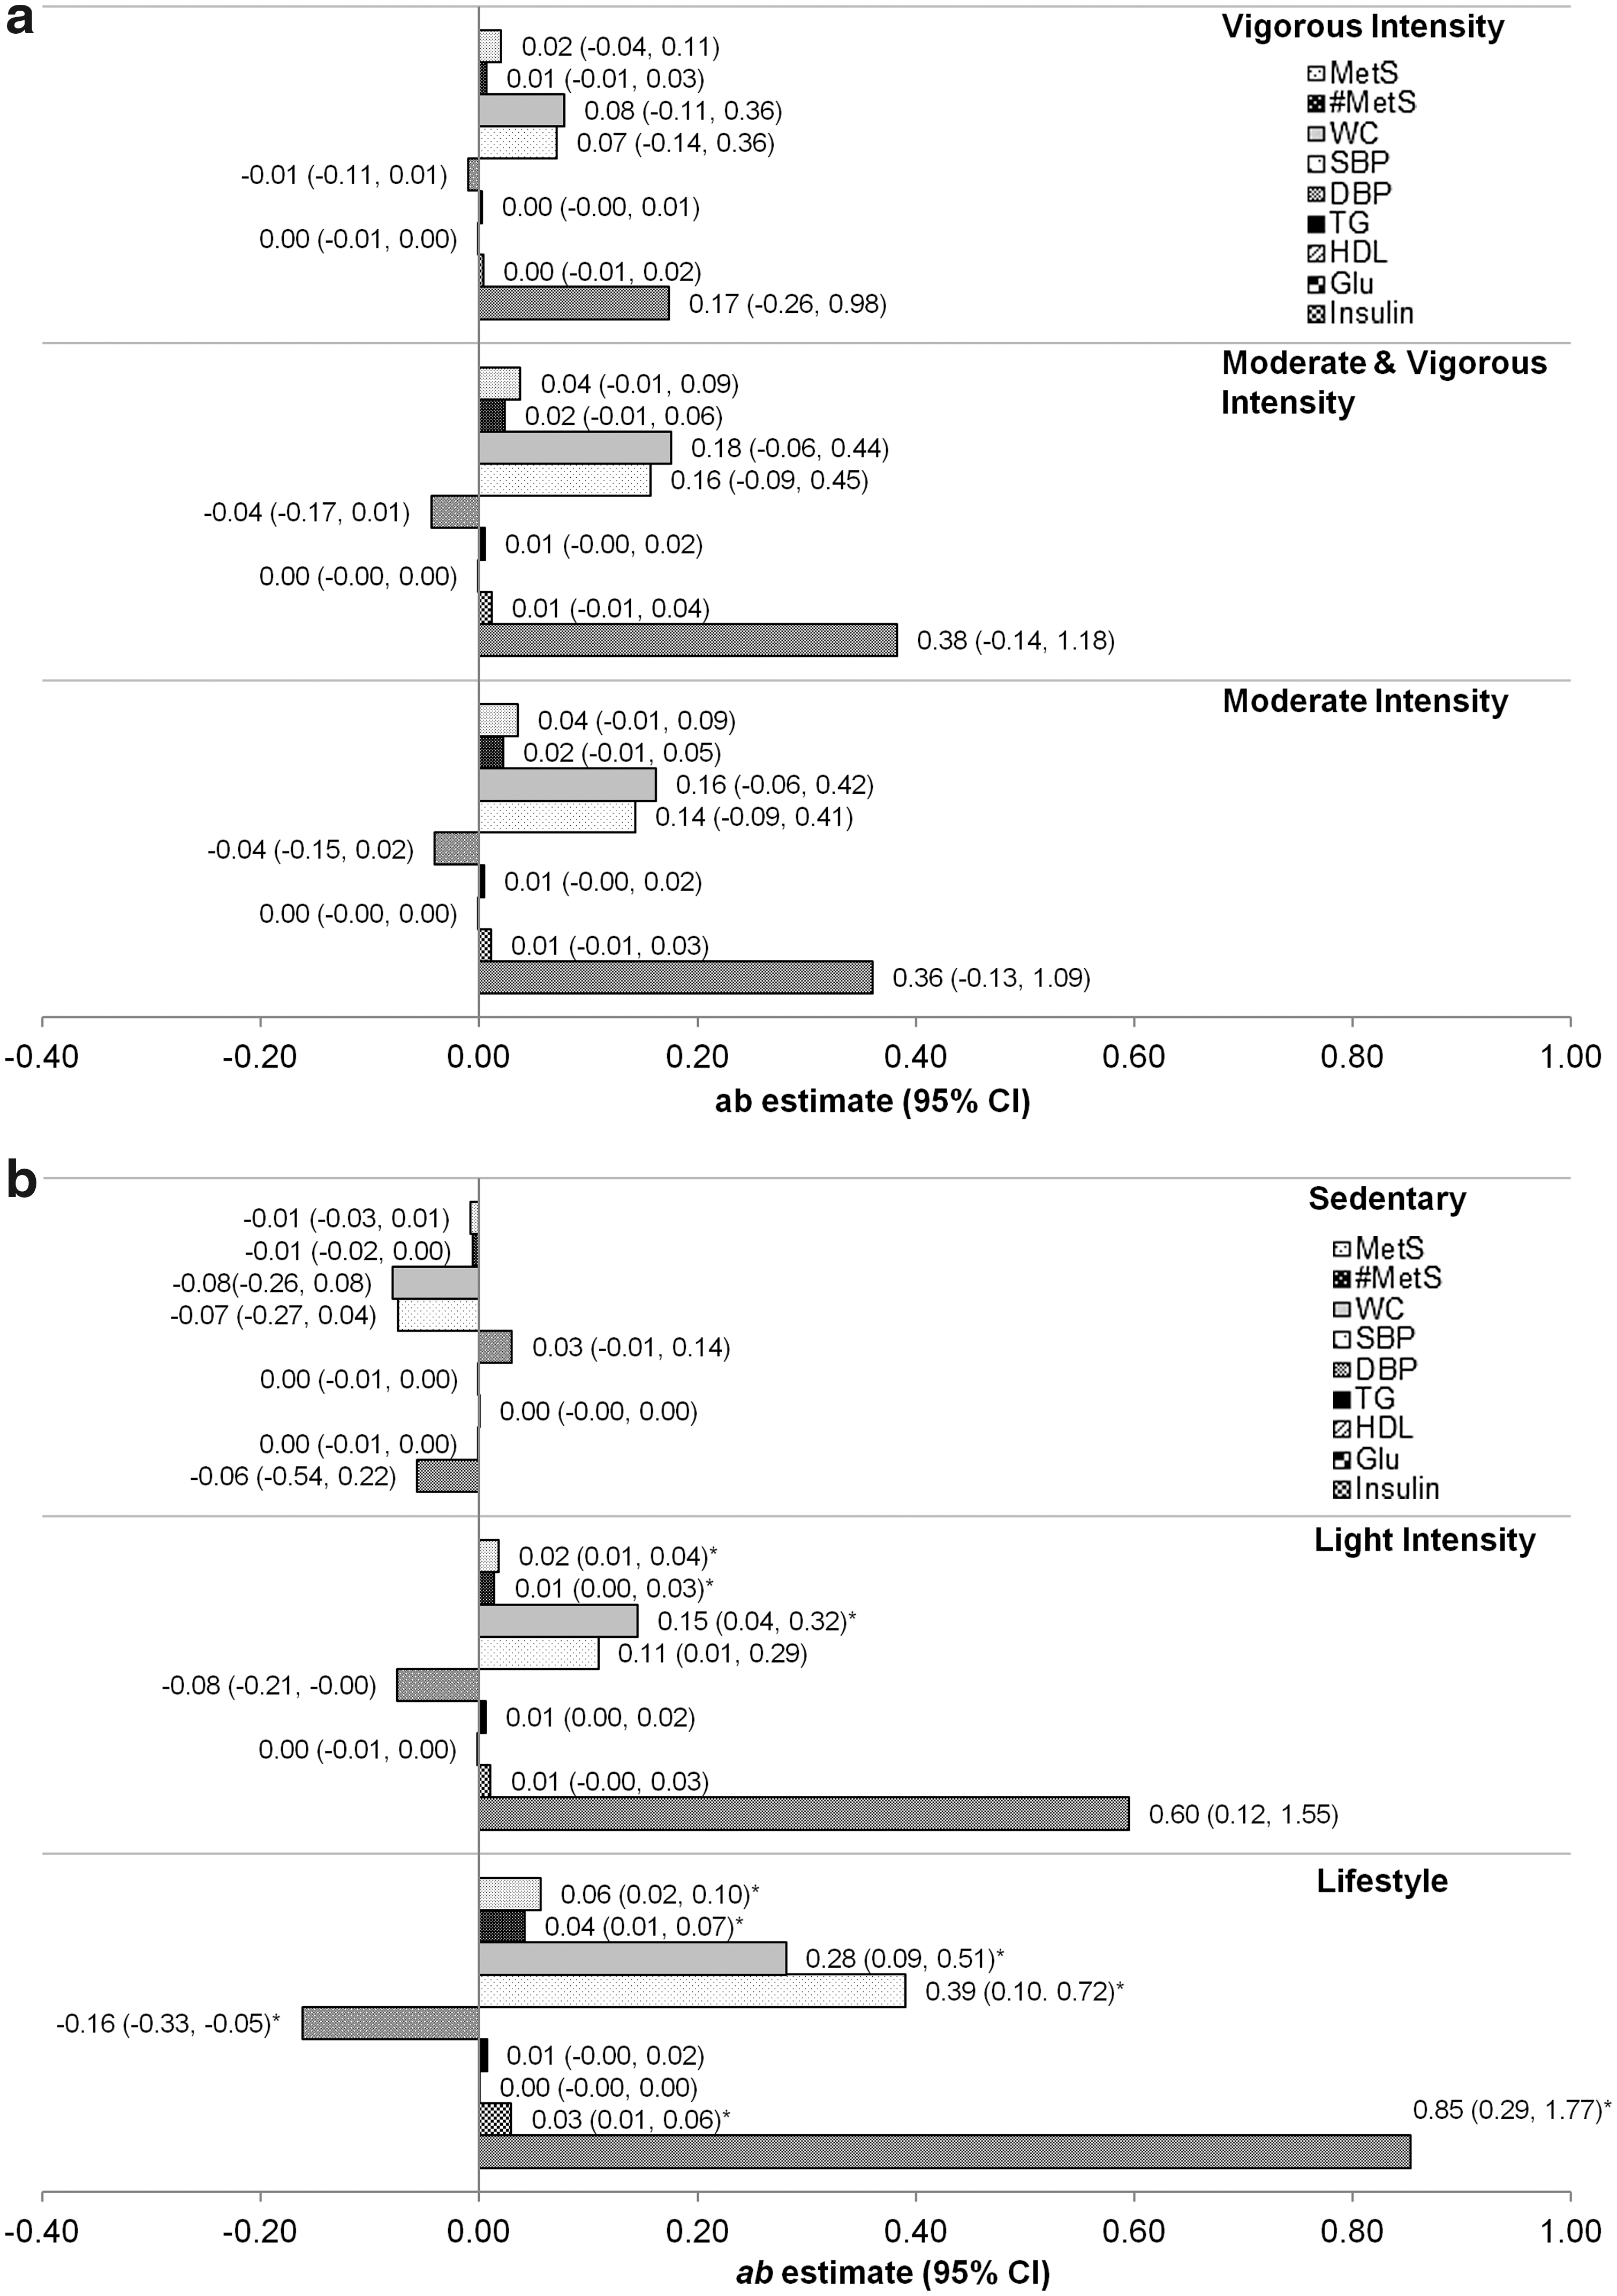
Figures 2 and 3 provide the estimates of mediation or contribution by each mediatory variable (i.e., physical activity intensities) to the sleep–cardiometabolic health relationship. Figure 2 describes the sleep duration–cardiometabolic health relationship. Estimates for the contributions of moderate-intensity, moderate- and vigorous-intensity, and vigorous-intensity activity are provided in Figure 2a; and those for lifestyle activity, light-intensity, and sedentary activity are provided in Figure 2b. Only lifestyle activity and light-intensity activity significantly contributed to more than one sleep duration–cardiometabolic health relationship. For the sleep duration-WC and systolic BP relationships, lifestyle activity had a large contribution [ab estimate (95% CI), P-value; WC: 0.28 (0.09, 0.51); systolic BP: 0.39 (0.10, 0.72)], and light-intensity activity made a moderate contribution [WC: 0.15 (0.04, 0.32); systolic BP: 0.11 (0.01, 0.29)]. Furthermore, the direct relationship between sleep duration and WC and diastolic BP, that is, path c, were also significant [β (SE), P-value: −1.43 (0.59), P = 0.02; and −1.29 (0.54), P = 0.02, respectively], but the relationship between sleep duration and systolic BP was not [−0.56 (0.75), P = 0.45]. Lifestyle activity level also moderately contributed to the relationship between sleep duration and diastolic BP [0.16 (0.33, 0.05)], whereas the contributions of lifestyle activity and light-intensity activity on the sleep duration–fasting insulin concentration relationship were large [lifestyle activity: 0.85 (0.29, 1.77), P = 0.03; light intensity: 0.60 (0.12, 1.55), P = 0.06]. Overall, the direct relationship between sleep duration and fasting insulin concentration was in the inverse direction, but nonsignificant [β (SE), P-value: −2.96 (3.06), P = 0.33].
The contribution of
The contribution of
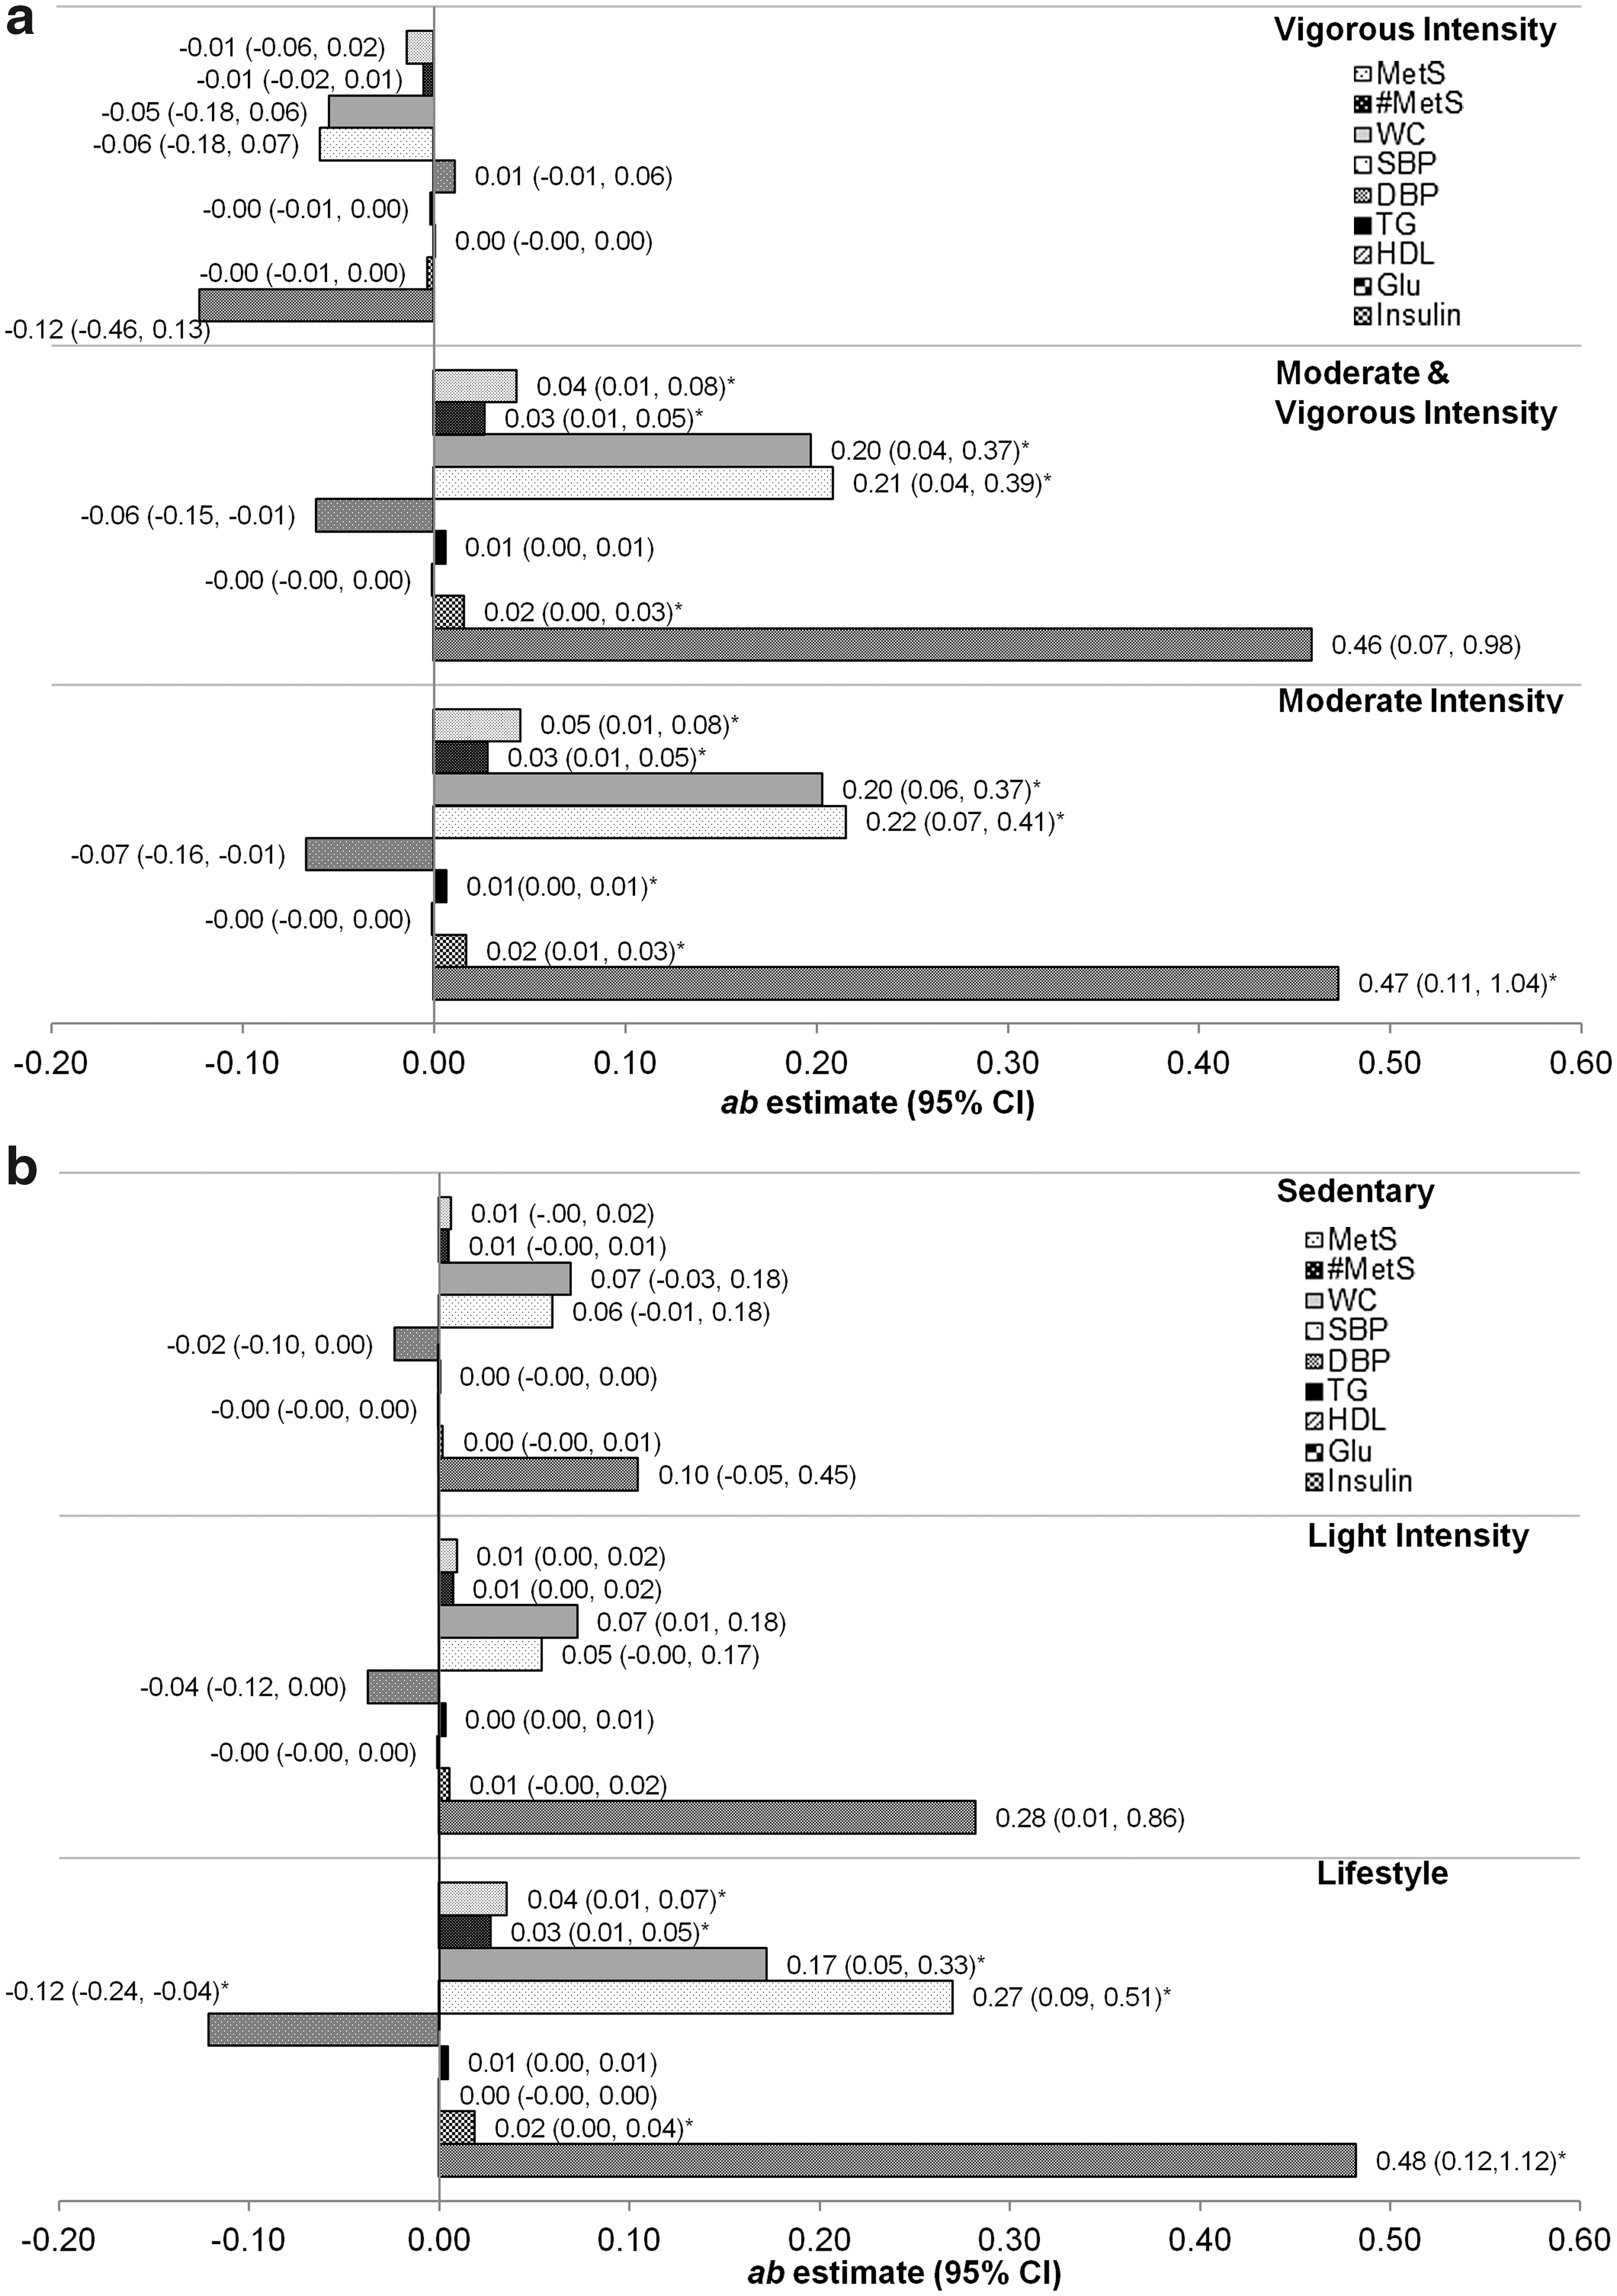
Figure 3 describes the sleep quality–cardiometabolic health relationship. Contribution estimates for moderate-intensity, moderate- and vigorous-intensity, and vigorous-intensity activity are provided in Figure 3a; and those for lifestyle activity, light-intensity, and sedentary activity are provided in Figure 3b. Overall, the contributions of moderate-intensity [0.20 (0.06, 0.37), P = 0.01], moderate- and vigorous-intensity [0.20 (0.04, 0.37), P = 0.02], and lifestyle activity [0.17 (0.05, 0.33), P = 0.01] on the sleep quality-WC relationship were moderate. Similarly, the same activity measures moderately contributed to the association between sleep quality and systolic BP [0.22 (0.07, 0.41), P = 0.01; 0.21 (0.04, 0.39), P = 0.02; and 0.27 (0.09, 0.51), P = 0.01, respectively]. Lifestyle activity level also moderately contributed to the relationship between sleep quality and diastolic BP [−0.12 (−0.24, −0.04), P = 0.02]. The direct relationship between sleep quality and diastolic BP was also significant [β (SE), P-value: 0.84 (0.35), P = 0.02]. Finally, the contributions of moderate-intensity, moderate- and vigorous-intensity, and lifestyle activity on the sleep quality–fasting insulin concentration relationship were large [0.47 (0.11, 1.04), P = 0.04; 0.46 (0.07, 0.98), P = 0.05 (not significant); and 0.48 (0.12, 1.12), P = 0.04, respectively]. In most cases, path b for the relationship between physical activity level and cardiometabolic outcomes persisted after adjusting for sleep.
Discussion
Our aim was to quantify the contribution of physical activity intensity to the sleep–cardiometabolic health relationship and thus determine whether activity intensities lie on the pathway. We also aimed to determine if the contributions depended on activity intensity. In these regards, we found that moderate-intensity, moderate- and vigorous-intensity, light-intensity, and lifestyle activity contributed significantly to the relationship between sleep and WC, and sleep and BP. To our surprise, moderate-intensity and lifestyle activity had a large contribution to the sleep–fasting insulin concentration relationship, while higher intensity activities did not. Thus, the contributions of activity intensities to the sleep–cardiometabolic health relationships were not dose dependent. To our knowledge, this is the first time that the contributions of activity intensities on the sleep–cardiometabolic health relationship have been evaluated, several of which warrant discussion.
Waist circumference
Our finding that physical activity was only a modest contributor of the sleep-WC relationship is consistent with the work of Fogelholm et al., 19 but contrasts with the finding of a dose-dependent effect of others. 8,9 The narrow scope of our analysis (i.e., we evaluated the contributions of activity intensities to the sleep-WC relationship), limited number of participants who engaged in higher intensity activities, and the use of a cross-sectional dataset to evaluate these relationships 33 may partially explain this discrepancy. Nonetheless, the richness of the NHANES dataset allowed us to provide initial evidence on which future simulation models exploring more vigorous-intensity activity can build. Furthermore, it is important to note that we used the bootstrap method, a nonparametric test that assumes linear relationships between paths, 31 and thus our estimates are likely conservative.
One novel contribution of this study to the sleep-obesity literature is the inclusion of lifestyle and light-intensity activity, which parallels earlier work on NEAT. Previously, NEAT was found to be lower in individuals with obesity, 11 while its relationship with sleep was speculative. 34 Proposed mechanisms include a link between obesity and increased sleeping metabolic rate 18 and nocturnal activity counts, 21 which may result from an increased sympathetic activity during nocturnal hours. 35 However, NHANES required participants to remove the accelerometer during sleep and thus it is unlikely that the bedtime activity counts had an effect on our findings. 25 To limit the potential for measurement bias associated with self-report, future studies must employ accelerometer-based measures of both sleep and physical activity.
Blood pressure control
Our findings suggest that physical activity is only a modest contributor to the sleep-BP relationship. This is consistent with other studies that have reported no significant effects, 22 or only weak-to-moderate relationships between physical activity and BP overall. 16,36 Being physically active, however, influences the nocturnal dipping of BP through the sympathetic and renin–angiotensin systems. 16 Therefore, our study provides initial evidence that moderate and lifestyle activities are important contributors to the relationship between suboptimal sleep and elevated blood pressure in free-living adults.
Glycemic control
Several plausible mechanisms exist to explain the relationship between sleep deprivation and insulin resistance, including the rise in evening cortisol levels, and the decrease in noninsulin-dependent utilization of glucose in the brain. 37 Higher energy expenditure, however, is beneficial for enhancing insulin sensitivity and glycemic control. 18,38 Even low-to-moderate physical activity has been shown to have an acute blunting effect on insulin levels, 39 but physical activity is seldom considered in studies on sleep and insulin resistance, or glycemic control. 17,20 In this respect, our finding that moderate-intensity and lifestyle activity are large contributors to the relationship between sleep and fasting insulin concentration addresses an existing knowledge gap, and from a clinical perspective, offers insight into the utility of promoting sleep alongside lifestyle-based activity for diabetes care and risk reduction.
An important question still remains: Can sleep deprivation (i.e., ≤6 hr per night) be compensated by increased physical activity intensities to yield the same cardiometabolic health benefits of an adequate sleeper? If so, what physical activity intensities and volumes are needed to compensate for the sleep deprivation? Recently, Buman et al. 4 approached this question using isotemporal substitution and found that reallocating 30 min/day of sleep, sedentary activity, or lifestyle activity with moderate-to-vigorous physical activity had only a modest effect on indicators of cardiometabolic health. Nonetheless, addressing these questions from the perspective of sleep deprivation in adults will help inform guidelines on the joint promotion of sleep, physical activity, and sedentary time. 40
Limitations
There are several limitations associated with our study. First, given the cross-sectional nature of the design, future longitudinal studies are needed to confirm the directionality and importance of these findings. Second, in applying our study exclusion criteria, our final analytic sample was only a fraction of the initial adult sample, and the smaller sample size may have contributed to the lack of significant direct effect between sleep and cardiometabolic risk factors. Sleep measures were also self-reported and susceptible to recall and response bias. Moreover, participants removed the device during water-related activities and sleep and thus our findings are not reflective of activity intensities and durations associated with these activities. Finally, limitations with accelerometer data include the possibility that data could be lost due to device tampering or processing, it records only uniaxial movement, and the novelty of wearing the device may result in higher activity counts (i.e., Hawthorne effect). 41
Conclusions
Moderate-intensity and lifestyle physical activity partially explain the observed relationships between sleep and WC, BP, and fasting insulin concentration. Since physical activity and sleep are related behaviors, promotion of proper sleep hygiene alongside lifestyle activity may be mutually beneficial for cardiometabolic health.
Footnotes
Author Disclosure Statement
No conflicting financial interests exist.