
Abstract
Background:
Fibronectin type III domain containing 5 (FNDC5) and its protein product Irisin are therapeutic targets for obesity-associated disorders. Irisin plays an important role in energy regulation, inducing browning of white adipocytes, and improving obesity. We aimed to investigate the association between muscle Irisin expression and dietary quality.
Methods:
Twenty-eight female mice were divided into four groups and fed the following experimental diets for 60 days: standard diet (SD), high-carbohydrate diet (HCD), high-fat diet (HFD), and high-protein diet (HPD). We evaluated body weight, food intake, serum total cholesterol, triacylglycerol, and glucose. We also performed glucose tolerance and insulin sensitivity tests. Expression of FNDC5 was evaluated by quantitative real-time reverse transcriptase polymerase chain reaction (qRT-PCR) of soleus muscle. Western blot was used to assess Irisin protein expression.
Results:
The major finding of the present study was that HFD and HCD were associated with a downregulation of FNDC5. In addition to these results, we noted a significant reduction in skeletal muscle Irisin level. HPD prevented reductions of both FNDC5 and Irisin levels, as well as increased brown adipose tissue, compared to the control group.
Conclusions:
In conclusion, we observed that the HPD type of diet can change both FNDC5 expression and Irisin levels. Thus, the HPD might be the most appropriate diet to achieve high amounts of Irisin, a target molecule for the treatment of obesity and its co-morbidities.
Introduction
I
Recent studies demonstrated the relationship between muscle and the levels of FNDC5 and Irisin. FNDC5/Irisin can be visualized and studied in femoral muscle tissue. 4 FNDC5 was detected at the sarcolemma and in the sarcoplasm showing a punctate signal, but not in the intercellular space between muscle fibers. However, the mechanism by which the muscle releases Irisin is not well established. Although the response of FNDC5 and Irisin to physical training is controversial, some researchers have shown that several types of training (acute and endurance) can increase FNDC5 and Irisin levels both in mice 3 and humans. 5 The response of FNDC5 is different from the effects of Irisin. Irisin levels in muscle and serum can be increased only after acute physical training without increasing the mRNA expression of FNDC5 and PGC1α protein. 4
Lower circulating levels of Irisin are associated with the onset of type 2 diabetes, 6 –8 risk of nonalcoholic fatty liver disease, 9 chronic kidney disease, 10 and heart failure. 11 These results indicate that Irisin could be secreted as an adaptive response. 12 A Korean study conducted in subjects with new onset type 2 diabetes mellitus reported decreased serum Irisin levels compared to matched controls with normal glucose tolerance. 6 In addition, 2-hr plasma glucose was independently inversely correlated with circulating Irisin levels after adjustment for age, sex, and body mass index (BMI). 6 These results are in line with two other studies that also reported plasma Irisin to be significantly lower in individuals diagnosed with type 2 diabetes mellitus versus nondiabetic controls. 7,8 Taken together, these data indicate a downregulation of Irisin under conditions of impaired glucose control or diabetes mellitus.
Adding more complexity to the regulation of Irisin, a recent study reported that the Irisin levels can be positively associated with insulin resistance in obese subjects. 13 The authors speculated that obesity and metabolic syndrome might cause Irisin resistance similar to those known for insulin and leptin. 13 The divergent results observed in the study described above may be due to the degree of glucose homeostasis impairment (insulin resistance vs. fully developed type 2 diabetes mellitus). 8
Obese patients who followed an 8-week hypocaloric diet to lose weight were re-evaluated 4 or 6 months after treatment. Fifty percent of the patients who regained the lost weight during the follow-up period were categorized as insulin resistant, compared with only 25% of patients who maintained the weight loss. In this study, the plasma levels of the hormones leptin, adiponectin, and Irisin were statistically associated with several risk factors for insulin resistance. Therefore, Irisin could be secreted as an adaptive response to counteract the deleterious effect of excess adiposity on glucose homeostasis. 12 Although previous studies in humans have suggested a correlation between Irisin and the metabolic parameters associated with obesity, the results are inconsistent. 5 –8,14,15
Up to date, the mechanisms by which Irisin may act in the organism and how it is released are not well established. Some studies have already reported the relationship among Irisin and exercises, obesity, insulin resistance, and glucose homeostasis. However, there are no studies demonstrating the effect of diet composition on the FNDC5/Irisin expression. In this context, the aim of the present study is to evaluate the role of diet micronutrients in the expression of FNDC5 and to assess the possible gene interaction network associated with FNDC5/Irisin and diet modulation.
Research Design and Methods
Animals
The experiment was conducted in 28 female FVB/N mice (8 weeks old), from the State University of Montes Claros (Montes Claros, Minas Gerais, Brazil), that were individually housed and placed under a 12-hr light cycle (7:00 a.m.–07:00 p.m.) at a temperature of 25.0°C ± 2.0°C. Food and water were offered ad libitum. After 7 days of the adaptation period, the mice were randomly divided into four groups and fed experimental diets for 60 days (n = 7 per treatment).
This study was approved by the Ethics Committee of Experimentation and Animal Welfare of Unimontes, Montes Claros, Brazil (process number 064/2013) and was conducted in accordance with the guidelines described in the Committee's Guiding Principles Manual.
Diets
The experimental diets were formulated as described in previous studies
16,17
and detailed in Table 1. The experimental groups were set as follows: high-carbohydrate diet (HCD) (RH29578; Rhoster®), high-fat diet (HFD) (RH195104; Rhoster), and high-protein diet (HPD) (RH19563; Rhoster). The diet compositions were as follows: HCD: cornstarch (46.87%), casein (13.70%), dextrinized starch (15.5%), sucrose (10%), soybean oil (4%), cellulose fiber (5%), mineral mix AIN-93M (3.5%), vitamin mix AIN-93 (1%),
Experimental diets offered to the animals during the experiment period.
HCD, high-carbohydrate diet; HFD, high-fat diet; HPD, high-protein diet; SD, standard diet.
The measurements of body weight, food intake, and tissue collection
Body weight and food intake were measured thrice per week during the treatment period in order to obtain food efficiency (food intake/body weight). At the end of the treatment period, overnight fasted mice were sacrificed by decapitation with a guillotine, and blood samples were collected. In addition, samples of soleus muscle and white and brown adipose tissues were collected, weighed, immediately frozen in liquid nitrogen, and stored at −80°C for subsequent analysis.
Glucose tolerance and insulin sensitivity test
At the end of the experiment, insulin sensitivity and glucose tolerance tests were performed. For the insulin sensitivity test, overnight fed mice, had their blood glucose levels monitored at time points 0, 15, 30, and 60 min, after intraperitoneal injection of insulin (0.75 U/kg body weight; Sigma, St Louis, MO). For the glucose tolerance test,
Determination of plasma parameters
Blood samples were centrifuged (3200 rpm for 10 min at 4°C), and the plasma was separated for determination of total cholesterol, lipoprotein cholesterol HDL, and triglycerides using enzymatic tests (Wiener Lab., Argentina) and the Wiener lab BT3000 analyzer.
Reverse transcription and quantitative real time-polymerase chain reaction
Total RNA from the soleus muscle was prepared using TRIzol reagent (Invitrogen Corp., San Diego, CA) treated with DNAse and reverse transcribed with MMLV (Invitrogen Corp.) using random hexamer primers. The levels of the genes of interest were determined by real-time quantitative polymerase chain reaction using the SYBR Green reagent (Applied Biosystems) in a StepOnePlus equipment (Applied Biosystems-EUA). Gene expression was normalized to endogenous GAPDH FW:5′AACGACCCCTTCA TTGACCTC3′; RV: 5′CTTCCCATTCTCAGCCTTGACT3′). The genes of interest and respective primers were as follows: FNDC5 (FW: 5′GGACTCTTGGAAAACACCACTG′; RV: 5′TCCACACAGATGATCTCACCAC′). Gene expression was quantified using the relative comparative Ct (threshold cycle) method.
Western blot analysis
Proteins were extracted from the soleus muscle samples of 16 mice and 50 μg of protein was resolved on SDS-PAGE gels (10%) and then transferred onto nitrocellulose membranes and blocked with Odyssey Blocking Buffer 1× (LI-COR Biosciences®, Germany). The Irisin (Cell Signaling Technology) and β-actin (internal control) (Cell Signaling Technology) were probed with a polyclonal rabbit antibody (1:1000). Goat anti-rabbit IgG IRDye® 800 (1:15,000) (LI-COR) was used as a secondary antibody. The blots were visualized using the Odyssey Infrared Imaging System Scan where the blots (and gels) were imaged at 169 μm. The results were expressed by a ratio between primary antibody and β-actin in units of relative density. Quantification was performed on single channels with the analysis software provided as previously described. 18
Bioinformatics and interaction network analysis
The leader gene approach was described previously, 19,20 and the level of confidence (0.9) was considered. The Web-available software STRING (version 9.05) was used to expand the network obtained after the gene FNDC5 was searched. For the construction of the interaction map among the identified genes, each interaction obtained was then scored in the aforementioned software. The K-means Cluster Analysis, analysis of variance (ANOVA), and Tukey post hoc tests were applied in order to assess the differences among classes in terms of WNL. The relationship between WNL and TIS was evaluated by plotting the results in a scatterplot graph. Statistical significance was a P value <0.05. The interacting genes were classified according to the interaction degree presented. Cytoscape 19 was used for topological analysis and BiNGO for the ontological analysis. 21,22
Statistical analysis
All data were transferred to GraphPad Prism software (Version 5.0; GraphPad Software, Inc., San Diego, CA). Data on insulin sensitivity and glucose tolerance were evaluated by two-way ANOVA; the other parameters were analyzed by one-way ANOVA followed by the Bonferroni post-test. Statistical significance was accepted at P < 0.01 and 0.05. All data are given as mean ± SE.
Results
Diets and body composition
The food intake, energy intake, and body weight, measured throughout the treatment period in order to assess the food efficiency of the different diets, were not shown to be statistically different between groups at the end of the treatment period (Fig. 1A, B, and C).
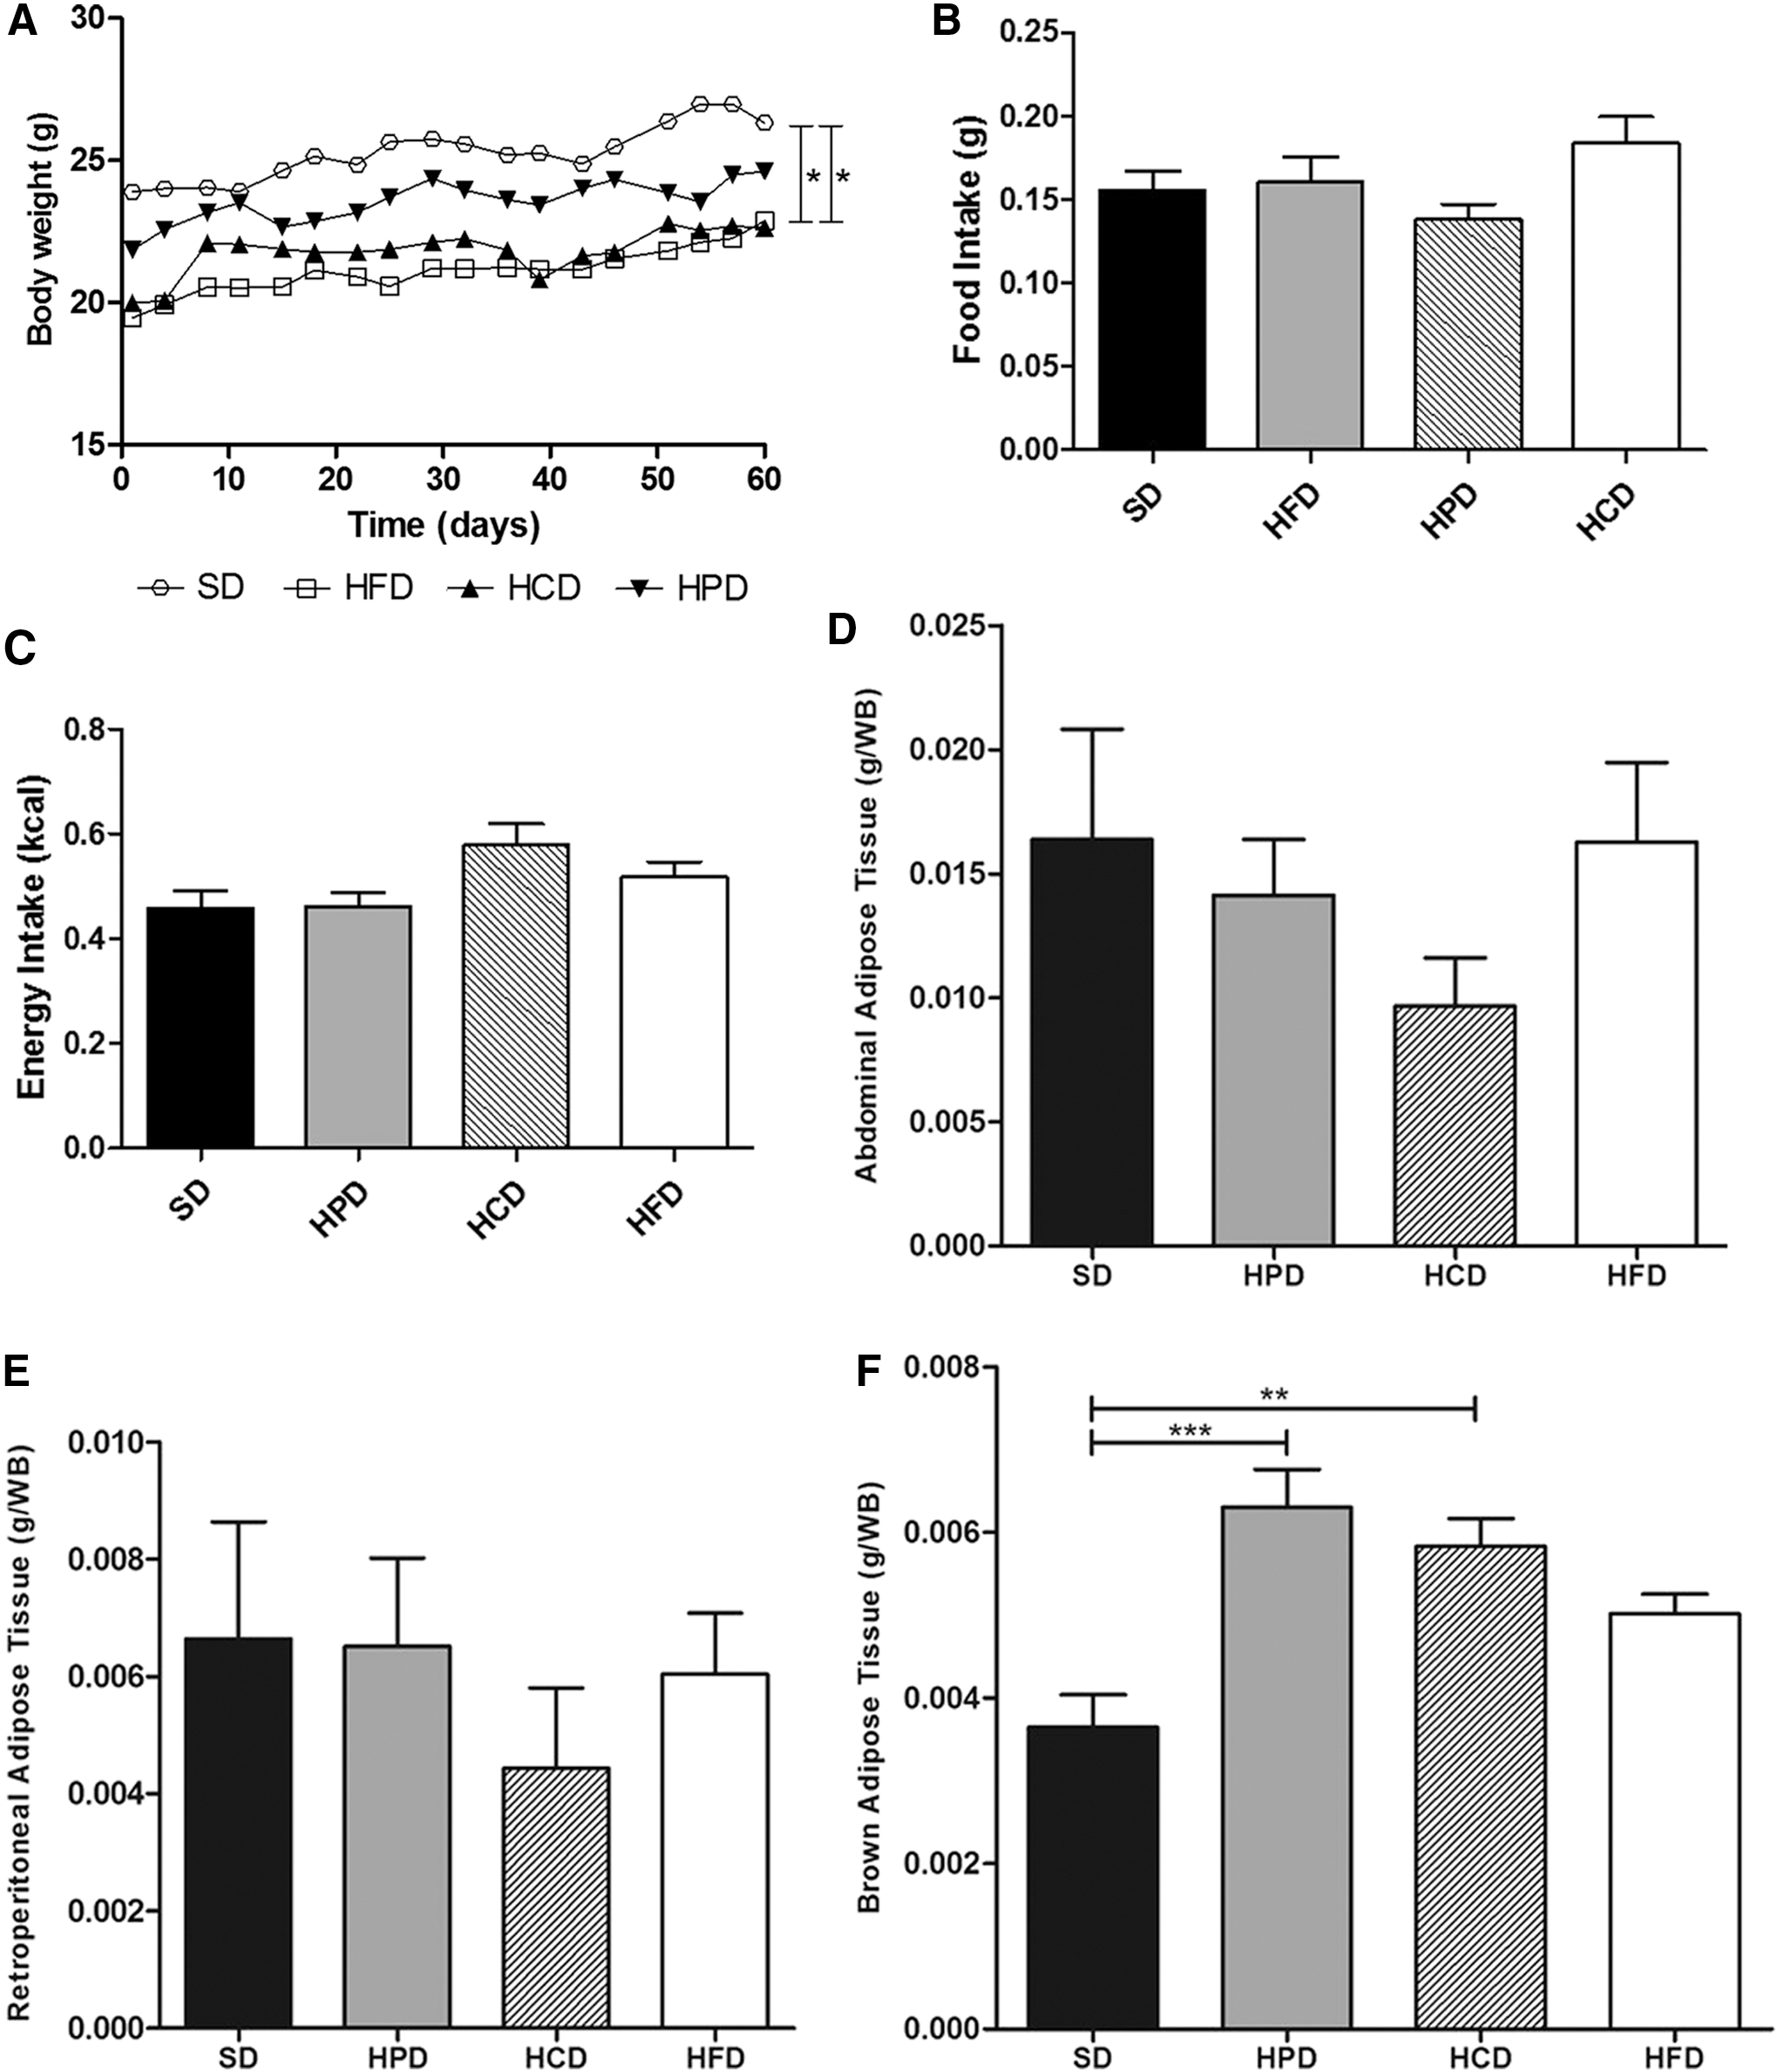
Body weight, food intake, energy intake, and adipose tissues of mice fed a SD, HPD, HCD, and HFD.
The analysis of the abdominal and retroperitoneal adipose tissue weight displayed no statistically significant differences among groups (SD: 0.016 ± 0.009; HPD: 0.01 ± 0.005; HCD: 0.009 ± 0.004; HFD: 0.01 ± 0.008) and (SD: 0.006 ± 0.004; HPD: 0.006 ± 0.003; HDC: 0.006 ± 0.002; HFD: 0.004 ± 0.003) respectively (Fig. 1D, E). However, both HPD and HCD mice showed a substantial increase in brown adipose tissue weight compared to SD mice (SD: 0.0036 ± 0.0007; HPD: 0.0063 ± 0.001; HCD: 0.0058 ± 0.0008; HFD: 0.0050 ± 0.0005) (Fig. 1F).
Diets and blood parameters
The biochemical analysis showed that HDL levels were only statistically different between the HPD and HCD groups, where higher levels of HDL were observed in HCD fed animals (Fig. 2A). The total cholesterol did not differ among groups (Fig. 2B). Regarding the glycemic parameters, the glucose tolerance test evidenced a significant difference at the time point of 15 min between HFD and HPD compared to ST (Fig. 3A), with increased plasma glucose levels for HFD and HPD fed animals. In contrast, the insulin sensitivity test did not show significant differences in the plasma glucose levels among groups (Fig. 3B).

The blood parameters of mice fed a SD, HPD, HCD, and HFD.

GTT and IST in mice fed with a SD, HFD, HPD, and HCD.
Diets and FNDC5 expression
It was observed that HCD and HFD mice presented a substantial decrease in the expression levels of FNDC5 compared to SD mice (SD: 1.000 ± 0.008; HPD: 0.7405 ± 0.217; HCD: 0.0058 ± 0.205; HFD: 0.4238 ± 0.179). However, the HPD mice did not follow the same pattern (Fig. 4A). In order to verify the expression levels of the FNDC5 cleavage product, Irisin, we performed western blot using an antibody specific to bind the Irisin protein, where a statistically significant increase in the Irisin levels of the HPD group compared to the HCD and HFD groups could be observed (Fig. 4B). The gels and membranes from the western blot analysis are given in the Supplementary Fig. S1; Supplementary Data are available online at
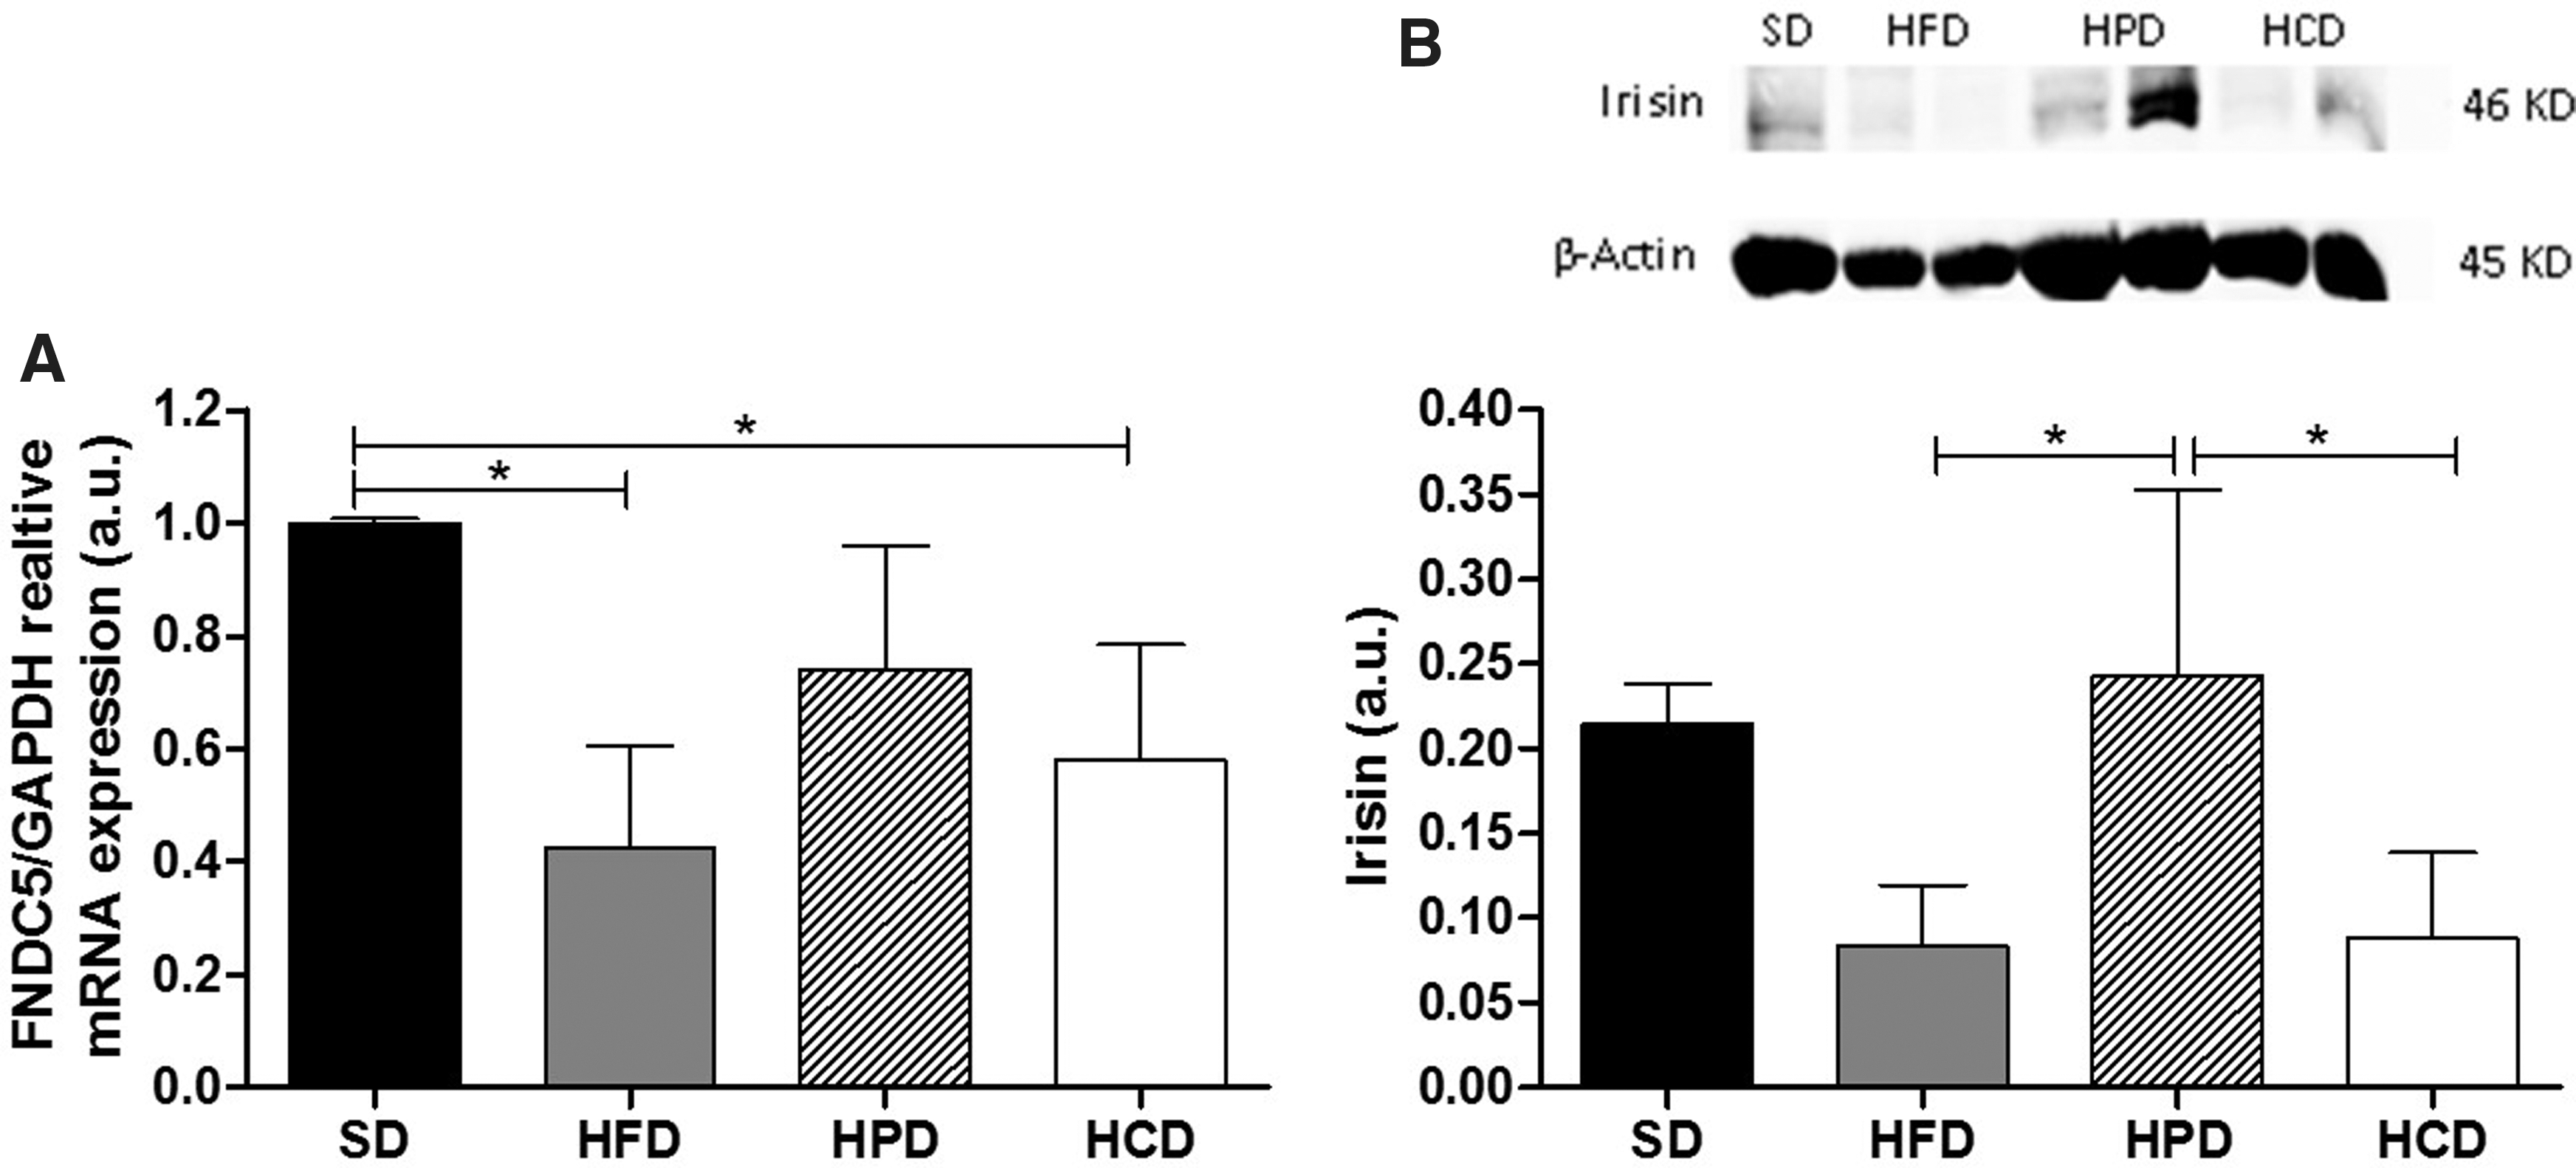
Analysis of the mRNA expression of FNDC5 by qRT-PCR and protein expression of Irisin by western blotting the soleus muscle of mice fed a STD, HFD, HPD, and HCD.
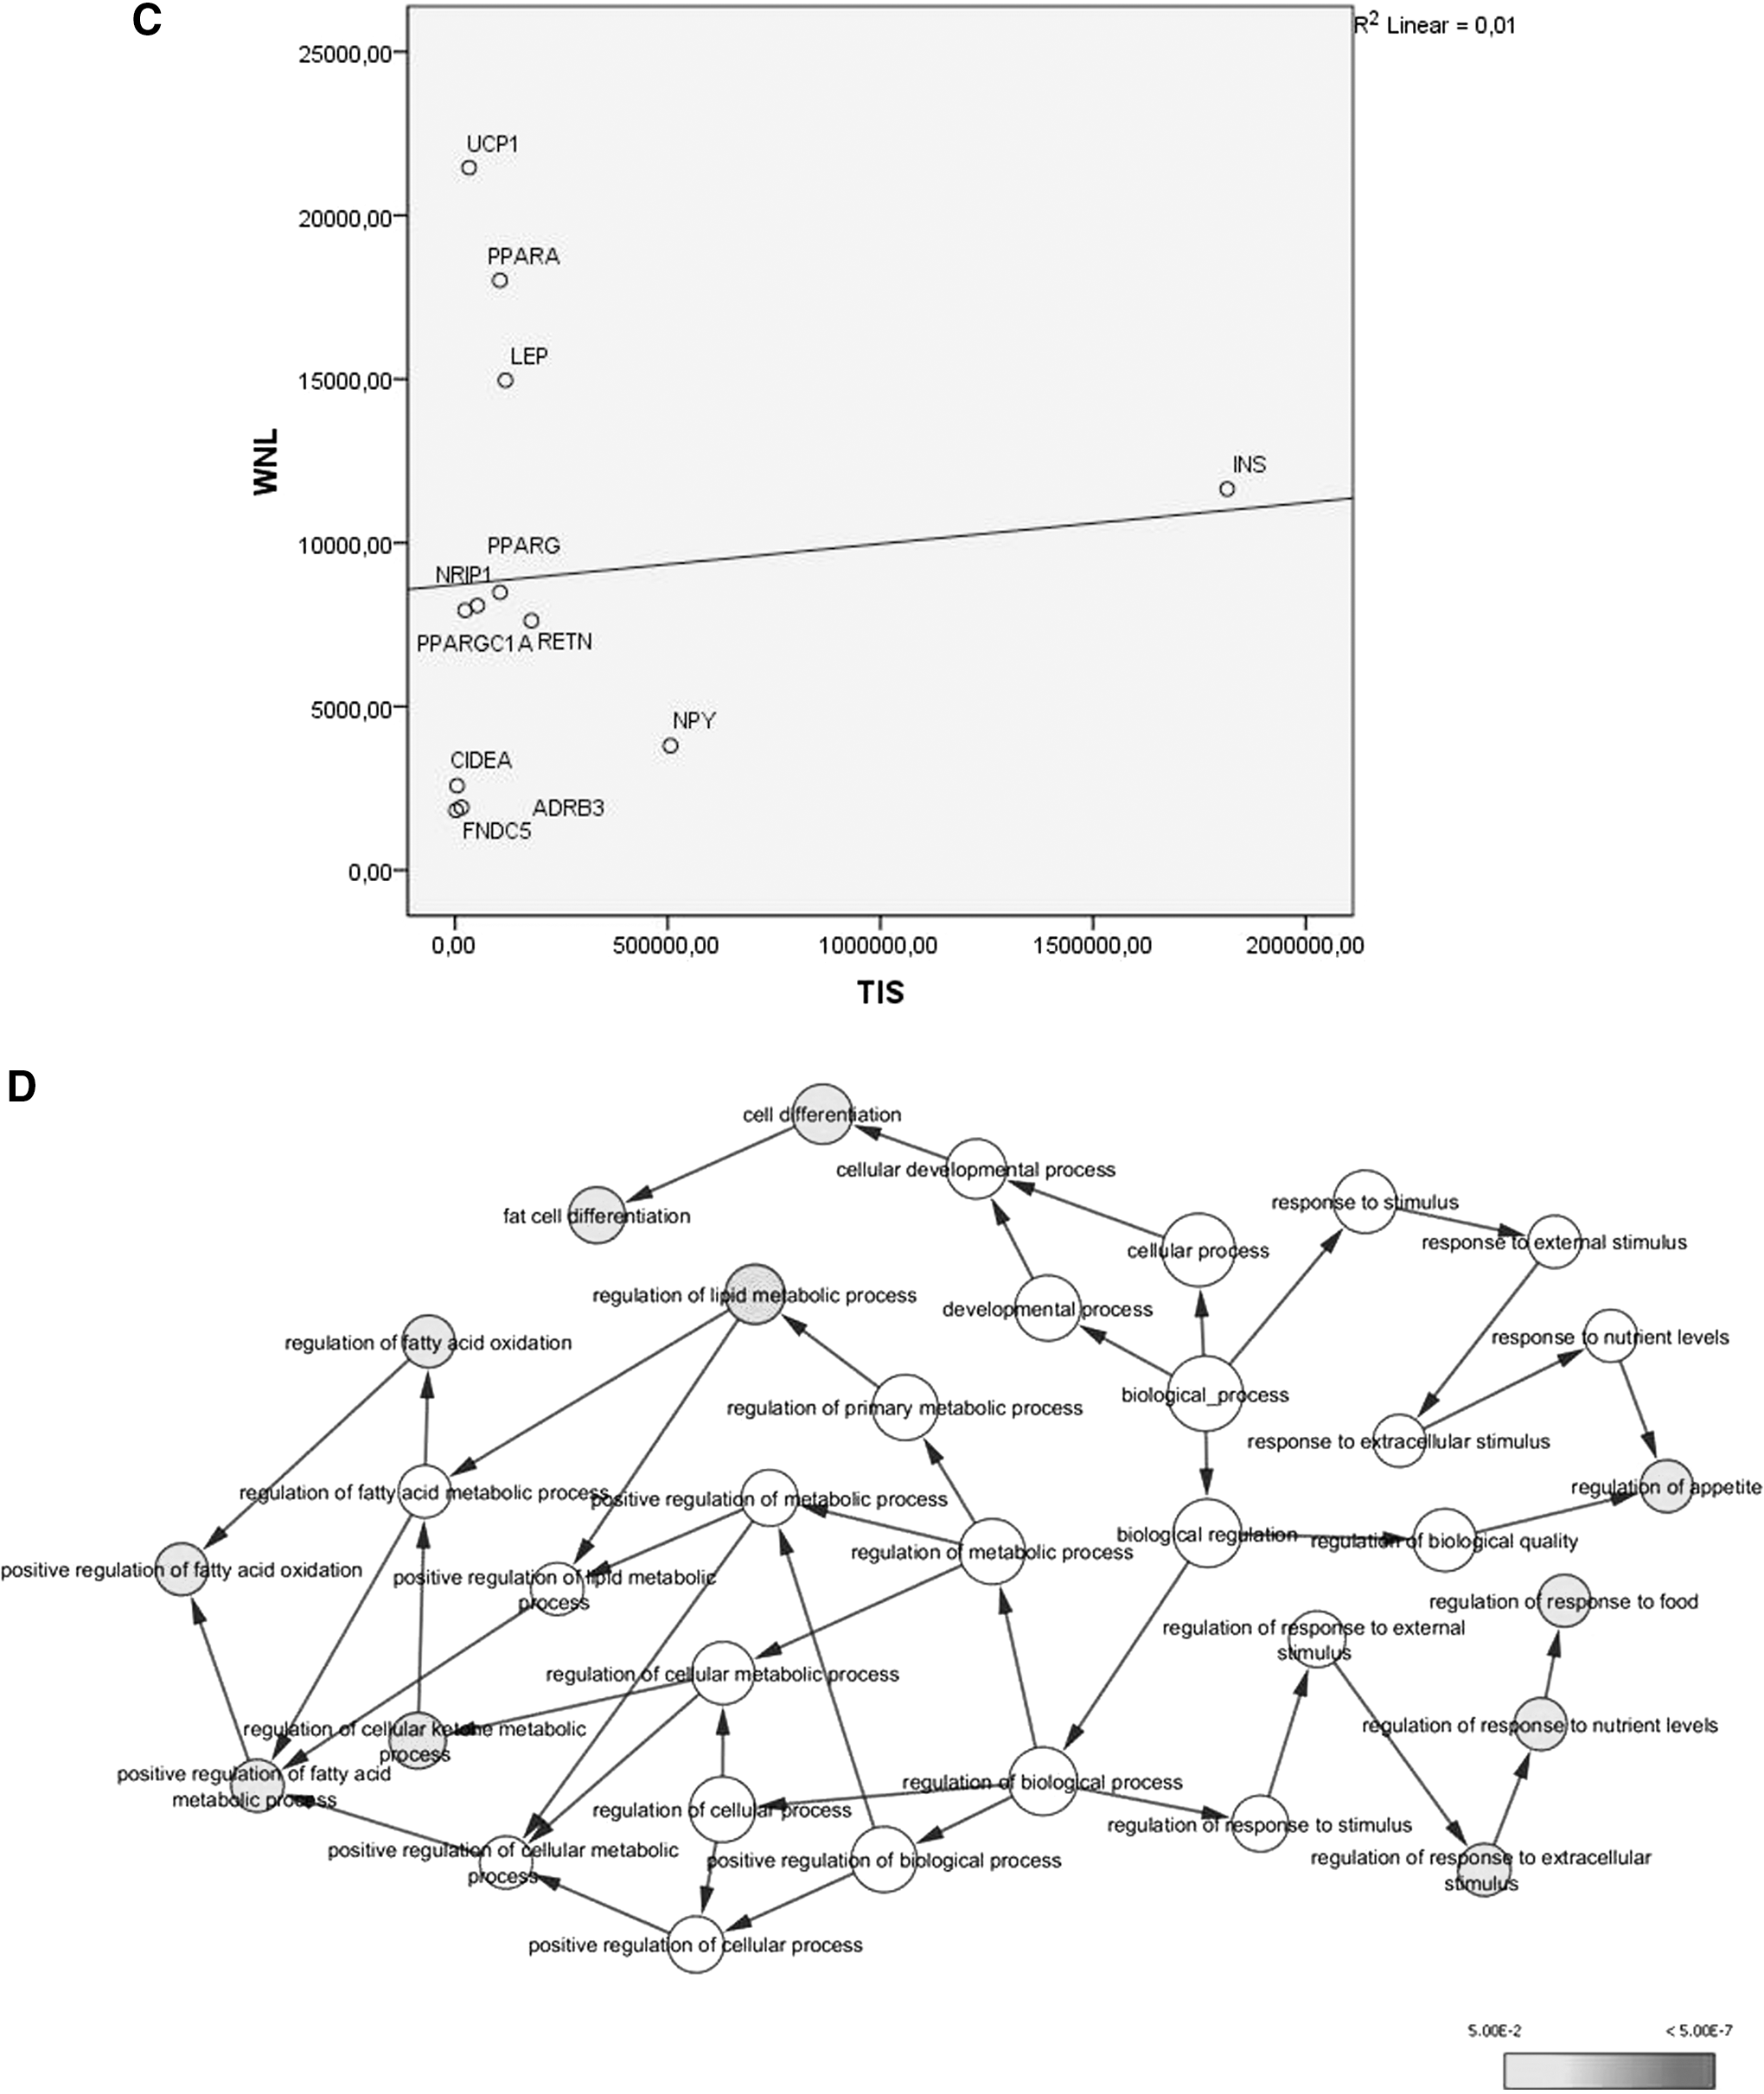
Bioinformatics and interaction networks suggest that the expression levels of Irisin and FNDC5 are modulated by the genes UCP1 and PPARa
The query performed in GeneCards suggested six genes that, after an expansion in the software STRING, were all included in the final network (Fig. 5A). The leader genes were UCP1 and PPARα (Fig. 5C). The difference in WNL and TIS scores between the leader gene was confirmed by ANOVA with Tukey post hoc test (p < 0.05). The final network exhibits a power law behavior of 0.961 and R 2 of 0.934 (Fig. 5B). The ontological analysis demonstrated different mechanisms associated with the levels of Irisin (Fig. 5D).
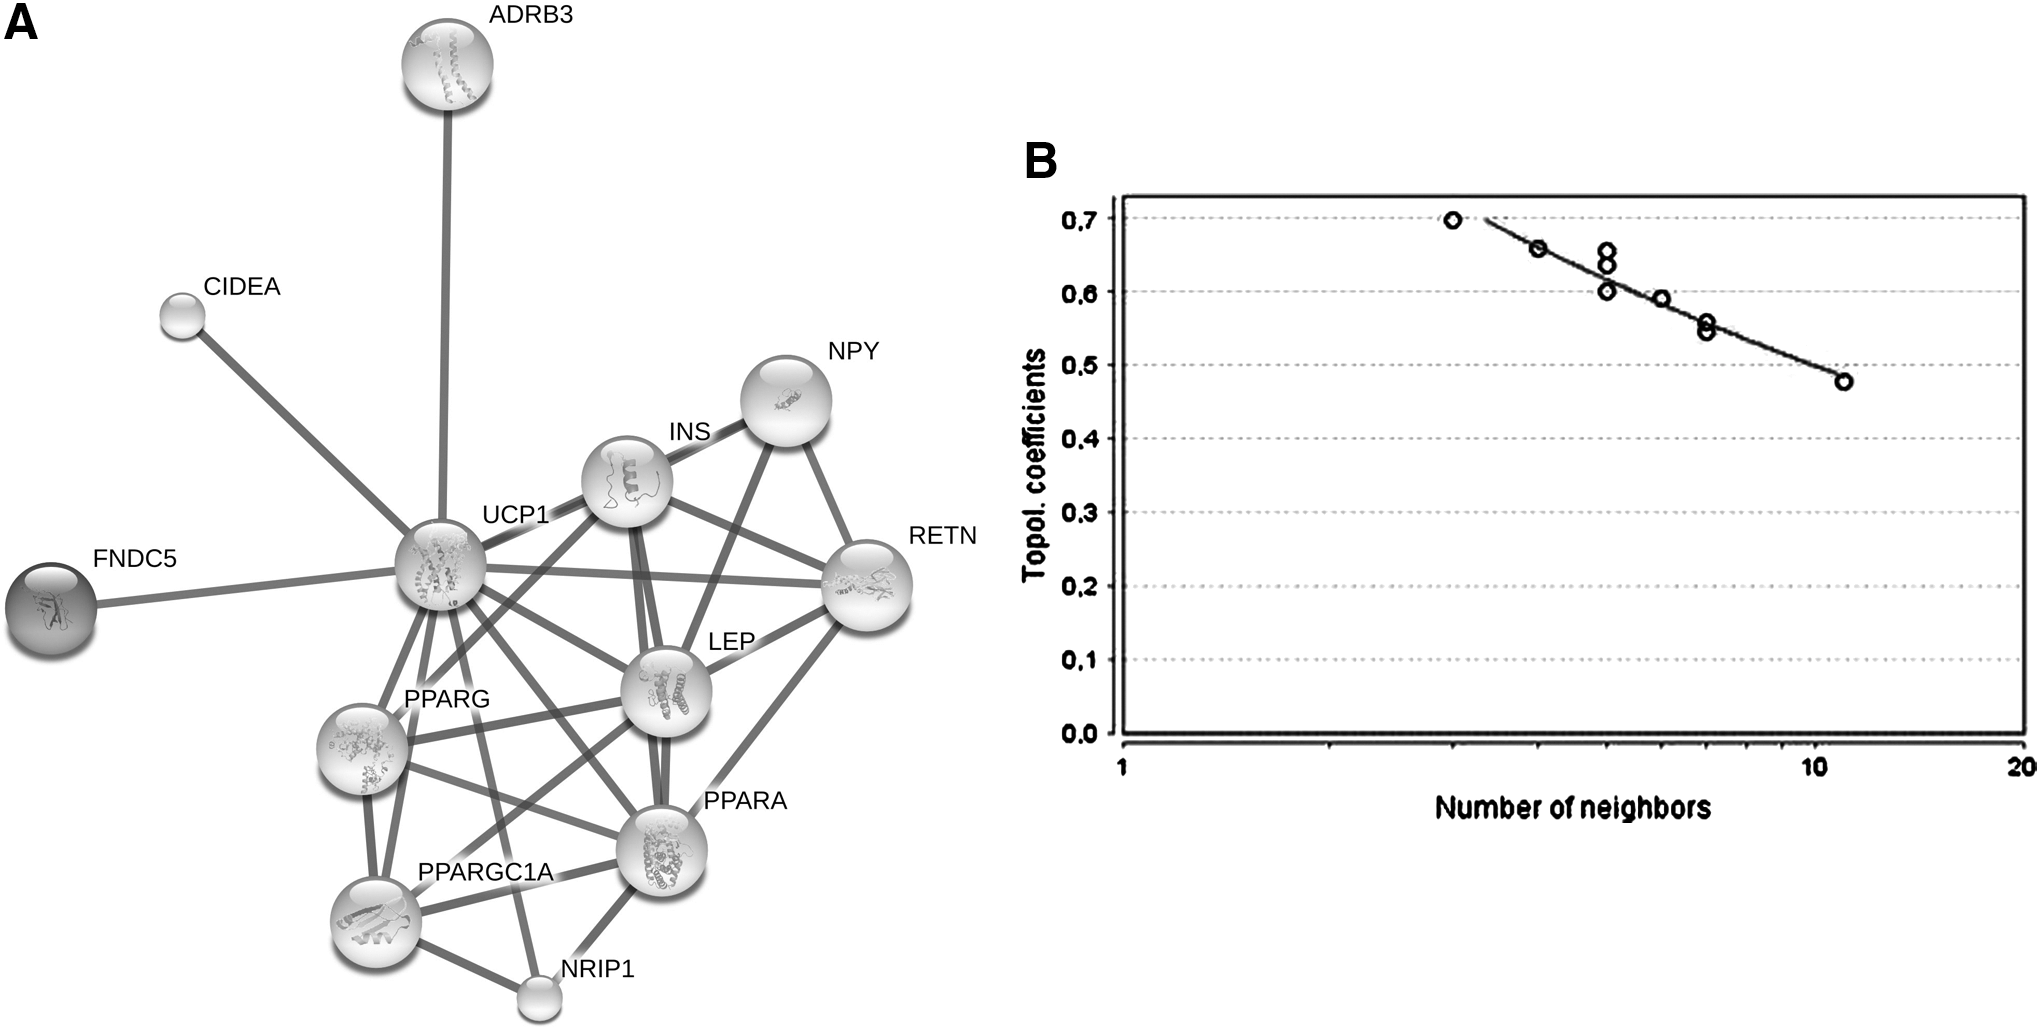
Bioinformatics and interaction network analysis.
Discussion
In the present study, we evaluated the effects of different diets (high carbohydrate, high fat, and high protein) on glycemic and lipid profiles, as well as on the expression of FNDC5 and Irisin in the soleus muscle of mice. The main findings showed that HFDs and HCDs promote decreased expression of FNDC5/Irisin compared to high protein and SDs, although no differences were observed for total cholesterol and HDL levels.
The body weight, food efficiency, and the weight of the abdominal and retroperitoneal adipose tissues were shown to be not statistically different among groups. The lack of difference among these parameters may be due to the similar caloric content of the different diets applied and to the short-term design of this study. However, an increase in the weight of the brown adipose tissue was observed in the HPD and HCD groups. This increase in brown adipose tissue weight, although we may not infer an increase in thermogenesis directly, is in accordance with previous studies that correlate HPDs and HCDs with increased energy expenditure due to thermogenesis. 23 –25 However, the HPDs seem to be more effective in promoting weight loss, energy expenditure, and diet-induced thermogenesis, over a HCD or HFD. 26
In addition, another important study demonstrated that recombinant Irisin increases the expression of thermogenic markers in vivo and in vitro not only in brown adipose tissue but also in white adipocytes, thus confirming the correlation of Irisin levels and thermogenesis and, consequently, energy expenditure. 27 These findings were corroborated by our bioinformatics analysis that presented UCP1 and PPARα as leader genes and heightens the possible association between FNDC5/Irisin and thermogenesis. Both genes (UCP1 and PPARα) are central regulators of thermogenesis, 28,29 which is discussed as a target for the treatment of obesity, as it is considered a process that promotes energy expenditure by heat generation.
The total cholesterol levels were not statistically significantly different among groups, although the HDL levels were shown to be higher in the HCD group compared to the HPD group. This finding is not in accordance with human studies that show a positive effect of HPDs on HDL levels, in contrast with HCDs that seem to impair lipid metabolism. 30,31 The higher levels of HDL, a fraction counted for total cholesterol levels, in the HCD fed animals may be explained by the tendency of increased levels of total cholesterol in these same animals.
Regarding the soleus muscle mRNA and protein expression levels of FNDC5 and Irisin, respectively, we observed a downregulation of these markers in the HCD and HFD fed animals compared to the HPD fed group, which was able to maintain normal levels of FNDC5 and Irisin compared to SD. These data are in accordance with studies that show a positive correlation between the expression of FNDC5 and Irisin. As we evaluated the FNDC5 expression in the soleus muscle, this may be associated with the amount of muscle tissue present in individuals fed a HPD. 32 Furthermore, HPDs promote loss of body fat, but preserve the skeletal muscle anabolic sensitivity to protein-containing meals during energy deficit.
Furthermore, some studies showed a positive correlation of Irisin, fat-free mass, and BMI. 6,7,13,14,33 Our results indicate the possibility that the FNDC5\Irisin expression is more correlated with the protein availability in the body, as with muscle mass, as no decrease was observed in HPD fed animals. A study that assessed circulating Irisin levels over a broad spectrum of body weight in 40 patients with anorexia nervosa, normal weight controls, and several levels of obese patients showed a correlation of Irisin with body weight. Obese patients showed higher circulating Irisin levels compared to normal weight and anorexic patients. Insulin levels were also positively correlated with Irisin. The authors suggest that an increase in Irisin under conditions of obesity may indicate a physiological function to improve glucose tolerance, which is often impaired in obese subjects. 14
It is well established that exercise and fat-free mass are important for health maintenance. Irisin, the cleavage product of FNDC5 gene, is known to play an important role in this beneficial correlation. High levels of this protein are already positively associated with age, BMI, lipid and glycemic profile, and diastolic blood pressure, 34,35 in contrast with decreased levels of this protein that are found in type 2 diabetes. 8,13 The circulating levels of Irisin are found to be directly associated with the muscle mass, corroborating with our findings that show higher levels of Irisin in HPD fed animals. 35
However, it is worth mentioning that our study did not assess the expression of Irisin in other organs. A recent study published by Varela-Rodríguez et al. pointed to the differences between the central and peripheral FNDC5/Irisin expression. 36 The authors showed that hypothalamic expression of FNDC5 was not altered by different diets, thus suggesting another modulation mechanism for this pathway. In this sense, other studies aiming to investigate the functions and pathways by which the FNDC5/Irisin pathway is activated and modulated are encouraged.
In conclusion, Irisin, although more studies are still needed, seems to be a potential candidate for obesity therapy. In this study, the main findings showed that a diet rich in proteins appears to be effective in maintaining the normal Irisin levels. Further studies aiming to elucidate the pathways involved in the HPDs' modulation of Irisin expression levels are encouraged.
Footnotes
Acknowledgments
This work was partially supported by grants from Coordenadoria de Aperfeiçoamento do Pessoal de Nível Superior (CAPES—Brazil), Conselho Nacional de Desenvolvimento Científico e Tecnológico (CNPq—Brazil), and Fundação de Amparo à Pesquisa de Minas Gerais (FAPEMIG—Brazil).
Author Disclosure Statement
No competing financial interests exist.
References
Supplementary Material
Please find the following supplemental material available below.
For Open Access articles published under a Creative Commons License, all supplemental material carries the same license as the article it is associated with.
For non-Open Access articles published, all supplemental material carries a non-exclusive license, and permission requests for re-use of supplemental material or any part of supplemental material shall be sent directly to the copyright owner as specified in the copyright notice associated with the article.