




Abstract
Background:
The prevalence of metabolic syndrome (MetS) generally rises with increasing adiposity, but tends to plateau at the highest levels of body mass index (BMI) with some individuals, even with severe obesity, expressing few or no components of MetS. We examined factors associated with the expression of MetS in severely obese women participating in a large observational study.
Methods:
Anthropometrics, including Heath equation-adjusted bioimpedance-determined fat-free mass (FFM) and fat mass (FM), lipids and related laboratory measurements, resting energy expenditure (REE), and respiratory quotient (RQ), were studied in 949 women with severe obesity.
Results:
Even though the mean BMI was 45.7 kg/m2 and all participants met MetS criteria for increased waist circumference, 30% of subjects did not have MetS. Unadjusted FM (P = 0.0011), FFM (P < 0.0001), and REE (P < 0.0001) were greater in the women with MetS. Surprisingly, in multivariate logistic regression FFM was positively associated with MetS (P = 0.0002), while FM was not (P = 0.89). Moreover, FFM, not FM, was significantly associated with all five components of MetS except for triglyceride levels. REE and RQ were higher in those with MetS, and REE was strongly associated with multiple components of MetS.
Conclusions:
In women with severe obesity, higher FFM and REE were paradoxically associated with increased rather than decreased risk of MetS, while FFM-adjusted FM was unrelated to MetS.
Introduction
M
Why some subjects with obesity express MetS and others do not is poorly understood. High respiratory quotient (RQ) (higher ratio of carbohydrate to fat oxidation or relatively lower fat oxidation) was associated with greater weight gain in one study. 6 Low 24-hr adjusted resting energy expenditure (REE) predicted the subsequent development of obesity or its metabolic complications, including MetS and diabetes, in some studies, 6,7 but not others. 8 In addition, after weight gain, the greater fat mass (FM) may lead to lower RQ and higher REE. 6 Thus, the influence of these variables may change over time. Interestingly, fasting hyperglycemia in persons with type 2 diabetes predicted less weight gain over time and was associated with greater energy expenditure and lower RQ, apparently due to increased gluconeogenesis. 9 Among severely obese subjects, greater FM was recently reported to be inversely associated with elements of MetS, especially among women. 10 In another study among morbidly obese subjects, increased liver fat more strongly predicted MetS than visceral fat area. 11
To provide insights into potential etiologic differences between those with and without MetS among severely obese women, we utilized extensive anthropometric and metabolic data gathered during a baseline visit of 949 women with severe obesity in the Utah Obesity Study, 12 to examine what factors were associated with expression of MetS, its components, and related traits.
Materials and Methods
The Utah Obesity Study recruited 1156 subjects with severe obesity who initially qualified for gastric bypass surgery by having either a BMI > 40 kg/m2 or a BMI ≥ 35 kg/m2 with significant obesity-related co-morbidities. Detailed descriptions of the recruitment methods and measurements have been published previously. 12 For this analysis, we focused on the 949 female participants in the study. All the women were Caucasian. All measurements included in this analysis were obtained before bariatric surgery. Subjects were not following any prescribed diet or exercise program in relation to subsequent surgery or as part of this study. All were asked to complete medical and lifestyle questionnaires, including the Willett Food Frequency Questionnaire (Boston, MA). Most of the subjects underwent in-hospital testing that included indirect calorimetry and a limited screening sleep study (without electroencephalography monitoring) using the Embletta Portable Diagnostic System (Flaga, Reykjavik, Iceland). For purposes of this report, obstructive sleep apnea was considered present if the respiratory distress index (number of obstructive apneas, hypopneas, and respiratory event-related arousals) was 15 per hour or greater.
MetS was considered present if three or more of the following five components were present according to internationally accepted criteria for Caucasian women
1
: (1) Waist ≥88 cm (this component was present in all the women studied) (2) HDL-C <50 mg/dL (3) Triglycerides ≥150 mg/dL or taking a fibrate medication (4) Systolic blood pressure ≥130 mmHg and/or diastolic blood pressure ≥85 mmHg, or taking an antihypertensive medication (5) Fasting serum glucose ≥100 mg/dL or on drug treatment for elevated glucose
Weight was measured with a Scaletronix Scale (Model 5100), which has a 363 kg (800 pound) weight capacity and reads to the nearest 0.1 kg. Height was measured using a calibrated stadiometer. Body circumferences were measured with fiberglass tape. Waist was measured at the navel; hips at the largest circumference over the buttocks.
Percent FM (%FM) was determined by bioelectrical impedance analysis (BIA) (RJL Systems Analyzer, Quantum II, Clinton, MI) using the following equation developed specifically for women with severe obesity, utilizing hydrostatic weighing as the reference method.
13
Fat-free mass (FFM) and FM were derived from the BIA-determined %FM and the total weight in kilograms. To correct for the effect of height on FM and FFM, FFM index (FFMI, FFM/height2 in kg/m2) and FM index (FMI, FM/height2 in kg/m2) were calculated from FFM and FM derived from the BIA-determined %FM and divided by the height squared. Thus, the sum of FFMI and FMI was equal to BMI.
Steady-state CO2 production (VCO2 in mL CO2/min) and O2 consumption (VO2 in mL O2/min) were measured by open-circuit indirect calorimetry using a portable metabolic cart (Trueone 2400; Parvomedics, Sandy, UT), with subjects in a supine position shortly after awakening in the morning after an overnight stay in the hospital without adjustment for urinary nitrogen excretion. Approximately, 74% of the study participants completed respirometry studies at baseline.
12
The RQ was calculated as VCO2/VO2. Values of RQ may be seen as low as 0.67 corresponding to pure ethanol oxidation; an RQ of 0.70 suggests pure fat oxidation, 1.0 suggests pure carbohydrate oxidation, and an RQ over 1.0 is indicative of net fat synthesis or oxidation of certain organic acids. However, because our subjects were fasting, we excluded data from indirect calorimetry studies with values of RQ outside the range of 0.70 to 1.00 as suggested.
14
The 24-hr adjusted REE was calculated using the abbreviated Weir equation:
Measurements of VO2 and VCO2 were obtained for 1-min intervals over a period of 15–30 min. The mean was then used to determine the 24-hr adjusted REE.
Blood pressure was measured using automatic blood pressure equipment (Dinamap, Critikon, Tampa, FL) after measuring the upper arm to determine the proper cuff size. Following a 10-hr overnight fast, venous blood was obtained for standard chemistry and electrolytes (specimens analyzed by ARUP Laboratories, Salt Lake City, UT) and a lipid panel performed in our laboratory by a microscale ultracentrifugation method. 15
Statistical methods
SAS Version 9.3 (Carey, North Carolina) was used for all statistical analyses. Means of continuous variables in women with and without MetS in single-variable descriptive analyses were compared using Student's t-test. Chi-squared tests were used to compare categorical variables. Variables with skewed distributions, including triglyceride, glucose, hemoglobin A1c, insulin, homeostasis model assessment of insulin resistance (HOMA-IR), and gamma-glutamyl transpeptidase (GGTP), were log-transformed for all analyses and comparisons and antilog of the mean log values are reported in Table 1 (rather than presenting the median values). Simple Pearson correlation coefficients and partial correlation coefficients adjusted for age and height were used to examine associations between continuous variables. Analysis of covariance was performed using SAS PROC GLM. Linear stepwise regression was performed with SAS PROC REG, while logistic regression utilized PROC LOGISTIC. All significance tests were two sided. No attempt was made to adjust glucose levels for use of hypoglycemic drugs or lipids for use of lipid-lowering drugs
Available number of observations without and with MetS if different than total N.
BMI, body mass index; BSA, body surface area; GGTP, gamma-glutamyl transpeptidase; HDL-C, high-density lipoprotein cholesterol; HOMA-IR, homeostasis model assessment of insulin resistance; LDL-C, low-density lipoprotein cholesterol; MetS, metabolic syndrome; REE, resting energy expenditure; RQ, respiratory quotient; SD, standard deviation; WHR, waist–hip ratio; VLDL-C, very low density lipoprotein cholesterol.
Results
Despite having a strikingly elevated mean BMI of 45.7 kg/m2 and all the women having at least one component of MetS (waist ≥88 cm), 283 (30%) of the 949 women in our cohort did not have MetS. While a substantial number of women in our study were postmenopausal (37%), menopause was not associated with the presence or absence of MetS after adjustment for age in logistic regression. Among diabetics, 82% were taking hypoglycemic medication with just three of these on insulin. Similarly, among hypertensive subjects, 69% were taking blood pressure-lowering medication. Co-morbidities, including reported history of CAD, hypothyroidism, depression, or acid reflux, were not different by MetS, nor was a measured index of sleep apnea or reported lifestyle factors (including macronutrient intakes or habitual exercise levels). Weight, BMI, FM, FMI, FFM, and FFMI were all higher in women with MetS compared to those without MetS in univariate comparisons (Table 1). Intriguingly, however, the differences in total weight, FFM, and FFMI appeared to be more significant than for BMI, FM, and FMI. Higher REE was also strongly associated with MetS.
We therefore explored independent contributions of FM and FFM to MetS using multiple logistic regression analysis with MetS as the dependent variable. We examined a model with FFMI, FMI, and age, as well as a model that included FFM, FM, age, and height. Surprisingly, in the model that included age (β = 0.030, SE 0.0065, standardized β = 0.190, P < 0.0001), FFMI, and FMI, we found that a higher FFMI was significantly associated with an increased risk of MetS (β = 0.157, SE 0.044, standardized β = 0.206, P = 0.0004), while FMI was not (β = −0.005, SE 0.019, standardized β = −0.015, P = 0.79) (Fig. 1). Similarly, higher FFM was associated with an increased risk of MetS (β = 0.061, SE 0.016, standardized β = 0.254, P = 0.0002) in the model adjusting for age and height, but FM was not significantly associated with MetS (β = −0.0010, SE 0.0071, standardized β = −0.008, P = 0.89) (Fig. 2).
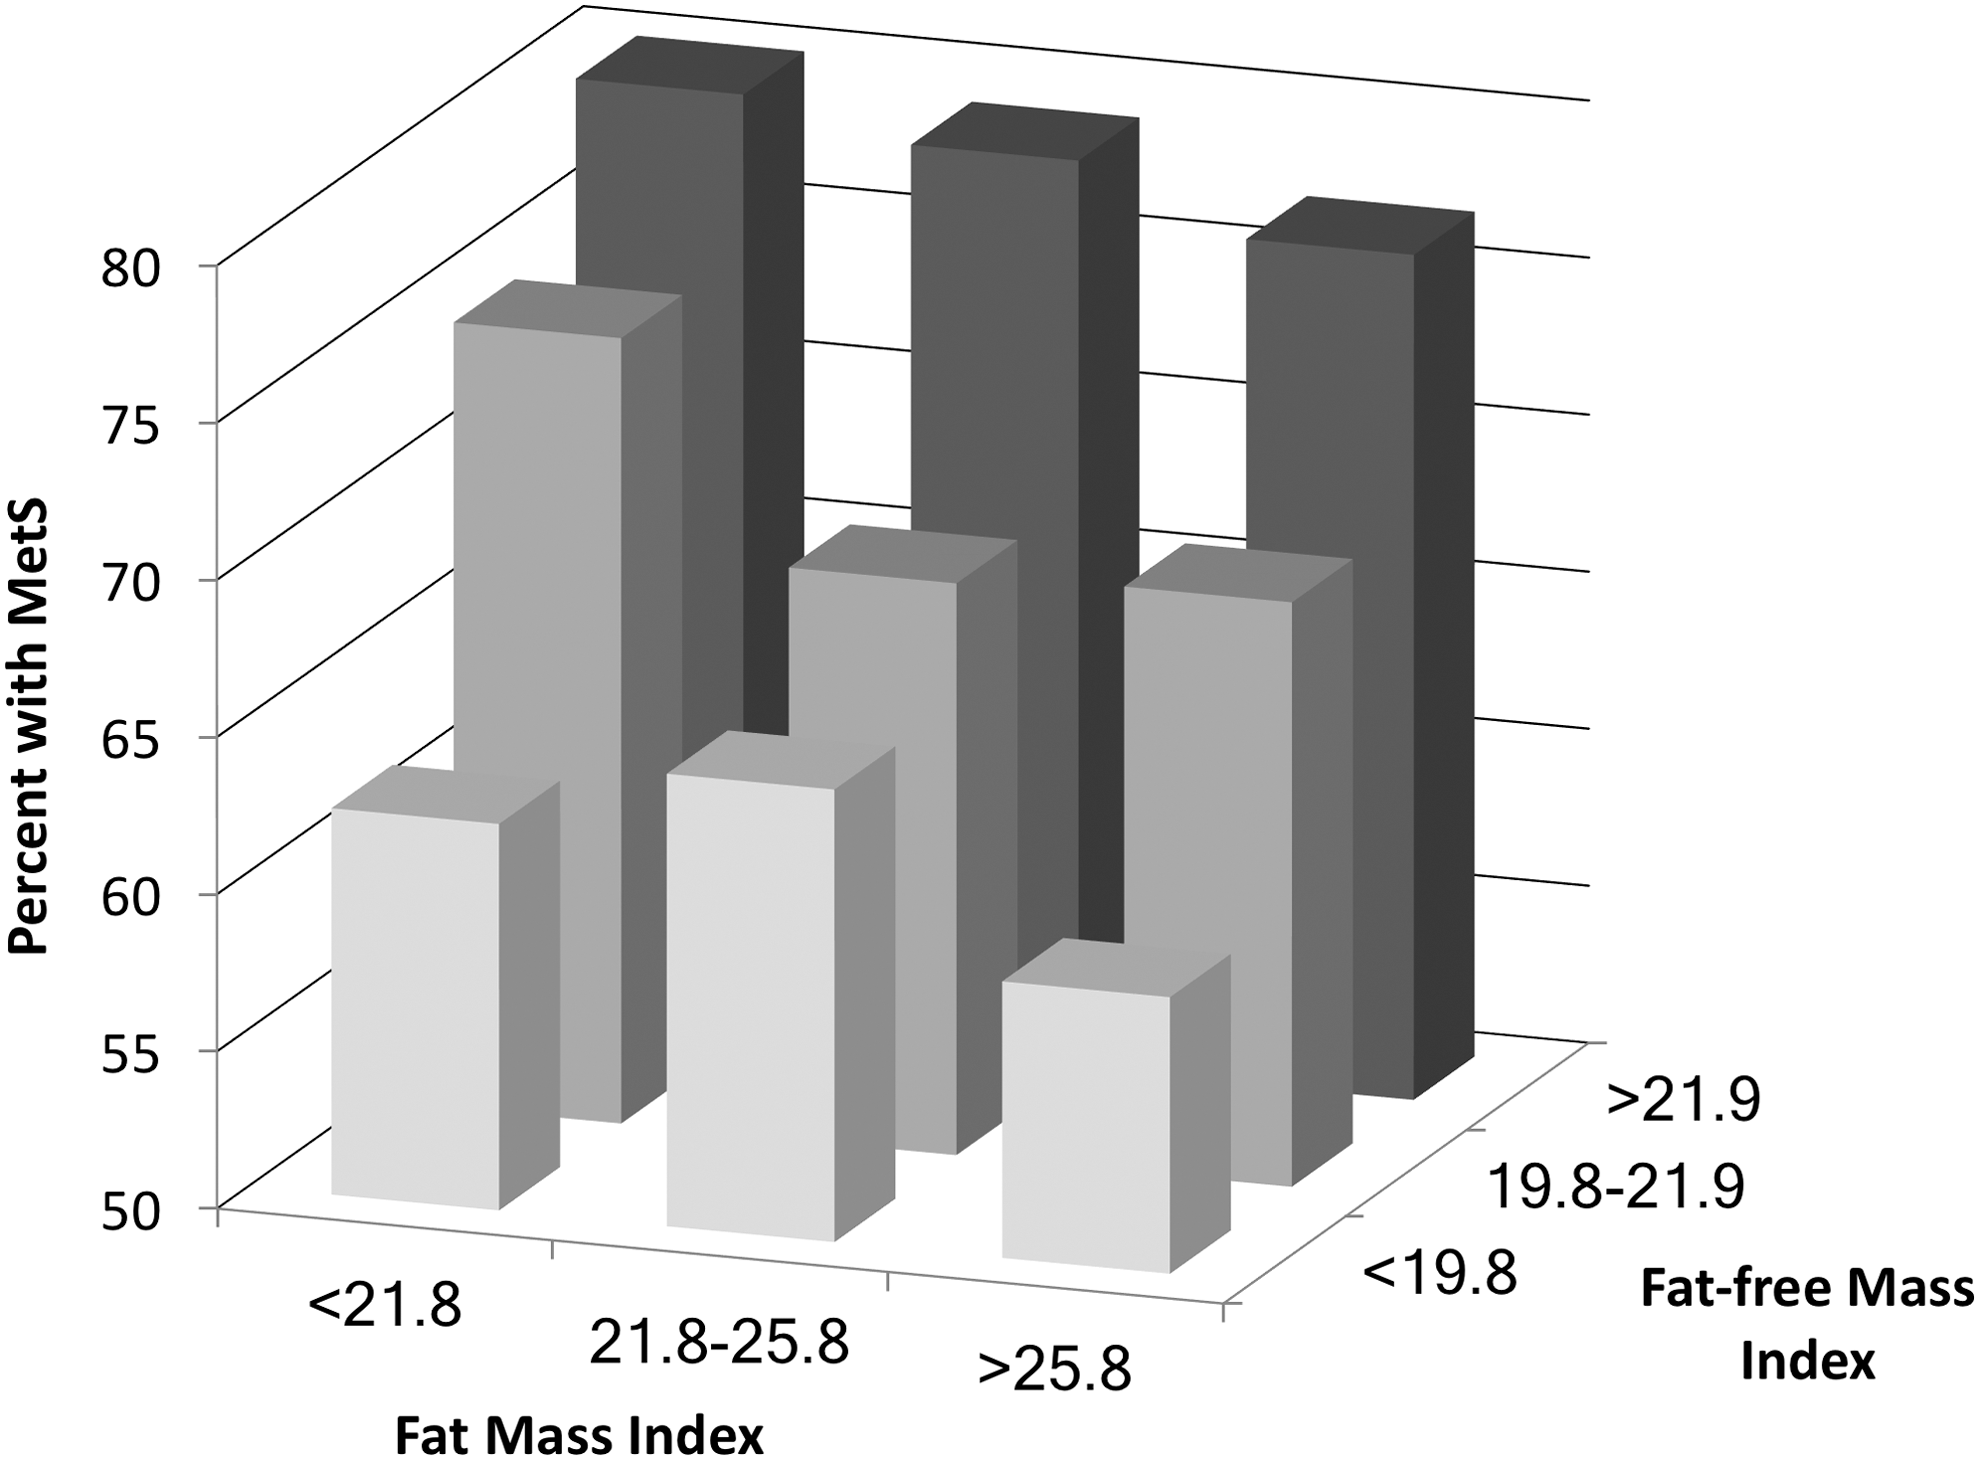
Association of MetS with FFMI and FMI. For purposes of illustration, prevalence of MetS by tertiles of FFMI and FMI are shown. For analysis, a continuous logistic model adjusting for age, higher FFMI was strongly associated with increased risk of MetS (P = 0.0004), while FMI was not (P = 0.79). FFM, fat-free mass; FM, fat mass; FFMI, FFM index; FMI, FM index; MetS, metabolic syndrome.
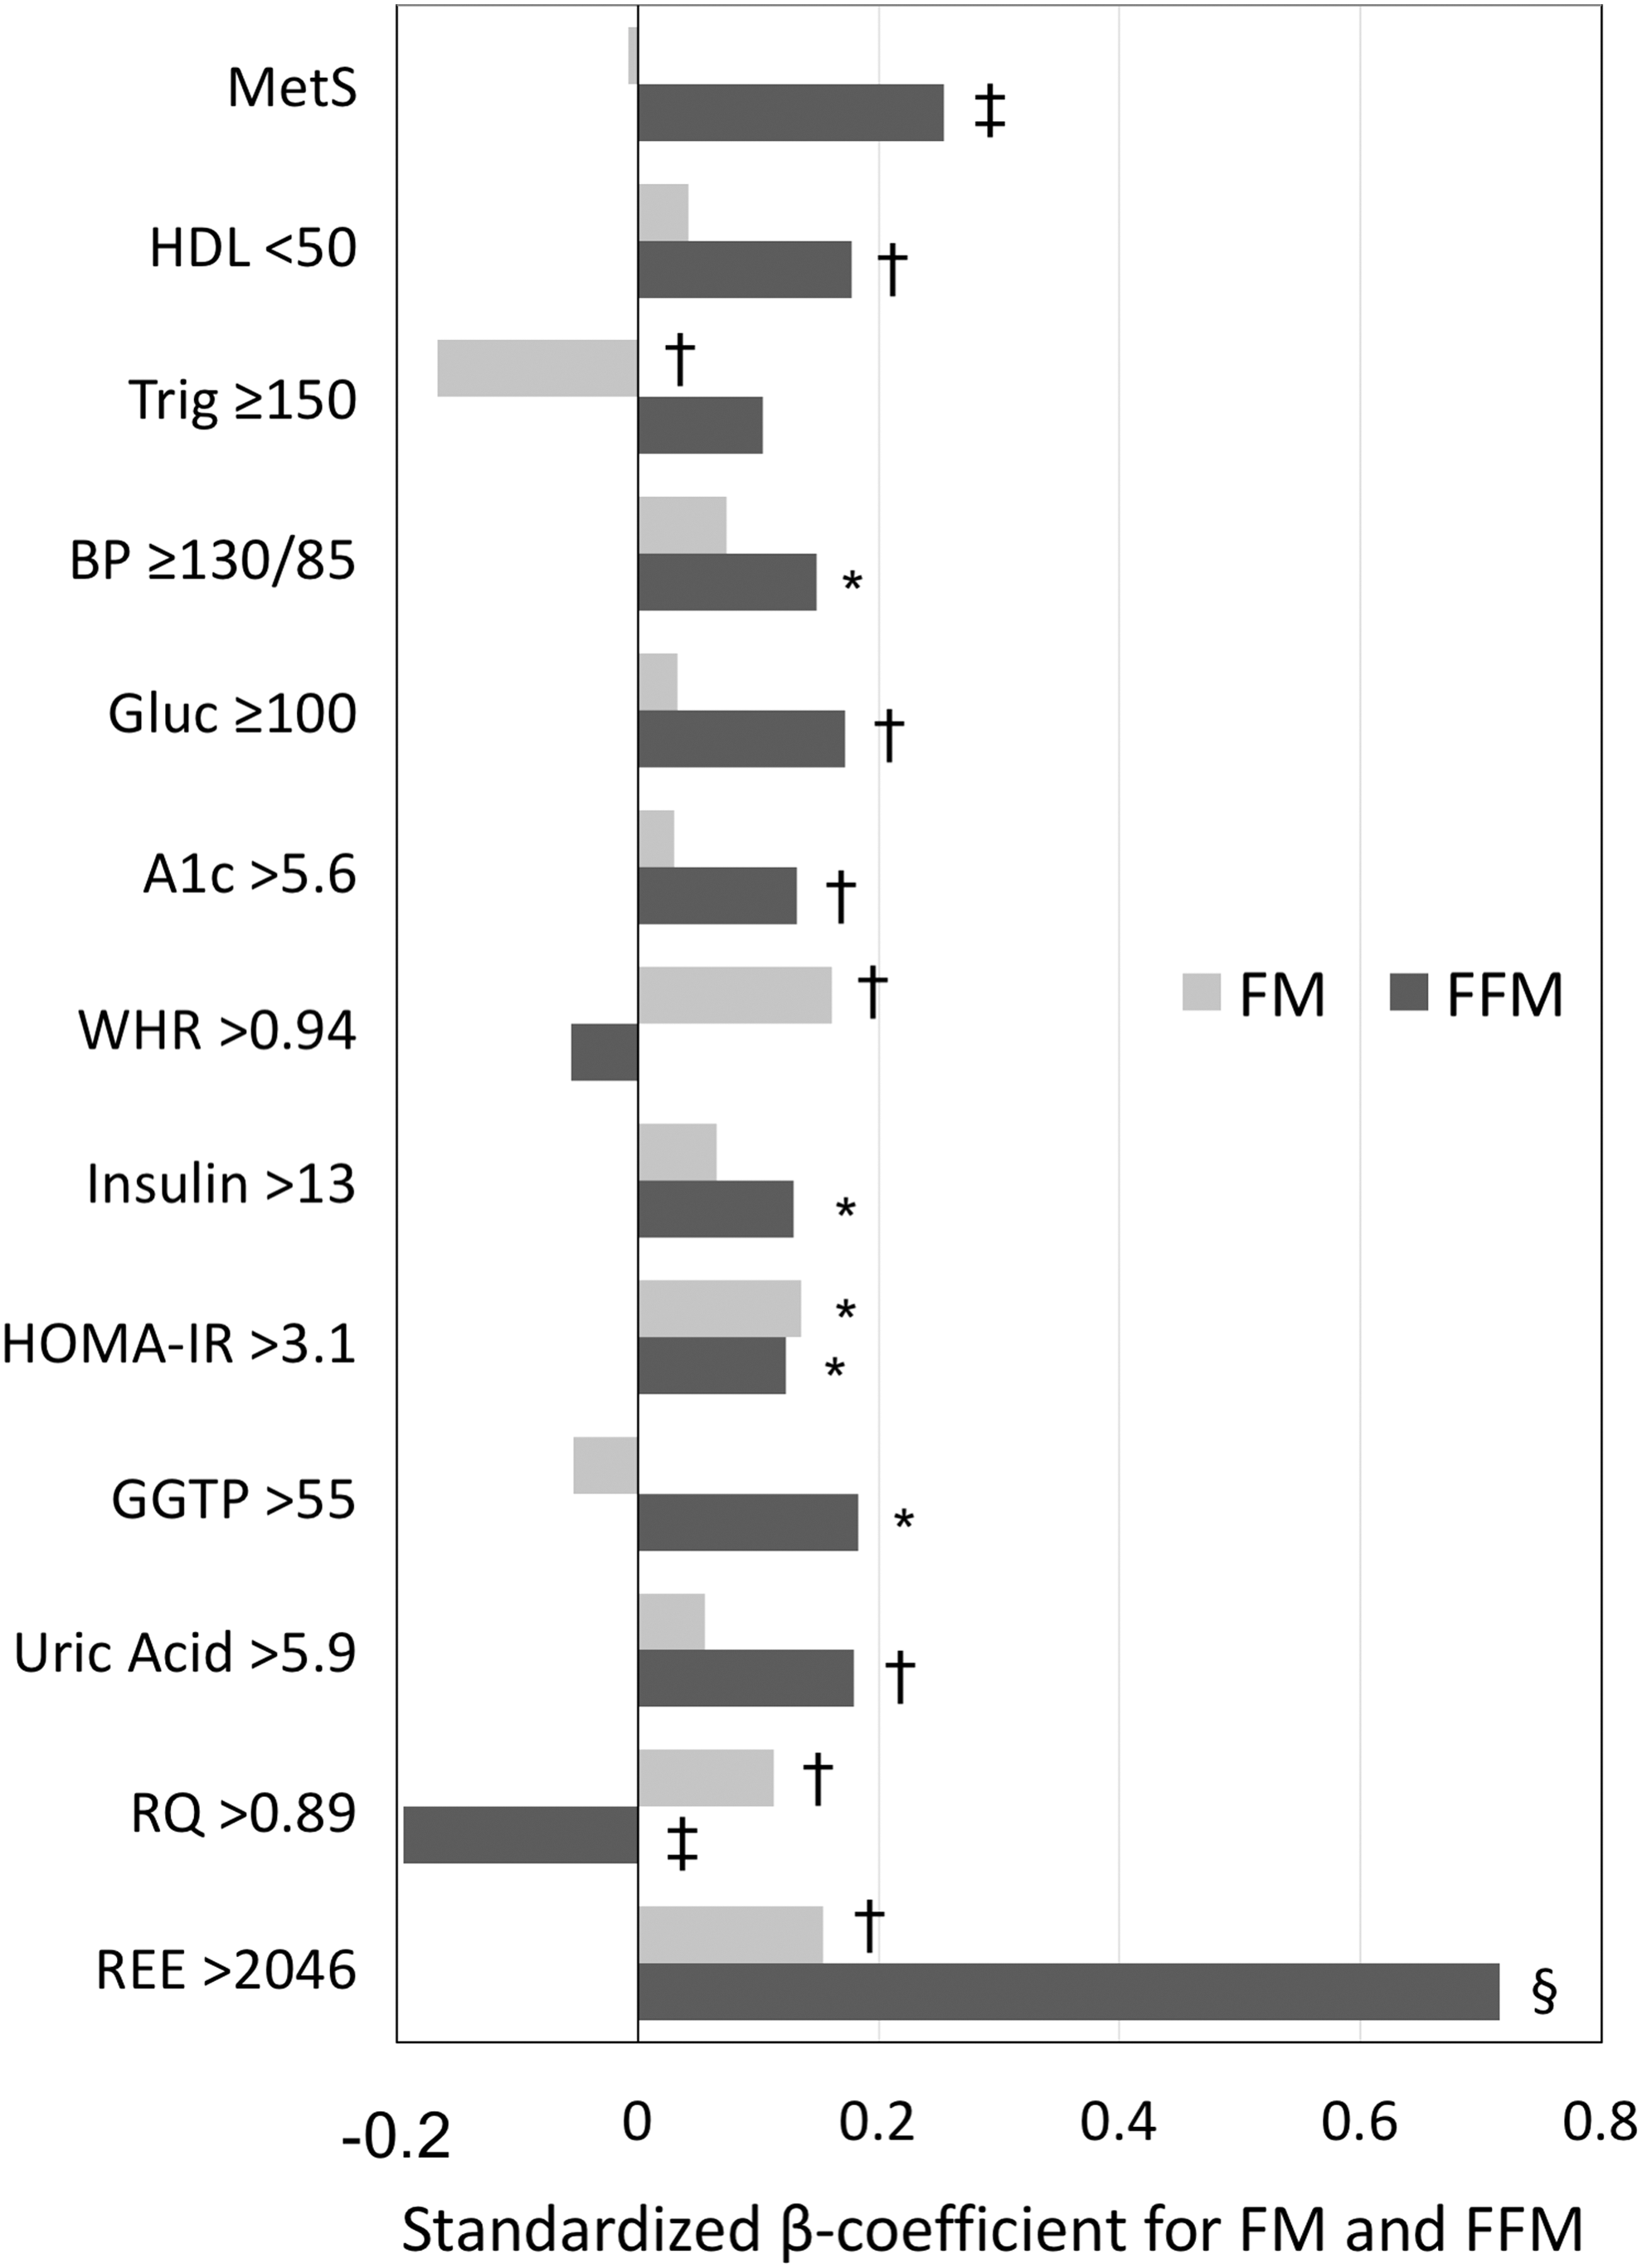
Association of FFM and FM with MetS and related factors. FM and FFM were considered independent variables (along with age and height) in logistic regression models to predict presence/absence of variables shown along the vertical axis. Shown on the horizontal axis are values for the standardized β-coefficients for FM and FFM obtained from each of these logistic regression models. Cutpoints for variables other than MetS factors represent median values except for GGTP whose cutpoint was the upper limit of normal. P-values are designated with the following symbols: *<0.05, †<0.01, ‡<0.001, §<0.0001. GGTP, gamma-glutamyl transpeptidase.
Also shown in Fig. 2 are results of logistic regression models examining the association of FFM and FM (adjusted for age and height) with individual components of MetS and several other measurements thought to be related to MetS. Importantly, FFM was significantly associated with all the components of MetS except triglycerides ≥150 mg/dL. Conversely, FM was not associated with any of the components of MetS except triglycerides ≥150 mg/dL, with which it was inversely associated. Greater FM was associated with higher waist–hip ratio (WHR), HOMA-IR, and RQ. FFM associated with lower RQ. Both FM and FFM positively correlated with REE as expected. When factors shown in Fig. 2 were analyzed as continuous variables, similar relationships to those shown in Fig. 2 were observed.
The strong association of REE with MetS suggested in Table 1 led us to re-examine this relationship after adjusting for expected covariates. As shown in Fig. 3, REE remained clearly higher in MetS women even after adjustment for age, FFM, and FM. These findings led us to further consider additional factors that might be associated with REE. We therefore performed multiple stepwise linear regression (with forward stepping) with REE as the dependent variable and the following variables as potential predictors: age, height, FM, FFM, waist, hip, WHR, systolic blood pressure, triglycerides (as the natural log, ln), HDL-C, glucose (ln), insulin (ln), GGTP (ln), uric acid, and RQ. In addition to FFM, FM, and age entering the model as expected, GGTP, triglycerides, glucose, systolic blood pressure, WHR, and RQ all entered as independent predictors. These results are shown in Table 2.

Resting energy expenditure is higher in women with severe obesity who have MetS. Shown are least square means and SE from analysis of covariance, adjusted for age, FM, and FFM (all with P < 0.0001). SE, standard error.
Results are from multivariable stepwise linear regression. Variables considered for entry included the following: age, height, FM, FFM, waist, hip, waist/hip, systolic BP, triglycerides (natural log), HDL-C, glucose (natural log), insulin (natural log), GGTP (natural log), uric acid, and RQ.
BP, blood pressure; FFM, fat-free mass; FM, fat mass.
Finally, we performed forward stepwise multiple logistic regression with MetS as the dependent variable and age, FFMI, FMI, WHR, insulin (ln), GGTP (ln), and uric acid as potential independent variables in the 929 women with all these measurements available. In order of entry into the model were GGTP (odds ratios [OR] 1.84, 95% CI 1.39–2.44, P < 0.0001), age (1.030, 1.017–1.044, P < 0.0001), insulin (1.46, 1.21–1.77, P < 0.0001), FFMI (1.11, 1.04–1.19, P = 0.0021), WHR (15.7, 2.6–96, P = 0.0029), and uric acid (1.16, 1.03–1.31, P = 0.012) with OR given per unit change (age, FFMI, WHR, and uric acid) or per natural log unit change (GGTP and insulin). Importantly, in a model without WHR, but with waist and hip as potential covariates, neither waist nor hip entered the model. Furthermore, FMI did not enter any model whether or not WHR, waist, or hip were in the list of variables considered.
In the subgroup of 626 subjects with REE and RQ measurements available together with the above variables, REE displaced FFMI and WHR and was first to enter the model (1.002, 1.001–1.002, P < 0.0001), followed by age (1.048, 1.030–1.067, P < 0.0001), insulin (1.59, 1.24–2.03, P = 0.0002), GGTP (1.53, 1.07–2.19, P = 0.021), and uric acid (1.18, 1.02–1.36, P = 0.028). Interestingly, insulin was the strongest correlate of RQ, (partial Pearson correlation coefficient = 0.240, P < 0.0001, adjusted for age and height), suggesting higher carbohydrate oxidation with higher insulin levels. These findings confirm strong positive associations of MetS with either FFMI or REE in our population, in addition to measures that have previously been associated with MetS (insulin, GGTP, and uric acid).
Discussion
To account for the 30% of women with severe obesity in the Utah Obesity Study who did not have MetS, we had hypothesized that women with MetS would have higher FM and greater lean mass would be protective. We expected that with greater FM there would be more abnormalities of adipose metabolism, or “adiposopathy.” 16 We further hypothesized that REE would be low and RQ would be high in MetS subjects. None of these expectations proved correct.
In univariate analyses, weight, BMI, FM, FMI, FFM, and FFMI were all increased in the women with MetS, as expected. Unexpectedly, however, we found in stepwise analyses that only FFM (or FFMI) was associated with MetS, while FM (or FMI) was not associated after adjusting for FFM. Furthermore, FFM was more consistently associated with all the elements of MetS. REE was significantly higher in those with MetS even after correction for age, FFM, and FM, and also correlated positively with multiple components of MetS. Finally, we showed that higher REE was independently associated with MetS, displacing FFM as the strongest predictor of MetS.
The prevalence of MetS we observed among our severely obese women was remarkably similar to that reported among smaller series of similarly overweight women. 10,11 Our finding that most measures of fatness, after adjustment for FFM, were not associated with having MetS or its components, although unexpected, has been reported by another group among severely obese subjects. 10 However, we do not see our findings as evidence against the likely contribution of visceral obesity or hypertrophied, hypoxic, insulin-resistant, and inflamed adipocytes to MetS, 17,18 Instead, our findings may suggest that among women with severe obesity, but without MetS, adipose quality may be different (for example, with expansion due primarily to hyperplasia rather than hypertrophy) and could accommodate equal or greater amounts of fat without the metabolic sequelae. 19 Indeed, an interesting genetic model has recently been described involving imprinting, which gives rise to obese mice characterized by increased proliferation of smaller or normal-sized adipocytes and an absence of metabolic sequelae. 20
The women with MetS in this study tended to have an android body fat distribution with an increased WHR that may have promoted MetS. Their greater FFM may also suggest greater androgen exposure. In a study of postmenopausal women with obesity, both greater visceral fat and, paradoxically, greater lean body mass were each independently associated with lower glucose disposal rates, higher plasma insulin levels, and higher C-reactive protein (CRP) levels. 21 Others have reported higher CRP and more adverse lipid profiles in association with higher lean body mass in subjects with severe obesity. 10,22 In other studies, women with presumably greater exposure to free testosterone due to lower sex hormone binding globulin (SHBG) had higher WHR, more visceral fat, and larger abdominal adipocytes, had higher plasma glucose, higher fasting insulin, and were more insulin resistant, and had higher CRP, higher triglycerides, and lower HDL-C. 23
Lower plasma triglyceride levels were associated with increasing FM or FMI in our cohort. Although perhaps counterintuitive, this observation is not unprecedented. In severely obese women who had FM determined by dual-energy X-ray absorptiometry (DXA), an inverse relationship between FM and triglycerides was reported, as in our study. 10 In another study, which included two large cohorts 2 , the percent of patients with dyslipidemia (primarily hypertriglyceridemia) peaked at 68% in subjects with BMI ranging from 30 to 39.5 kg/m2 and then decreased somewhat to 62.5% in patients with BMI > 40 kg/m2. Similarly, for the women in our study, the percentage with triglycerides ≥150 mg/dL was highest in the second BMI quintile (40–43 kg/m2) at 65.1% and then decreased to a low of 50.5% in the fifth quintile (BMI > 52 kg/m2). Possibly, among these women, as BMI increases, there is a greater prevalence of women whose adipose tissue is characterized by hyperplasia of smaller adipocytes, which may be more competent in sequestering triglyceride and avoiding several of the metabolic consequences of obesity and lipotoxicity. 19,24,25 Dietary factors, particularly saturated fat, may have a role in adipocyte proliferation and inflammation as well. 26
REE was significantly higher in women with MetS compared with those without MetS in our cohort. In addition to associations with age, FFM, and FM, REE was associated with components of MetS, including systolic blood pressure, plasma triglycerides, and glucose, and several factors related to MetS, including GGTP, WHR, and RQ. Furthermore, these associations with REE were statistically independent of FFM, FM, or age, suggesting potential mechanistic links between REE and components of MetS and related factors. One study has shown that an increased 24-hr adjusted REE was clearly associated with higher triglycerides and gluconeogenesis. 9 Interestingly, the higher energy expenditure appeared to limit subsequent weight gain during follow-up in that study. Our findings of positive correlations of REE with plasma glucose, triglycerides, and GGTP would be consistent with increased gluconeogenesis, but may additionally suggest increased whole body oxidation of glucose and fatty acids in association with greater supply. GGTP, along with alanine aminotransferase (ALT), has been utilized as a reasonable, although relatively insensitive, surrogate for liver fat. 27 New findings suggest that elevations of liver transaminases in obesity and hepatosteatosis may reflect upregulation and an increased cellular release of these enzymes in response to greater demands in gluconeogenic pathways (for ALT and aspartate aminotransferase [AST]) or an increased production of reactive oxygen species (for GGTP), and not necessarily evidence of cellular injury. 28 In one study of morbidly obese subjects evaluated before bariatric surgery, increased liver fat determined by computed tomography was a stronger predictor of MetS than visceral fat area. 11
A strong positive association between REE and blood pressure has also been previously reported. 29 This study was particularly notable for repeated measures of REE over 4.5 years, with results showing that the association with blood pressure was independent of sympathetic tone as estimated by 24-hr urinary catecholamines. While an increased REE was thought to be somehow causally related to increased blood pressure, another hypothesis is that higher vascular wall tension and the myogenic response could lead to increased vascular smooth muscle energy demands, respiration, and hence, higher REE. 30
Adipose tissue inflammation has been reported to be strongly associated with enlarged adipocytes and expression of MetS, 17 and has also been associated with increased lean body mass in women with obesity. 10,31 Interestingly, inflamed adipose tissue is less efficient in the transfer of cholesterol to HDL, another potential mechanism for the low HDL-C characteristic of MetS. 32 Chronic inflammation has been strongly linked to increased REE in many connective tissue disorders. 33 Thus, increased REE in our MetS subjects may not only reflect direct energy demands of FFM and FM but may also reflect the presence of inflammation. The elevated uric acid seen in women with MetS in our study was associated with higher FFM, but still remained a predictor of MetS independent of this and other factors tested. Elevated uric acid has long been reported by other investigators as a contributor to MetS and its elements. 34 –41
Our study has several limitations. This cross-sectional, observational study cannot prove causality, but can only demonstrate association. Some of the associations we observed may well be the result of MetS rather than its cause. Indeed, increased gluconeogenesis, blood pressure, and possibly inflammation may directly raise REE independent of MetS. However, our observation of an association between FFM and MetS would be more difficult to explain as a result of MetS.
Another notable limitation of our study is the use of BIA for determining fat and FFM. Magnetic resonance imaging (MRI) techniques may be considered the gold standard for quantifying specific fat depots in living persons. 42,43 New automated cross-sectional and volumetric methods for evaluating MRI images are particularly promising. 44 Chemical shift-based magnetic resonance methods are emerging as highly accurate methods that may provide quantitative estimates of whole body, regional, and specific depot fat content with relatively rapid scan times. 42,45,46 Future studies would greatly benefit from applying these methods. However, body composition analyses by imaging technologies such as MRI and DXA are not even possible in subjects with the most severe obesity, for whom magnet bore size, table weight limitations, and scanning field of view are insufficient for whole body imaging. 47,48 Indeed, these size limitations would have excluded well over 25% of this cohort. Fortunately, previous studies comparing BIA to criterion measures using subjects with severe obesity have shown strong correlations between BIA and DXA 49 and also a three-compartment model, 50 despite relatively wide limits of agreement that weaken prediction accuracy for individuals. 50 With the large sample size used in this study, however, and using prediction formulae developed in subjects with similar age, sex, and degree of obesity, BIA estimates of fat and FFM can be considered a reasonable alternative to either DXA or a three-compartment model.
While of considerable interest, we do not have available any measurements of steroid hormones, SHBG, or CRP. Finally, no adjustments of the P-values for multiple comparisons have been attempted. Many of the variables are highly correlated, making it difficult to know how to make these adjustments. There were 13 variables used for prediction of either FM or FFM and 15 variables used for prediction of REE, resulting in 41 statistical tests. In the most conservative case, only P-values <0.0012 (0.05/41) would be considered significant.
Conclusions
Thirty percent of 949 women with severe obesity in our cohort did not have MetS, despite a mean BMI of 45.7 kg/m2 and with all subjects meeting criteria for an enlarged waist. Unexpectedly, we found that FFM was strongly associated with MetS while FFM-adjusted FM was not. Indeed, FFM was positively associated with several other MetS-related measurements, including higher hemoglobin A1c, insulin, HOMA-IR, GGTP, and uric acid. Furthermore, REE was markedly increased in MetS and was associated with multiple components of MetS and related variables. These findings support the assertion that factors beyond mere fat accumulation promote MetS, including a more male-type fat and muscle distribution, greater inflammation, or possibly more enlarged adipocytes, leading to an increased risk of MetS in women with severe obesity.
Footnotes
Acknowledgments
This research was supported by a grant (DK-55006) from the National Institute of Diabetes and Digestive and Kidney Disease and a grant (M1-RR00064) from the National Center for Research Resources. Research was also supported, in part, by funding from the Atherometabolism Institute.
Author Disclosure Statement
No conflicting financial interests exist.