
Abstract
Background:
Epicardial adipose tissues reflecting visceral fat accumulations of the heart are associated with metabolic syndrome (MetS) and can be a predictor of other cardiometabolic diseases. It can adversely influence autonomic nervous system (ANS) of heart. Heart rate recovery (HRR) is an easy method for measuring ANS dysfunction. The purpose of this study was to determine whether epicardial fat thickness (EFT) and nonalcoholic fatty liver disease (NAFLD) are related to HRR in patients with MetS.
Methods:
We enrolled 772 consecutive patients from a health-screening center who underwent abdominal ultrasonography, treadmill test, and cardiac echocardiography. EFT using echocardiography and HRR by symptom-limited exercise testing was assessed. According to the presence of MetS and NAFLD, patients were classified into the four groups.
Results:
In NAFLD patients, EFT was higher and HRR was lower, especially in patients with MetS and NAFLD, compared to non-MetS participants without NAFLD (MetS with NAFLD, EFT 7.5 ± 4.4 mm, HRR 31.9 ± 12.7; MetS without NAFLD, EFT 4.9 ± 3.0 mm, HRR 39.5 ± 11.1; non-MetS with NAFLD, EFT 5.9 ± 3.6 mm, HRR 36.6 ± 12.7; and non-MetS without NAFLD, EFT 4.4 ± 3.5 mm, HRR 43.4 ± 14.5, p < 0.001). Patients with severe liver steatosis (LS) showed significantly higher EFT than those with moderate LS (14.2 ± 2.0 vs. 7.5 ± 3.1 mm, P < 0.001), and EFT was positively correlated with severity of LS (r = 0.431, P < 0.001). HRR was significantly correlated with EFT (r = −0.386, P < 0.001) and severity of LS (r = −0.324, P < 0.001).
Conclusions:
EFT and NAFLD were significantly correlated with HRR in patients with MetS and they may be highly related to increased cardiovascular risk. These results suggest a cross-link among EFT, NAFLD, and cardiac autonomic dysfunction in patients with MetS.
Introduction
R
Cardiac adiposity is associated with cardiovascular (CV) risk factors such as high blood pressure (BP), dyslipidemia, insulin resistance, and carotid atherosclerosis. A fatty heart can be assessed through the detection and quantification of epicardial fat and can be measured by cardiac echocardiography, computed tomography, or magnetic resonance imaging (MRI). 6 MRI is considered the best way to detect and quantify epicardial fat, but echocardiography is the easiest and most convenient method in real clinical practice. 6,7 In addition, previous studies have shown that echocardiographic estimation of epicardial fat thickness (EFT) could serve as a valid indicator of visceral adiposity and associated CV risk. 8,9 Because epicardial fat has unique biomolecular and anatomic or mechanical characteristics, increased epicardial fat might reflect myocardial fat in patients with different degrees of adiposity. 10 Moreover, epicardial fat has unique various functions in endocrine and paracrine systems such as secretion of proatherogenic and pro-inflammatory adipokines. These fat-related cytokines have been linked to sympathetic overactivity and epicardial fat tissue, which influence the autonomic nervous system (ANS) of heart. 11 –13 Heart rate recovery (HRR) after exercise is a simple, noninvasive, and important assessment used to analyze cardiac ANS dysfunction, which is considered a new prognostic predictor for CV mortality. 14,15 In view of this, previous studies have shown that decreased HRR is associated with metabolic syndrome (MetS), 16 NAFLD, 17,18 and epicardial fat in patients with MetS. 12 However, whether any link between epicardial fat and fatty liver is related to autonomic function in patients with MetS has not been well studied. Hence, we sought to determine whether and to what extent echocardiographic EFT and NAFLD are related to HRR as simple cardiac autonomic indicators in patients with MetS.
Subjects and Methods
Study design
This study included 772 consecutive patients from a health-screening center who underwent abdominal ultrasonography (USG), an exercise treadmill test, and cardiac echocardiography on the same day in the period between January 2010 and March 2015. Anthropometric measurement and medical screening blood sampling were obtained from all participants. None of the participants had a prior history, clinical signs, or symptoms of coronary artery disease (CAD), cerebrovascular disease, renal disease, or endocrine disorder. Patients were classified according to ultrasonographic evidence of NAFLD and presence of MetS. This study was approved by our institutional review board.
Definition of NAFLD and MetS
The diagnosis of NAFLD was based on abdominal USG in patients who met the following criteria: no drug history of hepatotoxic medication; no history of excessive alcohol intake as defined by an average alcohol intake >40 grams per week; negative tests for viral or autoimmune hepatitis; and absence of history/findings related to liver cirrhosis and other active chronic liver diseases. A survey was conducted to obtain information about alcohol consumption in all participants. 19 Using the International Diabetes Federation criteria, 20 MetS in South Korean adults was defined as central obesity [waist circumference (WC) ≥90 cm for men and ≥85 cm for women] 21 plus two of the following four factors: serum triglycerides ≥150 mg/dL, high-density lipoprotein cholesterol <40 mg/dL for men and <50 mg/dL for women, systolic BP ≥130 mmHg or diastolic BP ≥85 mmHg, and fasting plasma glucose ≥100 mg/dL.
Echocardiographic measurement of EFT
Standard two-dimensional echocardiography was performed in all participants using a 3.5-MHz transducer (Philips iE33; Philips Medical Systems, Bothell, WA), and the echocardiographers were blinded to clinical information about the participants. Interventricular septal wall thickness and posterior wall thickness, the dimension of the left ventricle (LV) cavity, and the LV mass index were assessed according to the criteria of the American Society of Echocardiography. 22 Definition of EFT was considered as the echo-free space between the visceral layer of the pericardium and the outer wall of the myocardium. Echocardiographic measurements of EFT were performed vertical to the right ventricular free wall at end-systole in three cardiac cycles according to previous methods. 23 Mean EFT was calculated as average from the parasternal long axis and short axis views because EFT measurement might be inconsistent with measurement locations. Two independent cardiologists who were blind to the clinical data measured EFT in the first 50 consecutive participants; these measurements were repeated at least twice. The intra- and interobserver variabilities of EFT were 3.3% and 5.8%, respectively.
Ultrasound evaluation of NAFLD
All participants underwent abdominal USG to assess hepatic steatosis using an Acuson Sequoia (Siemens, Mountain View, CA) with a convex probe (2.5–5 MHz). The same examiner, who was unaware of the purpose of the study and the clinical information performed ultrasound scans in all participants. Hepatic steatosis was assessed by qualitative visual scoring on a scale of 0–3 (0 = absent, 1 = mild, 2 = moderate, and 3 = severe) on the basis of an abnormally intense, hyperechoic echogenicity of the hepatic parenchyma compared with the kidneys, blurring of blood vessel structures, and deep attenuation of the ultrasonic beam. 24,25
Exercise treadmill testing
According to the protocol by Bruce et al., 26 all participants underwent symptom-limited exercise stress testing (GE CASE T2100; GE Medical Systems, Milwaukee, WI). BP was automatically measured at the same arm as that was used to measure resting BP by an automated BP monitor (SunTech Tango; SunTech Medical, Morrisville, NC) during the treadmill test. Continuous monitoring of 12-lead electrocardiography (ECG) was conducted, and ECG was printed at a paper speed of 25 mm per second; measurements of heart rate (HR) and BP were recorded at the end of each 3-min stage, at peak exercise, and at 1-min intervals during recovery phase. Exercise was continued until the participants felt volitional fatigue or if HR exceeded 95% of the predicted maximal HR (220-age), and the total time of exercise was recorded. Functional capacity was assessed by metabolic equivalents (METs) based on the speed and grade of the treadmill. 27 The participants continued to walk for 60 sec with a speed of 1.5 miles per hour during the recovery phase and then they sat down for 3 min while monitoring BP and rate and rhythm of the heart. The definition of HRR was a reduction in HR from peak exercise to 1 min after stopping of exercise. An impaired HRR was defined as ≤12 beats per minute according to previous studies. 28
Clinical measurements and laboratory procedures
Recorded demographic characteristics included age, gender, height, weight, body mass index (BMI), current medications, smoking history, and medical history. WC was measured at the level of the umbilicus in a standing position, and BP was obtained by a standard mercury manometer. Blood samples for clinical hematology and chemistry were obtained after a 12-hr overnight fast.
Statistical analyses
Statistical analyses were performed using the Statistical Package for the Social Sciences (SPSS) version 18.0 for Windows (SPSS, Inc., Chicago, IL). Data are presented as mean ± standard deviation for continuous variables and percentages (%) for categorical variables. The Mann–Whitney U test was performed for continuous variables, and the Chi-square test was used for categorical data. The normality of the data was tested using the Kolmogorov–Smirnov test. The differences among the four groups (MetS with NAFLD, MetS without NAFLD, non-MetS with NAFLD, and non-MetS without NAFLD) were evaluated using one-way analysis of variance, as the data were normally distributed. Relationships between variables were examined using Pearson correlation coefficients. A linear regression analysis was performed to evaluate the relationship of numerous variables in all participants. Multivariate logistic regression models were used to determine which variables were independently associated with blunted HRR. A two-tailed P < 0.05 was considered to be statistically significant.
Results
Comparison of the clinical, echocardiographic, and exercise parameters
A total of 210 MetS patients (male/female: 181/29 and age: 52.5 ± 9.2) and 562 participants without MetS (male/female: 410/152 and age: 53.4 ± 9.7) were analyzed; the clinical features are summarized in Table 1. The MetS patients with NAFLD were associated with old age, male gender, and high BMI compared to MetS patients without NAFLD. There were no significant differences in the blood chemistry results between MetS patients with and without NAFLD except uric acid level and aspartate aminotransferase. There was no significant difference in cardiac function or chamber geometry. However, EFT was significantly higher in NAFLD patients, especially in MetS patients with NAFLD compared to the non-MetS participants without NAFLD (Table 2). Table 3 provides a comparison of the symptom-limited exercise stress testing. Exercise time and METs were significantly lower in the MetS patients (P value's <0.05). HRR was significantly lower in the NAFLD patients, especially in MetS patients with NAFLD compared to the non-MetS participants without NAFLD (Table 3). The incidence of impaired HRR, which was defined as ≤12 beats per minute, was ∼15% in MetS with NAFLD patients; there was a significant difference between MetS patients with and without NAFLD.
All values are presented as the mean ± SD.
P < 0.05 versus MetS(−)NAFLD(−)group, + P < 0.05 versus MetS(−)NAFLD(+) group, # P < 0.05 versus MetS(+)NAFLD(−) group.
BP, blood pressure; LDL, low density lipoprotein; HDL, high density lipoprotein; AST, aspartate aminotransferase; ALT, alanine aminotransferase; GTP, glutamyltransferase; Hs-CRP, high-sensitivity C-reactive protein; NAFLD, nonalcoholic fatty liver disease; MetS, metabolic syndrome; ANOVA, analysis of variance; SD, standard deviation.
All values are presented as the mean ± SD.
P < 0.05 versus MetS(−)NAFLD(−)group, + P < 0.05 versus MetS(−)NAFLD(+) group, # P < 0.05 versus MetS(+)NAFLD(−) group.
EFT, epicardial fat thickness; LVEDD, left ventricular end-diastolic diameter; LVESD, left ventricular end-systolic diameter; IVSTd, diastolic interventricular septal wall thickness; PWTd, diastolic posterior wall thickness; LVMI, left ventricular mass index; RWT, relative wall thickness; EF, ejection fraction; LA, left atrial diameter; E, peak early diastolic mitral filling velocity; Ea, mitral annular velocity; A, peak late diastolic mitral filling velocity.
All values are presented as the mean ± SD.
P < 0.05 versus MetS(−)NAFLD(−)group, + P < 0.05 versus MetS(−)NAFLD(+) group, # P < 0.05 versus MetS(+)NAFLD(−) group.
HRR, heart rate recovery.
Comparison of EFT and HRR according to severity of LS
Patients with severe LS (n = 24, ultrasound score 3) showed significantly higher EFT (14.2 ± 2.0 vs. 7.0 ± 3.5 mm, all P's < 0.001) and lower HRR (22.0 ± 14.2 vs. 34.1 ± 10.9, all P's < 0.001) scores than those with moderate LS (n = 123, score 2) (Fig. 1). A simple regression analysis revealed that EFT (r = 0.431, P < 0.001) and HRR (r = −0.386, P < 0.001) were positively correlated with severity of LS (Table 4). Moreover, EFT was significantly correlated with HRR (r = −0.386, P < 0.001, Fig. 2). According to multiple regression analysis, EFT was an independent predictor of NAFLD after adjustment for age, WC, BMI, and CV risk factors. Moreover, EFT was an independent predictor of impaired HRR.
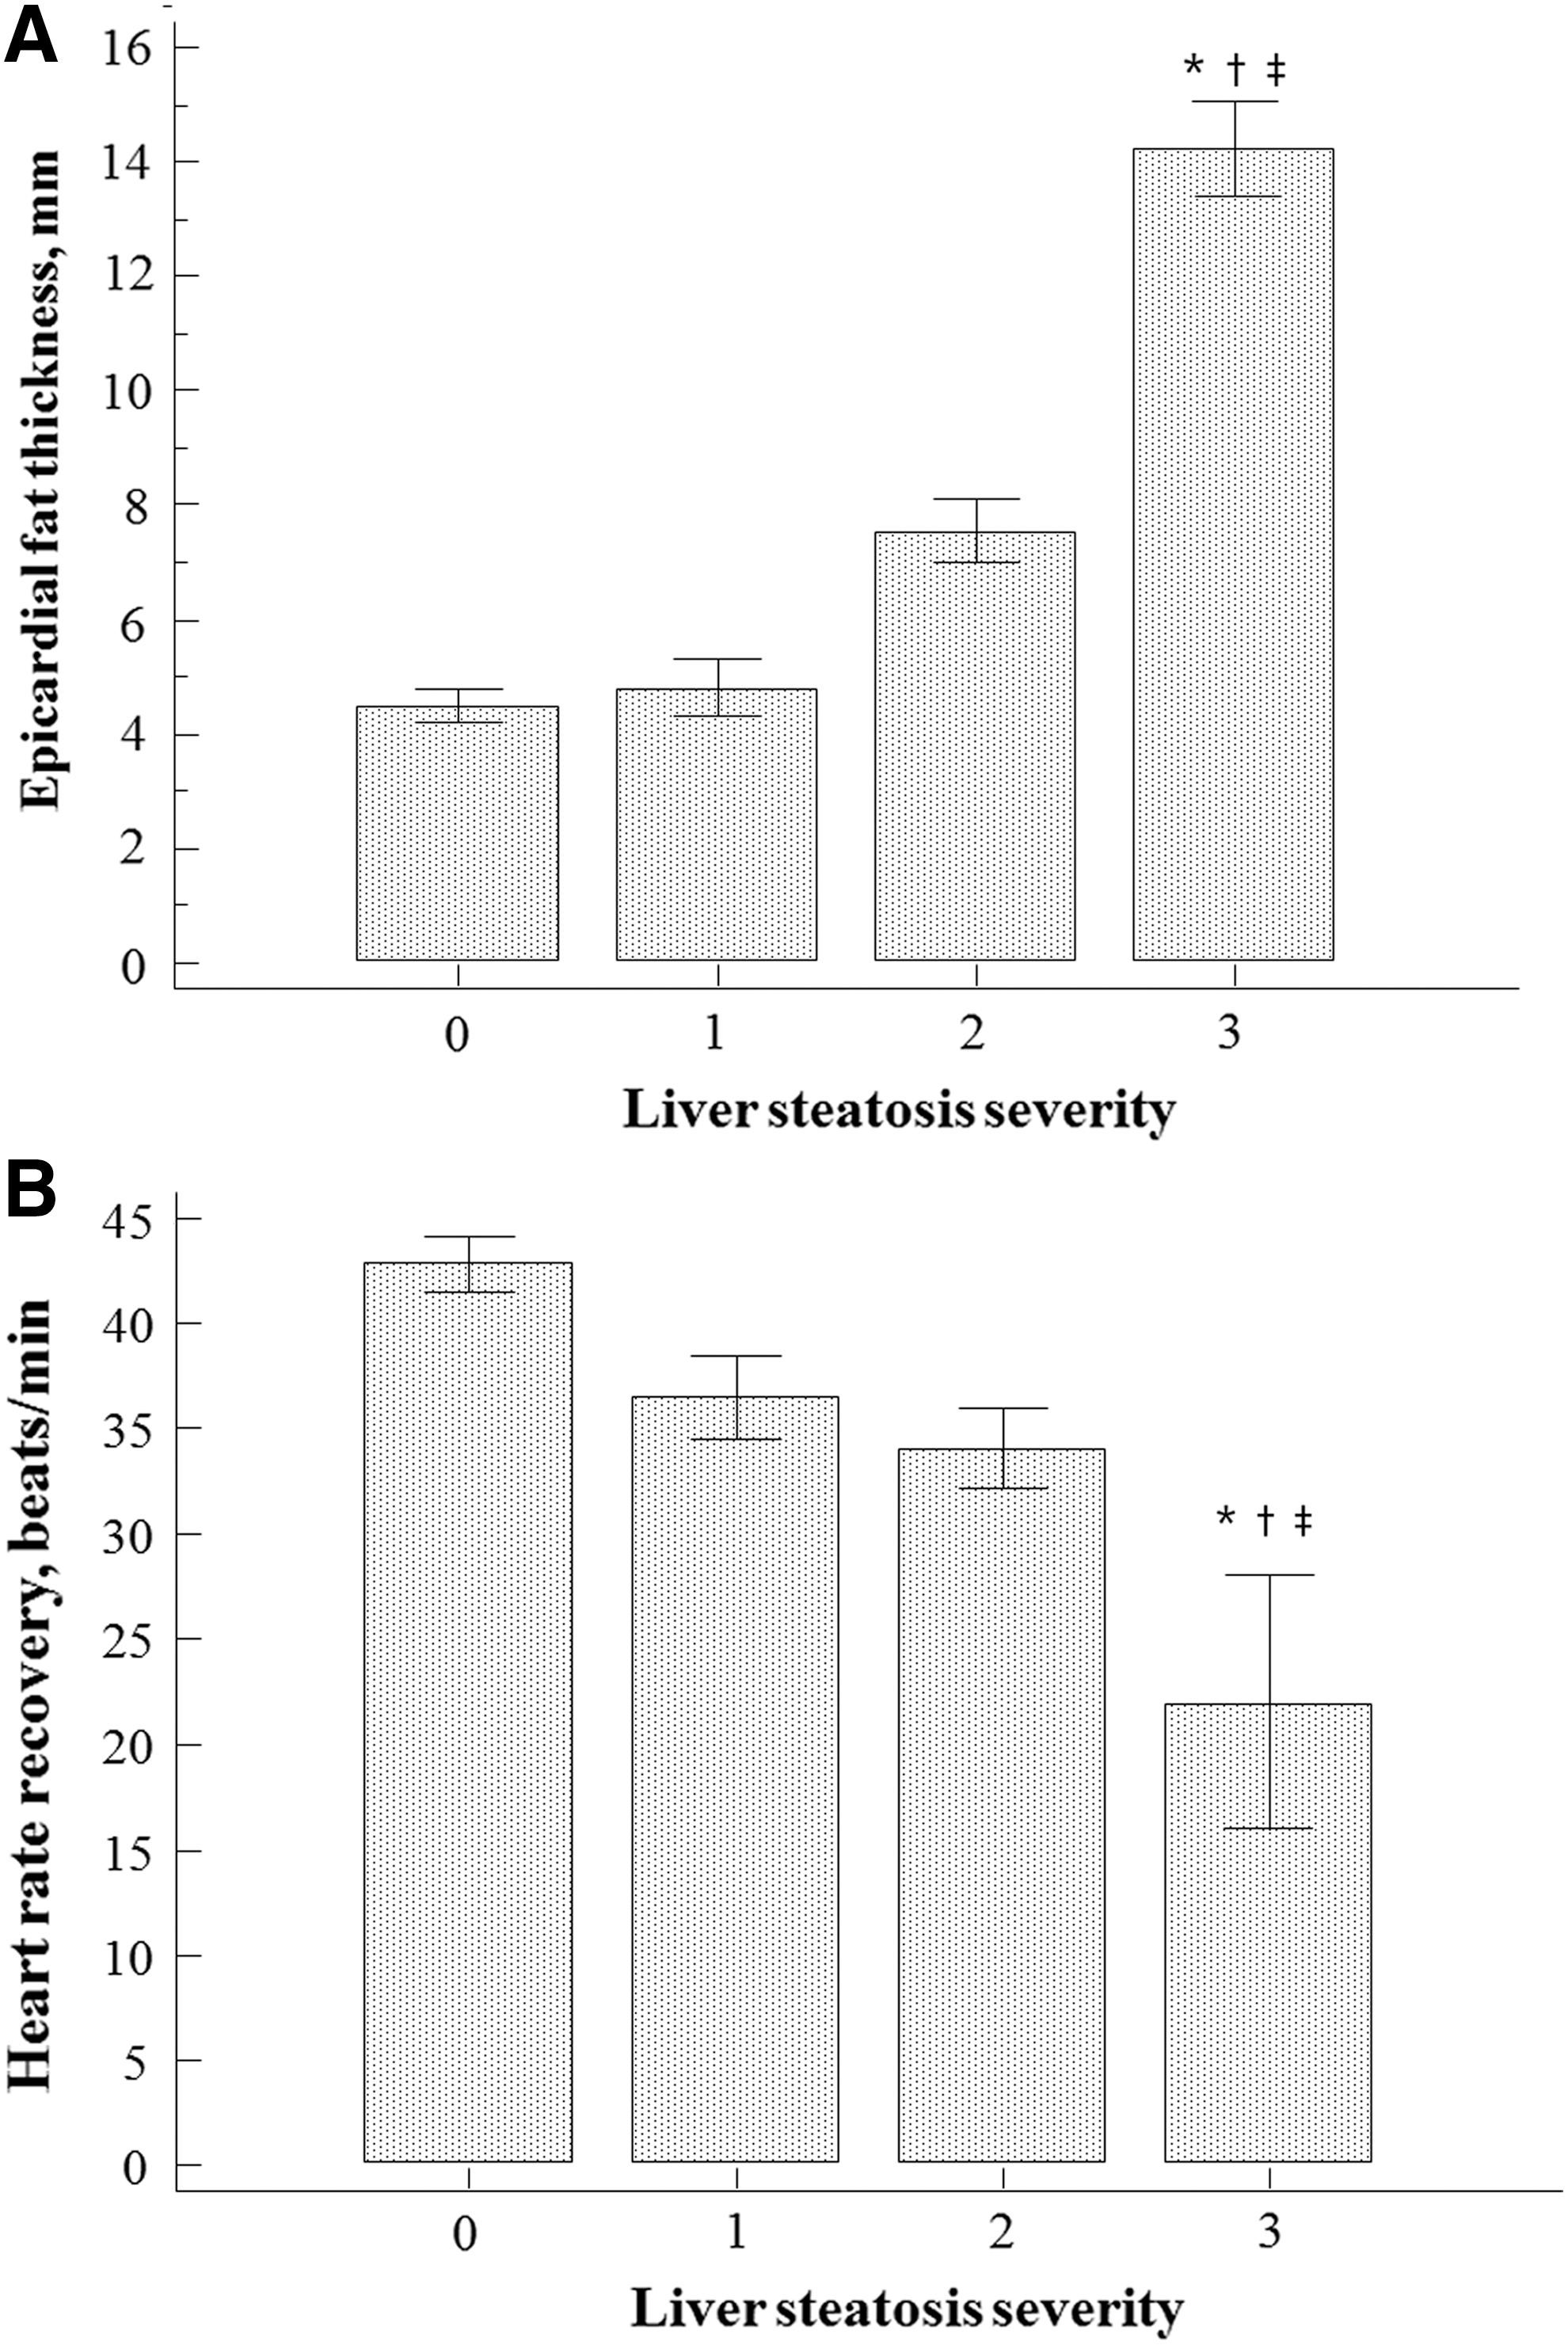
Comparison of EFT and HRR according to liver steatosis severity. Patients with severe liver steatosis showed significantly higher EFT
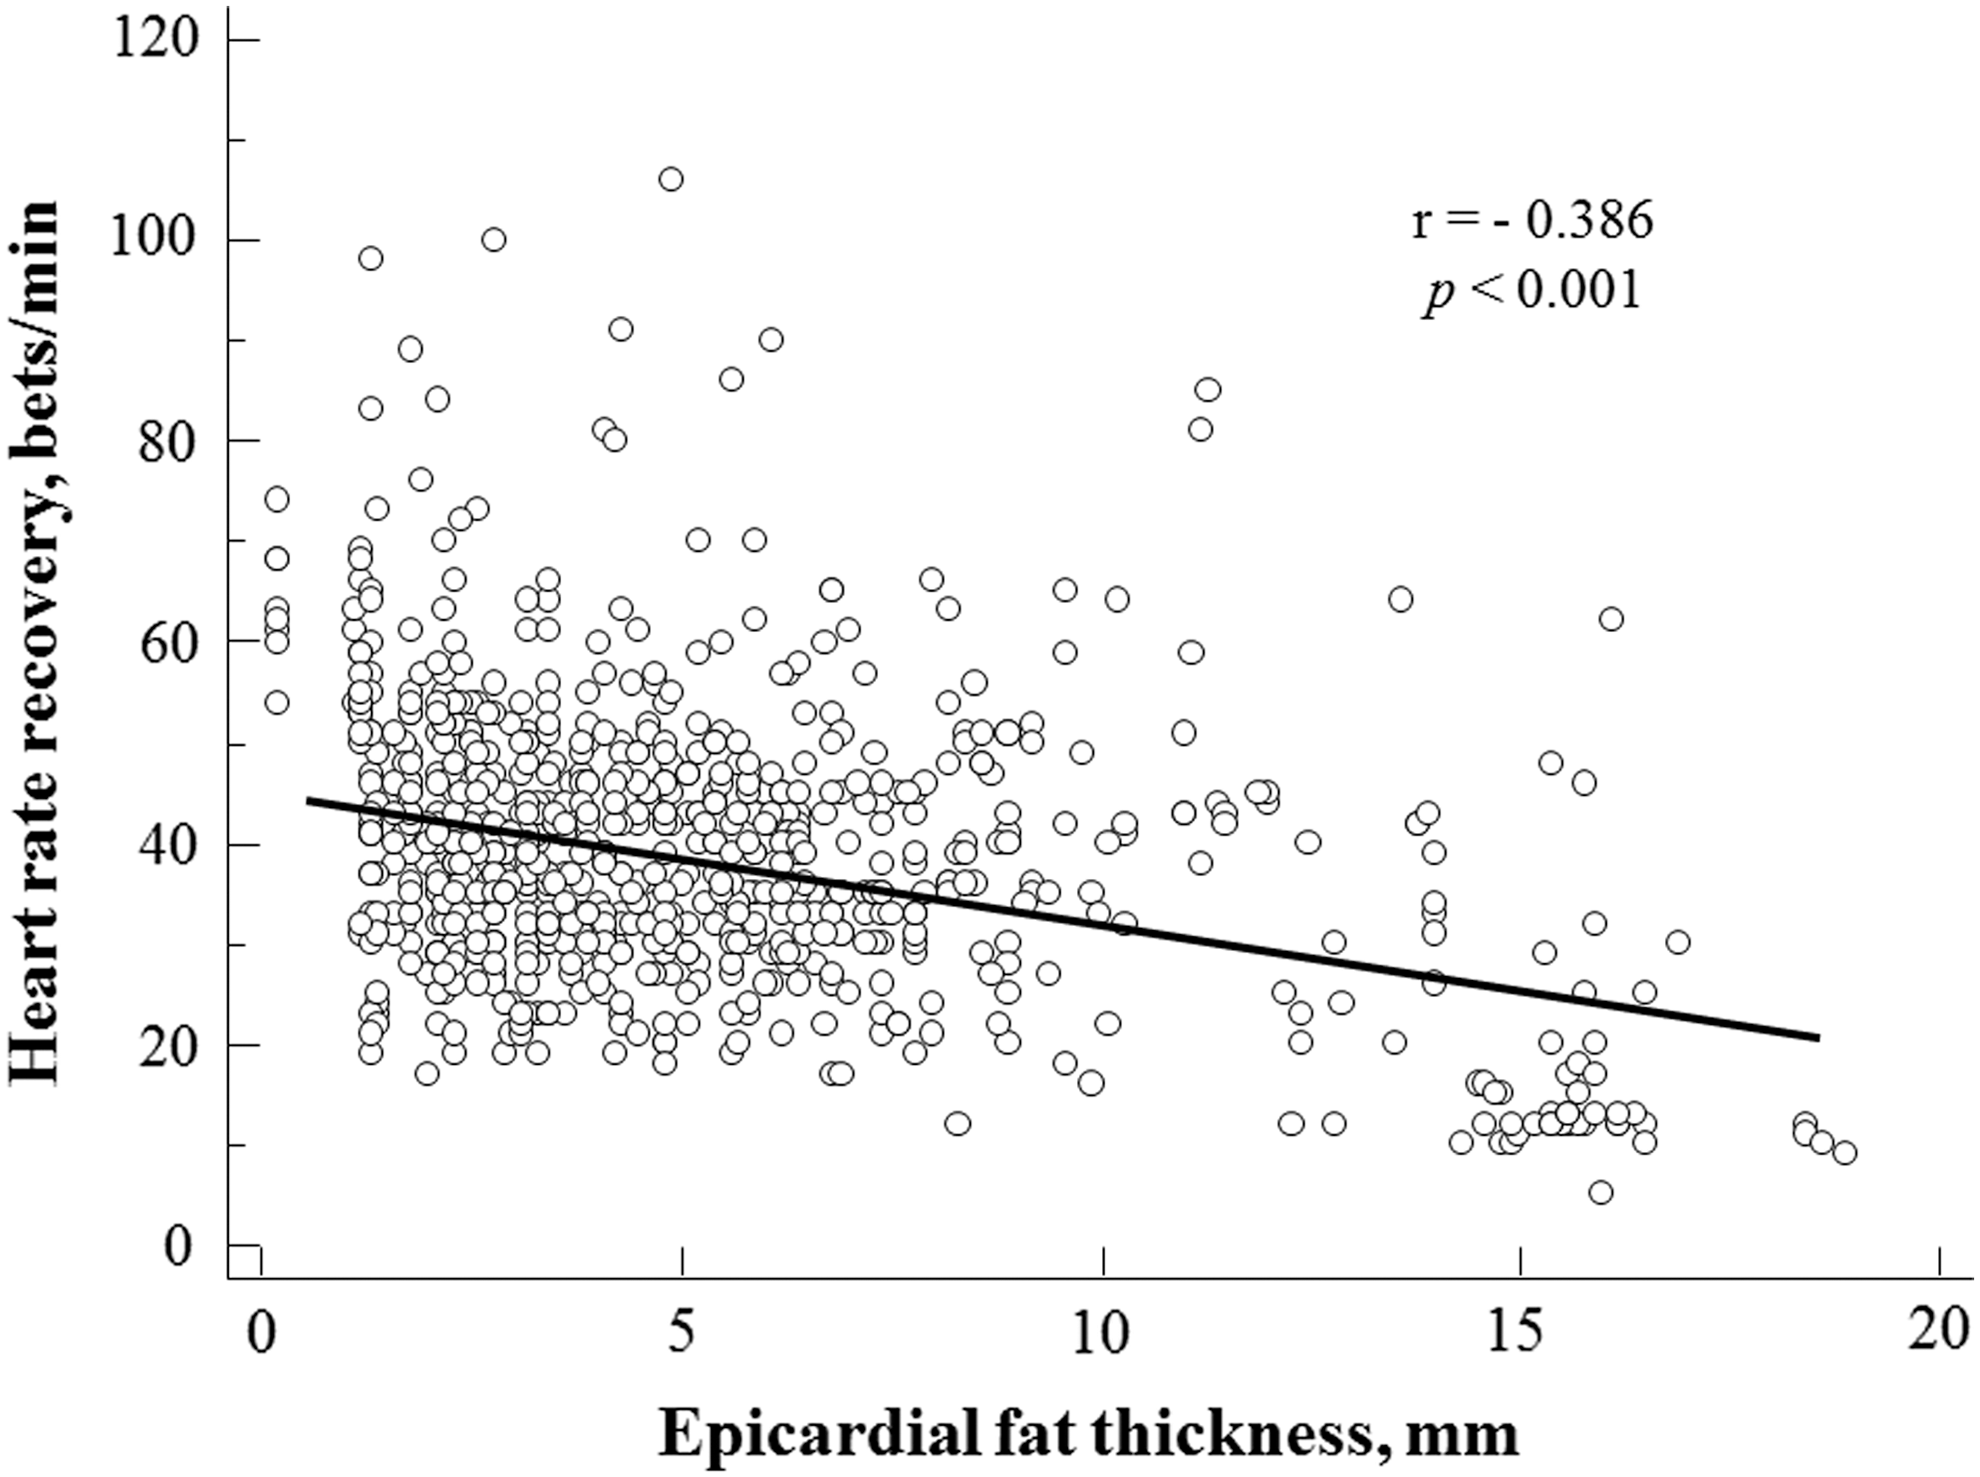
Simple regression analysis revealed that EFT was significantly correlated with HRR (r = −0.386, P < 0.001).
TG, triglyceride.
Discussion
The most meaningful findings demonstrated from the current study are as follows: (1) excessive epicardial fat accumulation is correlated with fat accumulation in the liver, (2) epicardial fat was thickest and HRR was lowest in the MetS patients with NAFLD, (3) EFT and HRR had a significant correlation with NAFLD severity stratified by USG score, and (4) EFT and NAFLD were independent predictive factors for impaired HRR in patients with MetS. To the best of our knowledge, our study is the first study to suggest a potential relationship between epicardial fat, NAFLD, and cardiac autonomic dysfunction assessed using HRR in MetS patients. We believe that our findings have the potential for immediate clinical application, and the echocardiographic measurement of epicardial fat may reflect fatty liver infiltration and also serve as an additional marker of autonomic dysfunction.
Obesity causes increased fat accumulations in classical adipose tissue and significant lipid deposit within the internal organs in patients with MetS. Ectopic fat accumulation reflecting visceral adiposity is a novel emerging cardiometabolic risk factor; therefore, measurements of ectopic cardiac fat and hepatic fat by ultrasound have been developed and validated. 9,29 Epicardial fat, in similarity with central obesity, has been associated with CV disease and CV risk factors. Although there is a significant direct relationship between general body adiposity and epicardial fat amount, epicardial fat is also increased in hypertensive individuals, polycystic ovarian syndrome, type 2 diabetes mellitus (DM), and even type 1 DM associated with central obesity. 8 Similar clinical situations are combined with NAFLD, because excessive fat accumulation in the liver results in NAFLD; this condition is usually associated with visceral obesity, type 2 DM, insulin resistance, and dyslipidemia. In addition, it may represent the hepatic expression of MetS. 19,30 While LS has been considered as an traditional indicator of MetS, epicardial adipose tissue has recently been proposed to carry high cardiometabolic risk compared to general fat accumulation. 11 –13 Lipid accumulation in cardiac myocytes is also an early sign of pathogenesis of diabetic cardiomyopathy. 31
The relationship between epicardial fat and LS has previously been evaluated, 4,32 and this correlation was related to excessive visceral fat. A recent study has suggested that the presence of a complicated interaction between EFT, serum vaspin, which is a new adipokine expressed in epicardial adipose tissue, and liver fibrosis promotes impaired hyperemic stimulation of coronary artery flow reserve in patients with NAFLD. 33 Our study suggests that echocardiographic EFT is a better predictor of ultrasound-measured NAFLD in MetS than BMI or WC. Because epicardial fat and fatty liver represent organ-specific ectopic fat accumulations that reflect visceral adiposity, they may share similar biochemical properties. Epicardial fat tissue has peculiar endocrine and paracrine functions that affect the cardiac ANS. 10 –12 Free fatty acid (FFA) release from adipose tissue and epicardial fat are the greatest stores of FFA. High plasma FFA level can stimulate ANS of the heart through a rise of plasma catecholamine concentrations. 1 Considering that accumulation of triglycerides around the myocardium and liver is related to FFA exposure, NAFLD may also be related to autonomic dysregulation in patients with MetS. However, the inter-relationship among epicardial fat, NAFLD, and cardiac autonomic function remains unclear.
Both sympathetic activation and parasympathetic withdrawal lead to an increase of HR while exercise. Considering the prognostic meaning of attenuated parasympathetic tone at rest, 34 abnormal HRR after exercise is related with parasympathetic insufficiency and increased CV mortality risk. 14,15,34,35 HRR may be cost-effective for risk assessment in routine clinical practice because it is simple to evaluate from standard exercise tests in contrast to 24-hr Holter monitoring. In our results, epicardial fat was thickest and HRR was lowest in the MetS with NAFLD group. Interestingly, EFT and HRR had significant correlation with NAFLD severity stratified by ultrasound score. Moreover, EFT and NAFLD were independent predictive factors of impaired HRR in patients with MetS. These results suggest a relation among epicardial fat, LS, and autonomic dysfunction in MetS. In addition, we also found a significant link between exercise capacity and EFT in our study. In view of the prognostic importance of impaired HRR and exercise capacity, these results suggest that EFT plays a role in development of adverse CV outcomes in MetS. However, the prognostic impacts of blunted HRR in the current study population, who participated in a health checkup, are beyond the scope of this study. Instead, we emphasized the clinical implications of our data.
There are several limitations to our study. First, we tried to avoid the effect of ischemia after end of the exercise test by exclusion criteria such as patients with a history of heart failure, coronary artery revascularization, or a positive exercise test. However, the exclusion of CAD was simply evaluated by exercise test, and additional stress-imaging studies were not conducted. Second, our study was performed at a single tertiary-care health-screening center; potential biases with respect to study population sampling may have existed. Finally, because antihypertensive drugs might have a significant influence on BP and HRR, sensitivity analysis for the binary regression analysis according to the current history of antihypertensive medications was performed to consider possible confounding effects on BP and HRR. However, the results did not vary.
In conclusion, EFT was greatest in MetS patients with NAFLD, and impaired HRR was observed in NAFLD patients. EFT and NAFLD were significantly correlated with HRR in patients with MetS. Therefore, they may be most highly related to increased CV risk. These results suggest a relationship among epicardial fat, NAFLD, and cardiac autonomic dysfunction in MetS. Future research will be needed to clarify the association between EFT and adverse CV outcomes in patients with impaired HRR.
Footnotes
Author Disclosure Statement
No conflicting financial interests exist.