
Abstract
Aims:
This study aimed at detecting the difference of metabolic profile in mild gestational diabetes mellitus (GDM) patients, and at identifying the correlation between the disturbed metabolites and insulin resistance pathway induced by the inflammation factors secreted by the placenta and adipocytes.
Materials and Methods:
Blood samples were collected from 36 pregnant women diagnosed with mild GDM and 36 normal glucose-tolerant (NGT) pregnant women. Metabolic profiles were acquired by using proton nuclear magnetic resonance (1H-NMR) spectroscopy, and the data were analyzed by multivariate statistical data analysis. The messenger RNA (mRNA) expression of CX3CL1, CD14, and CD86 in placenta and omental adipose tissues was detected by quantitative real-time polymerase chain reaction.
Results:
(1) Weight and body mass index in GDM group were remarkably higher at both pre-pregnancy and delivery than those in the NGT group. The levels of fasting blood glucose, insulin, and homeostasis model assessment-2 for insulin resistance in GDM group were also significantly higher than those in the NGT group. (2) The expression of mRNA of CD86 was significantly higher in placenta of GDM patients. However, the gene expression of CX3CL1 and CD86 in omental adipose tissues of GDM was markedly lower as compared with the control group. (3) The GDM group exhibited severely perturbed glucose metabolism, fatty acid metabolism, amino acid metabolism, and activated inflammatory response.
Conclusions:
The 1H-NMR-based metabonomics approach together with biochemical assay and the mRNA expression analysis provided metabolic information about mild GDM, which indicated disturbed glucose metabolism, fatty acid metabolism, amino acid metabolism, and activated inflammatory response in mild GDM patients. This integrated study provides a new idea and methods to understand underlying mechanisms of mild GDM in clinics.
Introduction
G
As a metabolic disorder, GDM is of some characteristics similar to obesity and type 2 diabetes. 8,9 It occurs when β cells fail to provide sufficient insulin demands or insulin resistance (IR). 10 The pathogenesis of IR in GDM has not been fully understood. It probably involves the activation of inflammatory response within metabolic and endocrine tissues. 11 –13 During inflammation, macrophage and monocyte infiltrate in the placenta and omental adipose tissue, 14 –16 resulting in increased expression of monocyte and macrophage markers, such as CD86, CD14, and CX3CL1. 16,17 Cytokine secretion in placental and omental adipose tissue might induce inflammation and trigger IR. 16,18 In addition, pregnancy complications still often occurred among part of gestational diabetes patients even if the blood glucose level was satisfactorily controlled. 19 Therefore, it is critical to investigate the relationship between the inflammatory status of placenta and omental adipose tissue and IR in mild GDM.
Metabolomics has been an important tool for diabetes research. 19 –21 Unlike genomics, transcriptomics, and proteomics, metabolomics probes low-molecular-weight metabolites in tissues or biofluids, 22 –24 and it can determine the changes of metabolites in response to pathological events. 25 Nuclear magnetic resonance (NMR)-assisted metabolomics, as a non-destructive and high-throughput “omics” tool, makes it highly applicable for disease diagnosis, progression, and prognosis. 25 –27
The metabolome of blood sample can well represent the whole status of the body. In this study, plasma samples from 36 mild GDM patients and 36 normal glucose-tolerant (NGT) pregnancies were collected. 1 H NMR-assisted metabolic analysis combined with biochemical analysis was applied to determine the metabolites in plasma of the mild GDM group and the control group. CD86, CD14, and CX3CL1 messenger RNA (mRNA) expression in placental and omental adipose tissue was used to uncover the inflammatory status of both groups. The aim of this study was to investigate metabolic changes in mild GDM patients and to provide a better understanding of the initial stage of GDM.
Materials and Methods
Study population and experimental design
All subjects were recruited from the department of obstetrics, the first affiliated hospital of Nanjing Medical University, China. GDM was diagnosed according to the International Association of Diabetes and Pregnancy Study Groups (IADPSG). 28 Women who had multiple pregnancies and any adverse medical conditions (i.e., including asthma, pre-gestational diabetes, heart disease, and pre-eclampsia) were excluded. GDM patients who were admitted on insulin or glucose controlled unsatisfactorily were also excluded. Finally, 72 pregnancy women with singletons who selected cesarean section for delivery between January and July 2012 were recruited, including two groups of mild GDM (n = 36) and NGT (n = 36). Women in the NGT group had a negative screening result used as a control. Indications of cesarean section included abnormal fetal position, repeat caesarean section, or cephalopelvic disproportion.
This trial was registered with the Ethics committee of the first affiliated hospital of Nanjing Medical University (No. 2013SR061). Written informed consent to participants in the study was obtained from each individual before recruitment.
Demographic data and sample collection
All pregnant women were fasted overnight, and cubital venous blood samples were collected into ethylenediaminetetraacetic acid-prepared tubes before cesarean section. Then, the plasma was obtained by centrifugation (12,000 rpm, 10 min, 4°C) and stored at −80°C before analysis.
Placenta (maternal side) and omental adipose tissues were collected from each pregnant woman during operation, ∼1 cm3 in volume. Tissues were quickly frozen in liquid nitrogen and stored at −80°C until use for quantitative real-time polymerase chain reaction (qRT-PCR).
Blood biochemical analysis
Fasting blood glucose (FBG) concentrations were measured by the Olympus AU2700 fully automatic biochemical analyzer. Fasting insulin (FIN) and C-peptide were assayed by the electrochemiluminescence technique (Roche, Germany). IR was calculated by using the homeostasis model assessment for insulin resistance (HOMA-IR) method, where HOMA-IR = FBG (mmol/L) × FIN (μU/mL)/22.5.
RNA extraction and qRT-PCR
Total RNA of placenta and omental adipose tissues were isolated by using Trizol reagent (Invitrogen, Carlsbad, CA) according to the manufacturer's recommendations. The concentrations and purities of RNA were assessed by NanoDrop® ND-1000 spectrophotometry (Thermo Scientific, Rockford, IL). According to the manufacturer's instructions, 1 μg of total RNA was converted to complementary DNA by using the Primescript™ RT Master Mix (Takara Bio, Inc., Otsu, Shiga, Japan). qRT-PCR was performed with LightCycler 480 (Mannheim, Germany) by using the SYBR green qRT-PCR mix (Takara Bio, Inc.) according to the manufacturer's protocol. The sequences of primers used for qRT-PCR were designed and synthesized by Invitrogen as shown in Table 1.
1 H-NMR spectroscopy
Before the NMR study, 300 μL of each plasma sample was added to 300 μL D2O phosphate buffer [0.2 mol L−1 Na2HPO4 and 0.2 mol L−1 NaH2PO4, pH 7.4, including 0.05% 3-trimethylsilylpropionic acid (TSP)]. The samples were mixed and centrifuged at 12,000 g for 10 min at 4°C, and then, the supernatants were placed in a 5 mm wide NMR tube for NMR analysis.
1 H-NMR spectra were recorded on a 500 MHz flow-injection NMR spectrometer (Bruker AV500 spectrometer; Bruker, Karlsruhe, Germany) at 300K. The Carr-Purcell-Meiboom-Gill spin-echo pulse sequence (RD-90°-(τ-180°-τ)n-ACQ) with a total spin-echo delay (2nτ) of 40 ms was used to suppress broad signals from macromolecules (i.e., proteins or lipoproteins). 16 A total of 128 scans were collected in 32K data points over a spectral width of 10,000 Hz for each 1 H-NMR spectrum. Before Fourier transformation, a line broadening of 0.5 Hz was applied to the free induction decays. All plasma 1 H-NMR spectra were referenced to TSP (CH3, δ 0.0), followed by manual phase and baseline correction by using Topspin 3.0 software (Bruker GmbH).
Data processing and analysis
All
1
H-NMR spectra were exported to ASCII files by using MestReNova (Version 8.0.1; Mestrelab Research S.L.), which were then imported into “R” (
Spectral data were first analyzed by an unsupervised principal component analysis (PCA) to give an overview of the metabolic patterns and trends, and to detect any outliers among samples. However, no obvious separation was observed in the PCA score (data not shown). A supervised orthogonal partial least-squares discriminant analysis (OPLS-DA) was used to maximize covariance between the measured data and the response variable. 30 The OPLS-DA method was built by using an orthogonal filter to remove systematic variations unrelated to interested status.
The scores plots displayed the patterns of samples, and the corresponding loading plots were used to reveal variables contributing to grouping. The loadings plot were color coded according to the absolute value of the coefficient values: The warm-colored (e.g., red) metabolites were more significant than the cold-colored (e.g., blue) ones. A repeated two-fold cross validation and 2000 times permutation test were used to further validate the OPLS-DA modes. The validity of the models avoiding over-fitting was assessed by the parameter R 2 , and the predictive ability was described by Q 2 .
Statistical analysis
The differences between GDM and NGT groups were evaluated by a parametric Student's t test or nonparametric Mann–Whitney test (according to the conformity of the data to normal distribution). A P value of ≤0.05 was considered statistically significant. The fold change (FC) values of metabolites and their associated P values corrected by Benjamini–Hochberg-adjusted method 31 were calculated and visualized in Table 3.
Correlation network
Correlation network of the GDM group was built by using the R package igraph. In the network, metabolites with correlation coefficients above a threshold (0.65) are joined by solid lines that are color coded according to the correlation coefficients (a cool color for negative and a warm color for positive correlations). The nodes (framed in circle) represent metabolites or other parameters, and the dotted lines represent a similar structure of connected metabolites. The names of metabolites were colored in red or blue to denote the statistically significant increase and decrease of metabolites as compared with the NGT group, respectively.
This improved correlation network presents both the Pearson's correlation coefficients among the levels of metabolites and their structural similarity. Pearson's correlation networks generally show only the links between metabolites with diverse status. But, such correlations do not show causal connections. The addition of structural similarity information improves the networks since the substrates and products of nearly all of the represented biochemical reactions should be analogous. In this context, a high correlation between metabolites with a high structural similarity might demonstrate a theoretically conceivable biochemical reaction between them and, consequently, a causative effect.
Correlation network between metabolites and other parameters
To integrate metabolites and other parameters including IR, all data were subjected to canonical analysis with the metabolites as X variables and other parameters as Y variables. The nodes in the network denote metabolites and the related parameters, and the colored lines between the nodes represent a correlation between them (red and blue means positive and negative correlation, respectively).
Shared and unique structure plot
In the shared and unique structure (SUS) plots, the metabolites scattered across the red dotted line represent those that were positively correlated (++/−−) and those scattered across the green dotted line represent those that were negatively correlated (±/±). Those that are found in the red boxes across the plot axes are either positive or negative for that particular model and represent the “unique structures.” It was also important to note that metabolites that were on the extreme ends of the axes contribute more significantly than those close to the center.
Results
Demographic and biochemical analysis
Demographic data and biochemical analysis of the two groups are summarized in Fig. 1. Compared with the NGT group, the levels of weight and body mass index (BMI) in the GDM group were remarkably high, at both pre-pregnancy and delivery. The levels of FBG, 1 hr OGTT (oral glucose tolerance test), 2 hr OGTT, FIN (fasting insulin), and HOMA2-IR in the GDM group were significantly high as compared with the NGT group. No differences were detected in maternal age, height, BMI gain, systolic and diastolic blood pressure, blood glucose, fasting C-peptide, gestational age, and fetal weight between GDM cases and controls.

Boxplots for age, height, pre-pregnancy weight, pre-pregnancy BMI, pre-delivery weight, pre-delivery BMI, BMI gain, systolic blood pressure and diastolic blood pressure, FBG, 1 hr OGTT, 2 hr OGTT, blood glucose, FIN, HOMA2-IR, C-peptide, gestational age, and fetal weight. The bottom of each box, the line drawn in the box, and the top of the box represent the first, second, and third quartiles, respectively. The whiskers extend to 1.5 times the interquartile range (from the first to third quartile). Data in top represent the P values. BMI, body mass index; BMI gain, BMI gain during pregnancy; FBG, fasting blood glucose; FIN, fasting insulin; HOMA2-IR, homeostasis model assessment-2 of insulin resistance; 1 hr OGTT, 1-hour oral glucose tolerance test; 2 hr OGTT, 2-hour oral glucose tolerance test. Color images available online at
Expression of CX3CL1, CD14, and CD86 mRNA in placenta and omental adipose tissue
The mRNA expression of CD86 (an indicator of macrophage and monocyte infiltration) was significantly higher in placenta of the GDM group than that in the NGT group. The mRNA levels of CX3CL1 and CD14 in placenta of the GDM group were slightly higher. However, the mRNA expression of CX3CL1 and CD86 in omental adipose tissues of the GDM group was lower than that in the control group (Table 2).
GDM, gestational diabetes mellitus; NGT, normal glucose tolerant.
1 H-NMR spectra analysis
Representative
1
H-NMR spectra of plasma samples from control and GDM groups with major metabolites labeled are shown in Fig. 2. Resonances were assigned according to database querying (Madison:
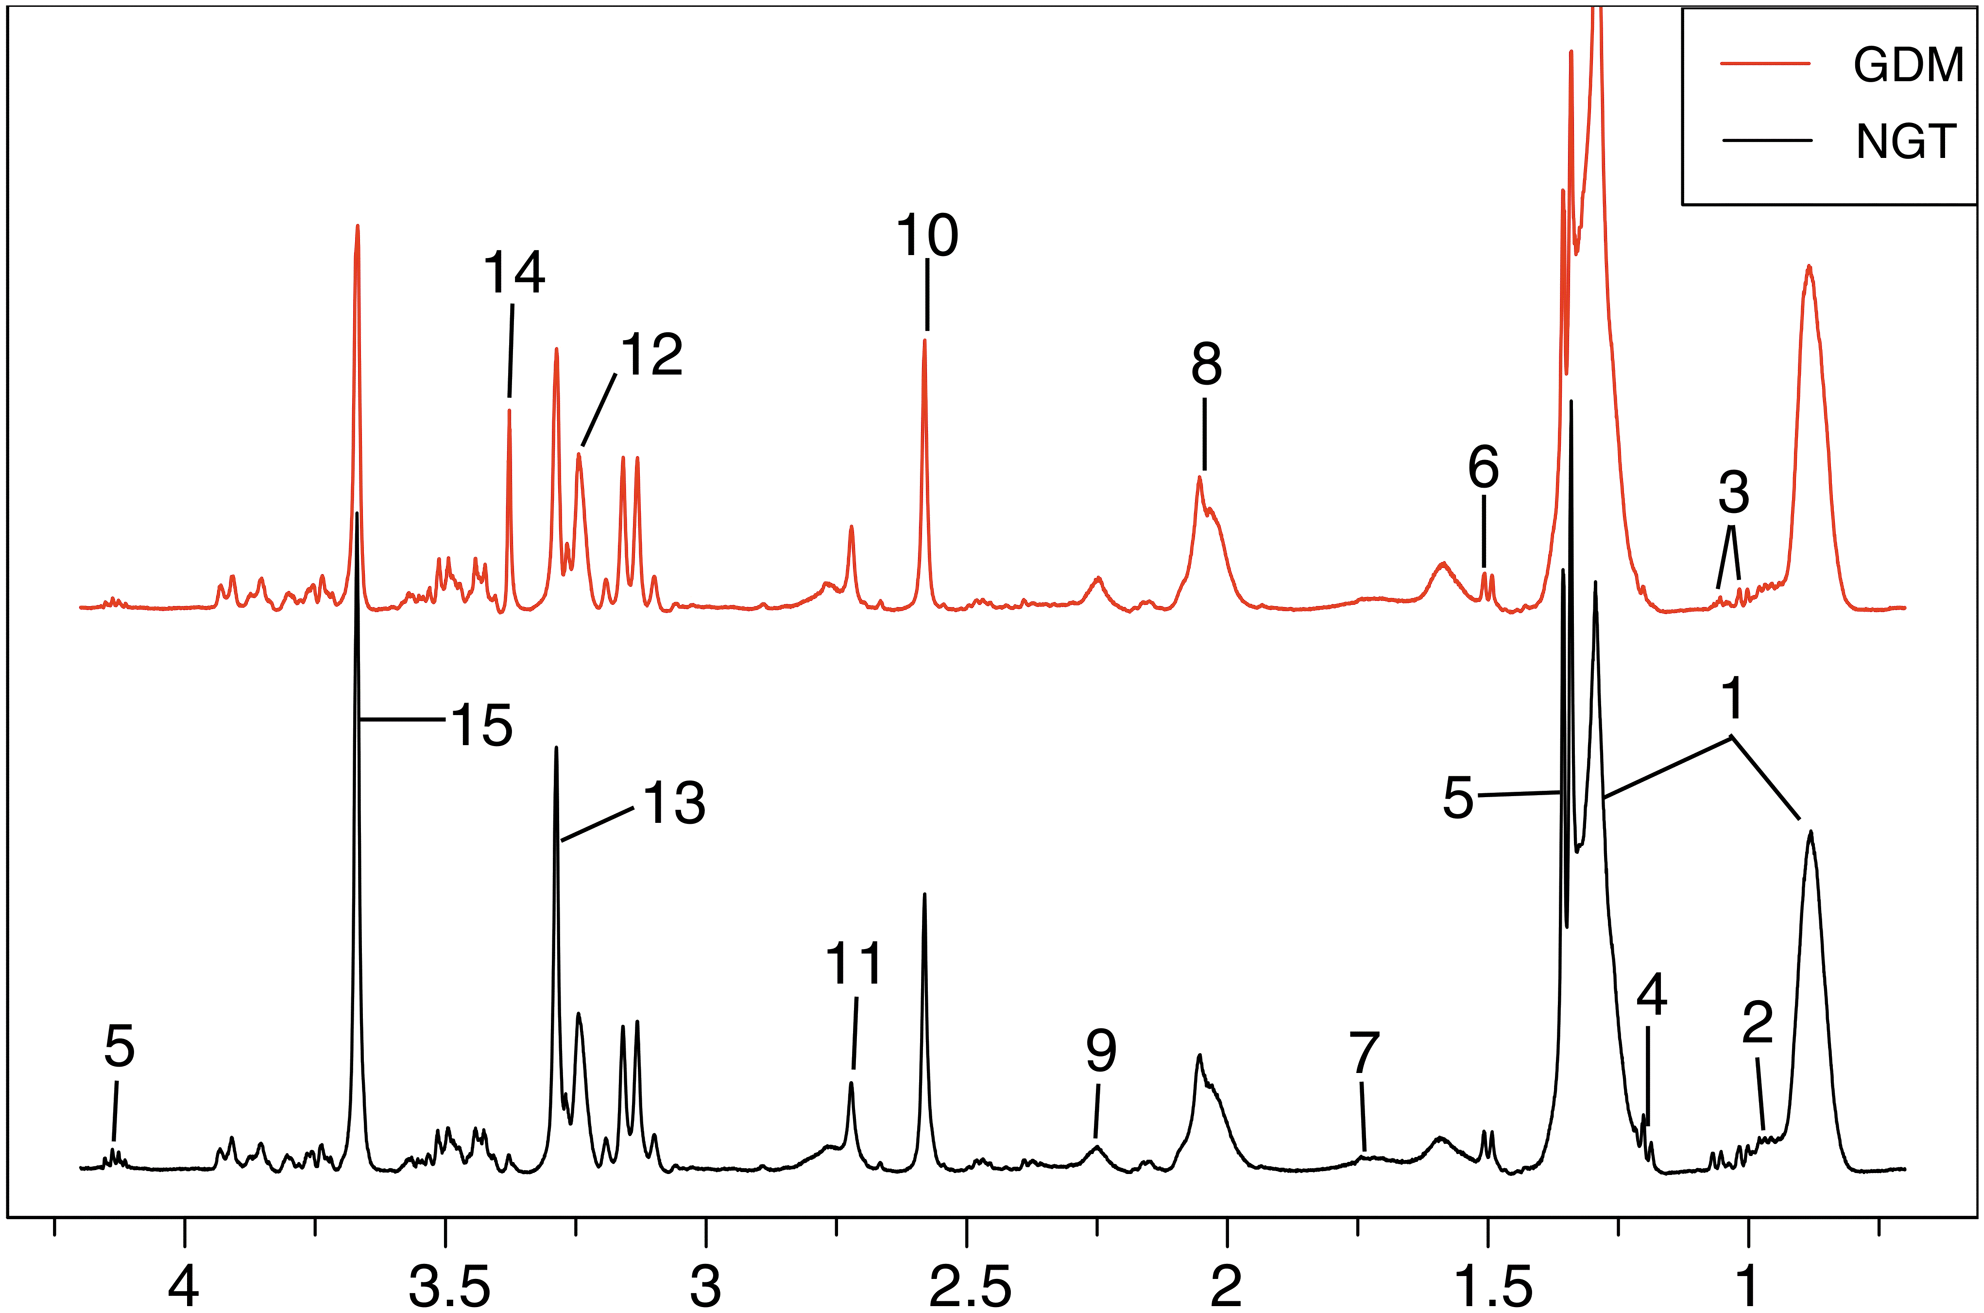
Typical 500 MHz
1
H-NMR spectra of plasma samples obtained from the NGT group (black line), GDM (red line) pregnant women. Metabolites: 1. LDL/VLDL, 2. Leucine/isoleucine, 3. Valine, 4. 3-Hydroxybutyrate, 5. Lactate, 6. Alanine, 7. Arginine, 8. Pyruvatoxime, 9. Acetoacetate, 10. Pyruvate, 11. Creatinine, 12. Trimethylamine N-oxide, 13. GPC, 14. Triethanolamine, 15. Glycerol-3-phosphate. GDM, gestational diabetes mellitus; GPC, glycerophosphorylcholine;
1
H-NMR, proton nuclear magnetic resonance; LDL/VLDL, low-density lipoprotein/very low-density lipoprotein; NGT, normal glucose tolerant. Color images available online at
Metabolic changes in GDM group
In the scores plot (Fig. 3A), the two groups were well separated from each other. The corresponding loadings plot and S-plot (Fig. 3B, C) revealed increased levels of low-density lipoprotein/very low-density lipoprotein (LDL/VLDL), pyruvatoxime, arginine, acetoacetate, and triethanolamine, and decreased levels of leucine/isoleucine, valine, 3-hydroxybutyrate, lactate, alanine, pyruvate, creatinine, trimethylamine N-oxide, glycerophosphorylcholine (GPC), and glycerol-3-phosphate in the GDM group. The OPLS-DA models revealed significant variations among groups (Fig. 3D) and were validated by a repeated twofold cross-validation and 2000 times permutation test (Fig. 3E). The corresponding FC plots and table are shown in Fig. 3F and Table 3, respectively.

OPLS-DA scores plot
Color coded according to log2 (fold change) using color bar  . A p-value of p ≤ 0.05 was considered statistically significant. Multiplicity: s, singlet; d, doublet; t, triplet; q, quartet; m, multiplet.
GPC, glycerophosphorylcholine; LDL/VLDL, low-density lipoprotein/very low-density lipoprotein; TMAO, trimethylamine N-oxide.
Correlation network of differential metabolites in GDM group
To evaluate the relations of metabolites, a correlation network analysis of the GDM group (Fig. 4) was performed by using the R package igraph. Located in the center of the network, acetoacetate shows its significance in GDM patients, whose glucose utilization is greatly hampered. Acetoacetate is one of the ketone bodies that could be used as an important energy material to supplement insufficient energy supply in the GDM group. LDL/VLDL, another important energy material, can be oxidized to afford energy and rescue energy crisis, so LDL/VLDL is positively correlated to acetoacetate.

Correlation network analysis of the GDM group, performed by using the igraph R package. The nodes (framed in circle) represent metabolites, and correlations above a threshold (0.65) are shown to be connected by solid colored lines (color coded according to the correlation coefficients, a cool color for negative and a warm color for positive correlations). The dotted lines represent the compounds of a similar structure. Color images available online at
Branched-chain amino acids (BCAAs) (valine, leucine, and isoleucine) act as the essential amino acids that play an important role in body protein synthesis, which showed strong mutual positive correlations in the correlation network. Arginine is strongly and positively correlated with pyruvate, and they are known to have a close relationship in a biochemical reaction. Arginine is a glycogenic amino acid and can be used to synthesize glucose that is further decomposed into pyruvate. Our results demonstrated that the energy and amino acid metabolism might be perturbed in GDM pregnant women.
Correlation network between metabolites and other parameters
Several important parameters were filtered out, including IR-related parameters 1 and 2 hr OGTT; and risk factors such as BMI and weight (Fig. 5).

The correlation network of differential metabolites and other parameters in plasma. The network is graphically represented with metabolites and other parameters as nodes, and the colored lines indicate correlations (red for positive and blue for negative correlations, color coded according to the correlation coefficients). Only correlations with absolute values of correlation coefficients that exceeded 0.6 were kept. Color images available online at
SUS plot analysis
The whole data were subdivided into different subset data, cut in half to afford young and old halves, and low and high halves for age and BMI, respectively. Metabolomics analyses were made on these subset, which were compared with the results obtained on the whole data by SUS analysis.
The SUS plots revealed most metabolites distributed near the red dotted line, indicating that the results of these metabolite changes were mostly independent of age, pre-pregnancy BMI, pre-delivery BMI, and BMI gain during pregnancy (Fig. 6). Only few metabolites, such as GPC and glycerol-3-phosphate in Fig. 6F, were found unique metabolites for pre-delivery BMI. For the unique metabolites, their levels in subgroups were visualized by boxplots (Fig. 6).

The SUS plots of plasma show the shared and unique correlation metabolites.
The levels of GPC and glycerol-3-phosphate in the GDM group were significantly lower than the NGT group in the high half of pre-delivery BMI divided subset data, but not significant in the low half, which suggested that the decreases of GPC and glycerol-3-phosphate were strongly associated with high pre-delivery BMI GDM patients. As an important gluconeogenesis intermediate, the pre-delivery BMI-dependent change of GPC might suggest that glucose absorption and utilization capacity in GDM patients with high pre-delivery BMI was weaker than those with low pre-delivery BMI. Glycerol-3-phosphate is an intermediate of glycolysis; its pre-delivery BMI-dependent change suggested that GDM patients with high pre-delivery BMI are prone to undergo insufficient energy supply.
Discussion
In this study, a 1 H-NMR-based metabolomics approach was used to study the plasma metabolic profile change associated with GDM, which revealed obvious pattern differences between GDM and NGT groups. Significant perturbations in energy metabolism, amino acid metabolism (isoleucine, leucine, valine, and arginine), as well as inflammatory response were observed in GDM patients. The disturbed metabolism in GDM pregnant women was also investigated by biochemical analysis and mRNA expression.
IR may play an important role in the process of GDM, whereas the pathogenesis of GDM is still unclear. 33,34 Several biochemical parameters were measured to evaluate the status of insulin, including HOMA2-IR, FIN, and C-peptide. HOMA2-IR, an index of IR, can be used to predict GDM. 35 FIN also can be used to evaluate insulin sensitivity. 36 The levels of HOMA2-IR and FIN were noticeably elevated in the GDM group, demonstrating that insulin sensitivity was significantly reduced in GDM patients and the bodies could not utilize glucose efficiently.
C-peptide is a peptide that is made when proinsulin is split into insulin and C-peptide. The plasma concentrations of C-peptide may provide insights into β cell function. 37 In our study, the level of fasting insulin in mild GDM increase was not accompanied by the level of fasting C-peptide increase, which could be explained by reduced insulin clearance (reflecting hepatic IR) rather than β cell dysfunction. 38 In most individuals, IR and obesity or higher BMI coexist. The significantly increased weight and BMI in both pre-pregnancy and pre-delivery were observed in the GDM group, indicating that high weight and BMI were risk factors of GDM. Pregnancy overweight and obesity can cause GDM. 32,39 –41
Metabolic analysis indicated that GDM severely perturbed glucose metabolism and fatty acid metabolism, revealing that energy metabolism was disturbed in GDM patients. Compared with the NGT group, levels of glycerol-3-phosphate, lactate, leucine, isoleucine, and valine were markedly decreased in GDM patients. Glycerol-3-phosphate, a glycolysis intermediate, is synthesized by reducing dihydroxyacetone phosphate with glycerol-3-phosphate dehydrogenase. The decrease of glycerol-3-phosphate in the plasma suggested that the production of glycerol-3-phosphate was inhibited. In addition, a notable decrease of lactate, the anaerobic products also indicated that the glycolysis process was inhibited in GDM patients. The insufficient glucose metabolism in the GDM group may be due to the impaired glucose uptake and utilization caused by IR.
To supplement the insufficient energy source, fat fatty acid β oxidation comes to the rescue in GDM patients. The high levels of FBG, 1 and 2 hr OGTT indicate IR or impaired β cell function, leading to an increased risk of diabetes. In the correlation network, triethanolamine exhibited strong positive correlations with 1 and 2 hr OGTT, demonstrating its important role in mild GDM. Triethanolamine was conspicuously increased in the GDM group as compared with the NGT group. Triethanolamine is a precursor of acetaldehyde, which is one important intermediate in the process of glycolysis. The marked increase of triethanolamine suggested that the bioconversion of triethanolamine to acetaldehyde might be blocked, thus contributing to the aggravated energy crisis of the mild GDM group.
The increased levels of lipids (LDL/VLDL) and acetoacetate showed that fat fatty acid β oxidation was accelerated in the GDM group. The increased LDL/VLDL in the GDM group indicated accelerated fat mobilization to produce fatty acids for β oxidation. Acetoacetate was the metabolite of fatty acid β oxidation and could be transformed to acetyl-CoA for the TCA cycle, which could also come to rescue the insufficient energy supply. Glycerol-3-phosphate could be synthesized by fats with glycerol kinase; the significantly deceased glycerol-3-phosphate also indicates an increase in fatty acid β oxidation to supply energy.
GDM is defined as glucose intolerance with onset or first recognition during pregnancy that can disorder glucose metabolism. 42,43 IR leads to insufficient supply of glucose, and the bodies need to improve endogenous glucose production by gluconeogenesis. Alanine is a major glycogenic amino acid that can be used for gluconeogenesis to produce glucose. Compared with the NGT group, the decrease of alanine in the GDM group demonstrated its great consumption for gluconeogenesis. In Fig. 5, the levels of branched-chain amino acids (isoleucine, leucine, and valine) were negatively correlated with pre-pregnancy weight and pre-pregnancy BMI. As important risk factors for GDM, 44,45 high pre-pregnancy weight and BMI were markedly elevated in the GDM group.
As glycogenic amino acids, BCAAs are important for the maintenance of glucose homeostasis. 46 BCAAs can decomposed in skeletal muscle and transferred to liver by blood, and then produce alanine via a range of transamination. 47 Finally, the produced alanine was used to maintain the levels of glucose. The significantly decreased levels of BCAAs might be utilized to replenish the diminished glucose in GDM patients who have higher pre-pregnancy weight and BMI than NGT pregnancies. GPC, a precursor of glycerophosphate, is converted to glycerophosphate under glycerophosphocholine phosphodiesterase. 48 Further, glycerophosphate plays an important role in gluconeogenesis. The markedly decreased levels of GPC could be explained as a consequence of the enhanced gluconeogenesis. 49
The pathogenesis of IR among GDM involves the triggering of low-grade inflammation. 50 –52 Omental adipose tissue and placenta are believed to be important contributors to inflammatory transcriptomes. 16 CD86 encodes the corresponding protein expressed in antigen-presenting cells, which provides costimulatory signals that are necessary for T cell activation and survival. The mRNA expression of CD86 was conspicuously decreased in adipose tissue of the GDM group, indicating the disruption of T cell homeostasis. The impaired T cell activation resulted in adipose inflammation enhancement that was also reported in type 2 diabetes. 53 The stimuli generated by the low-grade inflammation of obese women will challenge the placenta to develop an anti-inflammatory response. 16
Compared with the NGT group, the expression of mRNA of CD86 was significantly higher in placenta of the GDM group than the NGT group, demonstrating that placental tissue accelerated T cell activation to strengthen the immune response for resisting inflammation. 16,30,54 It is reported that the administration of BCAAs could attenuate inflammation. 55 Therefore, the decreased BCAAs in the GDM group might be ascribed to their use to fight inflammation. 56
In this study, the 1 H-NMR-assisted metabolomics approach together with biochemical assay and the mRNA expression analysis was first used to estimate the pathogenesis of GDM. These findings indicated disturbed glucose metabolism, fatty acid metabolism, amino acid metabolism, and activated inflammatory response in mild GDM patients.
Footnotes
Acknowledgments
This study was supported by the Natural Science Foundation of China (grant no. 81270710), Jiangsu provincial Science and Technology Projects (grant no. XK201112). The authors thank everyone who helped with this study.
Compliance with Ethical Standards
This study was conducted with the guidance of the Helsinki Declaration and the International Conference on Harmonization-Good Clinical Practices (ICH-GCP), and it was approved by the Ethics Committee of The First Affiliated Hospital of Nanjing Medical University, China.
Author Disclosure Statement
No conflicting financial interests exist.