
Abstract
Background:
While studies to date have shown that children and adolescents who meet the current physical activity (PA) recommendations and maintain a healthy body weight demonstrate significantly lower cardiometabolic risk, there are some studies that suggest that the relationship between PA and metabolic risk may be mediated by adiposity. The aim of the present study was to examine variation in clustered metabolic risk (cMetS) in adolescents classified as not overweight/active (NOA), not overweight/not active (NONA), overweight/active (OA), and overweight/not active (ONA).
Methods:
The sample included adolescent participants (n = 875; 12–17 years) of the 2007–2012 National Health and Nutrition Examination Survey (NHANES). The cMetS score included triglycerides, high-density lipoprotein cholesterol, fasting plasma glucose, and mean arterial pressure. Age- and sex-specific body mass index (BMI) percentiles were utilized; overweight was defined as BMI percentile ≥85th. Activity data included self-reported frequency of moderate-to-vigorous PA. Adolescents reporting ≥60 min/day of PA were considered “active.” General linear models, adjusted for age, sex, and race-ethnicity, were used. A 6-year fasting sample weight was applied to the analyses to ensure representativeness of the data.
Results:
The cMetS scores were significantly (P < 0.05) higher in OA and ONA adolescents compared to NOA (β = 1.08 and β = 1.57, respectively). In ONA males, cMetS was significantly (P < 0.01) higher compared to NOA males. In OA and ONA females, cMetS scores were significantly higher compared to the referent group (P < 0.01 for both).
Conclusions:
The cMetS scores were increased in overweight adolescents compared to those who were not overweight, regardless of their reported activity level.
Introduction
H
Clustered metabolic risk (cMetS) score is often represented by a continuous z-score, which commonly takes into account CVD risk factors, such as the components of MetS. PA and healthy body weight have both been shown to be independently correlated with lower metabolic risk in all age groups. 5,13 –18 While studies to date have shown that children and adolescents who meet the current PA recommendations and maintain a healthy body weight demonstrate significantly lower cardiometabolic risk, 5,13 –16 there are some studies that suggest that the relationship between PA and metabolic risk may be mediated by adiposity. 17,18 Recent literature suggests that approximately three out of four adolescents are currently meeting the federal PA recommendation. 19 To our knowledge, the combined impact of PA and body mass index (BMI) on the cMetS score is yet to be examined in an analysis using a nationally representative sample of U.S. adolescents. The present study will add to existing literature by potentially identifying an important public health focus (PA, adiposity, or both) by uniquely categorizing adolescents into mutually exclusive groups based on weight status and whether or not they meet the current PA guidelines. The study also aims to determine whether the identified health focus should differ depending on sex.
Materials and Methods
This study utilized 6 years of data from the 2007–2012 National Health and Nutrition Examination Survey (NHANES), a continuous survey conducted by the National Center for Health Statistics. 20 The NHANES is a stratified multistage probability sample of the civilian noninstitutionalized population of the United States. The sample included adolescents 12–17 years of age who attended the morning examination session in the mobile examination center (MEC) following a minimum overnight fasting period of 9 hrs. The study included males (n = 450) and nonpregnant females (n = 425) who had complete data on all variables of interest. The original 2007–2012 NHANES dataset included a total of 2,944 participants between the ages of 12 and 17. After applying a 6-year fasting weight, the sample size decreased to 1,156. Additional adjustments removing those with missing data for the PA questionnaire, BMI, TG, HDL-C, FPG, and mean arterial pressure (MAP) resulted in a final analytic sample of 875 adolescents.
Physical activity
PA level was determined using self-report interview data. 21 For participants 16 years of age and older, the questions were asked in their home by trained interviewers using the Computer-Assisted Personal Interviewing (CAPI) system. Participants aged 12–15 were interviewed in the MEC by trained interviewers using the CAPI system. Proxy respondents were not required for any of the 2007–2012 NHANES participants aged 12 years and older. The sample provided responses to the PA questionnaire file items PAQ 670 (“In a typical week, on how many days {do you/does SP} do moderate-intensity sports, fitness, or recreational activities?”) and PAD 675 (“How much time {do you/does SP} spend doing moderate-intensity sports, fitness, or recreational activities on a typical day?”). Responses were also provided for identical questions referring to vigorous-intensity recreational activities (PAQ 655 and PAQ 660). The NHANES PA questionnaire is an adapted form of the Global Physical Activity Questionnaire (GPAQ) developed by the World Health Organization (WHO). 22 It has been demonstrated that moderate agreement exists between the GPAQ and accelerometry-measured activity data (r = 0.48), and in a nine-country study it was concluded that the GPAQ is a generally acceptable instrument for estimating PA in population health surveillance systems. 22,23
Average minutes of moderate-vigorous PA per day were determined for each participant; this was calculated by first multiplying average minutes per day and average days per week of moderate and vigorous PA, then dividing this quantity by seven. 24 Participants were considered “Active” if their average minutes per day were ≥60 and “Not Active” if their average minutes per day were <60, which coincide with meeting and not meeting the daily federal PA recommendation for adolescents, respectively. 25
Body mass index
Weight status was determined using body mass index [BMI = (weight in kilograms)/(height in m) 2 ]. Participants were considered “Not Overweight” if BMI <85th percentile (age- and sex specific) and “Overweight” if BMI ≥85th percentile. Anthropometric data were obtained for adolescent participants in the MEC by trained health technicians. 21
Clustered metabolic risk
A cMetS score was created by standardizing and then summing the following continuously distributed cardiometabolic components to create a z-score: MAP, FPG, HDL-C, and TG. The mean and standard deviation of each variable were calculated for the entire sample. Each of these variables, with the exception of HDL-C, is directionally the same in that higher values are indicative of poorer metabolic health. Due to the fact that lower HDL-C values are considered less desirable, HDL-C z-score was inversed to match the directionality of the other variables. Ultimately, a higher overall cMetS score is indicative of poorer metabolic health. The purpose of using a continuously distributed variable is to maximize statistical power.
BPs were measured for all participants by certified BP examiners in the MEC. Participants rested quietly for 5 min, and three consecutive BP readings were obtained. The mean of the second and third BP readings was used in the analysis. Calculating MAP was done in SAS using the following equation: MAP = [(2× diastolic BP) + systolic BP]/3. Concentrations of FPG, HDL-C, and TG were measured using a Roche Modular P chemistry analyzer. 26 Blood samples during the years 2007–2010 were processed at the University of Washington, Seattle, WA. Blood samples during the 2011–2012 cycle were processed, stored, and shipped to the University of Minnesota, MN.
IRB statement
The NHANES is a deidentified publicly available dataset. The present authors did not collect any of the data to be used or interact with the survey participants. Thus, all statistical analyses were performed using an anonymous dataset. Based on this understanding, while research, this project was not human subject research, therefore did not require IRB approval.
Statistical analysis
The data were managed utilizing SAS 9.4, 27 with subsequent analyses performed using PROC SURVEYREG. Analyses were adjusted for age, sex, and race/ethnicity. Sex-stratified models were adjusted for age and race/ethnicity only. Tanner scale was not available in the dataset. Participants were classified into one of five race/ethnic groups as defined by the 2007–2012 NHANES. The categories were as follows: Mexican American, Other Hispanic, non-Hispanic white, non-Hispanic black, and non-Hispanic Other Race, including Multiracial. When subgroups of race/ethnicity were analyzed, the Mexican American and Other Hispanic subgroups were combined as per the recommendation of the NHANES analytic note citing insufficient sample size in Other Hispanic adolescents. 21 This group is identified in the present study as “Hispanic.”
A 6-year fasting sample weight was created and applied to the analyses in SAS to ensure generalizability of the results. Oversampling of specified populations in NHANES is done to improve analyses for these subgroups. Weighting of sample data is a necessary procedure which aims to produce estimates of the statistics which would have been obtained had the entire population been measured. A sample weight is essentially the measure of the number of persons represented by a single survey participant. The NHANES sample weights are designed to achieve the following objectives: (1) compensate for probabilities of selection that may differ by race and Hispanic origin, income, sex, and age; (2) reduce bias arising from the potential differences between nonrespondents and respondents; (3) adjust data to correlate with an independent U.S. 2000 Census Bureau estimate of population totals; (4) remedy potential inadequacies in the sampling frame; and (5) minimize variances in the estimation procedure by utilizing highly accurate auxiliary information. Overall and sex-stratified linear regression was performed to observe the continuous relationship between cMetS score in adolescents classified as not overweight/active (NOA), not overweight/not active (NONA), overweight/active (OA), and overweight/not active (ONA). These analyses yield standardized regression coefficients (β) to represent our data; these coefficients represent the degree and direction of change in the dependent variable compared to the referent group value.
Results
A total of 875 adolescents aged 12–17 were included in the analysis after applying the fasting weight and excluding those who did not attend the MEC, were pregnant, or were missing data on variables of interest. Within the weighted population, 48.8% were male and 51.2% were female. The adolescent population was composed of ∼58.9% non-Hispanic Whites, 19.9% Hispanics, 15.5% non-Hispanic Blacks, and 5.7% non-Hispanic Other Race, including Multiracial. Further demographic characteristics in males and females are demonstrated in Table 1.
White, Non-Hispanic White; Black, Non-Hispanic Black; Hispanic, Other Hispanic and Mexican American; Other, Non-Hispanic Other Race, including Multiracial; BMI, body mass index; participants were considered “Overweight” if their BMI was at or above the 85th percentile (age- and sex specific); PA, physical activity in minutes per day calculated as follows: (average minutes of moderate/vigorous activity per day × average days of moderate/vigorous activity per week)/7; participants were considered “Active” if their average minutes per day were at or above 60; NOA, not overweight, active; NONA, not overweight, not active; OA, overweight, active; ONA, overweight, not active.
The following estimates should be interpreted with caution due to a relative standard error of >30%.
Data presented as mean ± standard error (SE).
Table 2 illustrates the results of the regression analysis demonstrating the association between BMI/PA categorization and cMetS score, MAP z-score, FPG z-score, HDL-C z-score, and TG z-score. Note that HDL-C was inversed to match the directionality of the other variables; therefore, a higher HDL-C z-score is less desirable. The contribution of sex in the overall model was significant (P = 0.0062). The data are represented as standardized regression coefficients (β); these values indicate the average difference in the dependent variable compared to the referent group value. Overall, compared to NOA adolescents, cMetS score in those classified as OA and ONA was significantly higher (P < 0.05 and P < 0.01, respectively). On average, adolescents classified as OA and ONA have cMetS scores that are 1.10 and 1.59 U higher, respectively, compared to those classified as NOA. Only ONA adolescents demonstrated significantly higher FPG and HDL-C z-scores compared to those NOA (P < 0.01 and P < 0.05, respectively), whereas higher TG z-score was observed for the OA and ONA groups (P < 0.01 and P < 0.001, respectively). Females demonstrated significantly lower cMetS score, FPG z-score, and HDL-C z-score compared to males. Increasing age was positively related to cMetS score and MAP z-score.
Data are standardized regression β-coefficients, and outcomes are expressed as standardized z scores. All outcomes are adjusted for sex, race/ethnicity, and age.
P < 0.05.
P < 0.01.
P < 0.001.
cMetS score, clustered metabolic risk score; MAP, mean arterial pressure; FPG, fasting plasma glucose; HDL-C, high-density lipoprotein cholesterol; TG, triglycerides; BMI/PA, body mass index/physical activity; NOA, not overweight, active; NONA, not overweight, not active; OA, overweight, active; ONA, overweight, not active.
Figure 1 illustrates sex-specific effects of BMI and PA on cMetS score. While only ONA males demonstrated significantly higher cMetS score compared to the referent group of NOA males (P < 0.01), OA and ONA females' cMetS scores were significantly higher compared to NOA females (P < 0.01 and P < 0.0001, respectively).
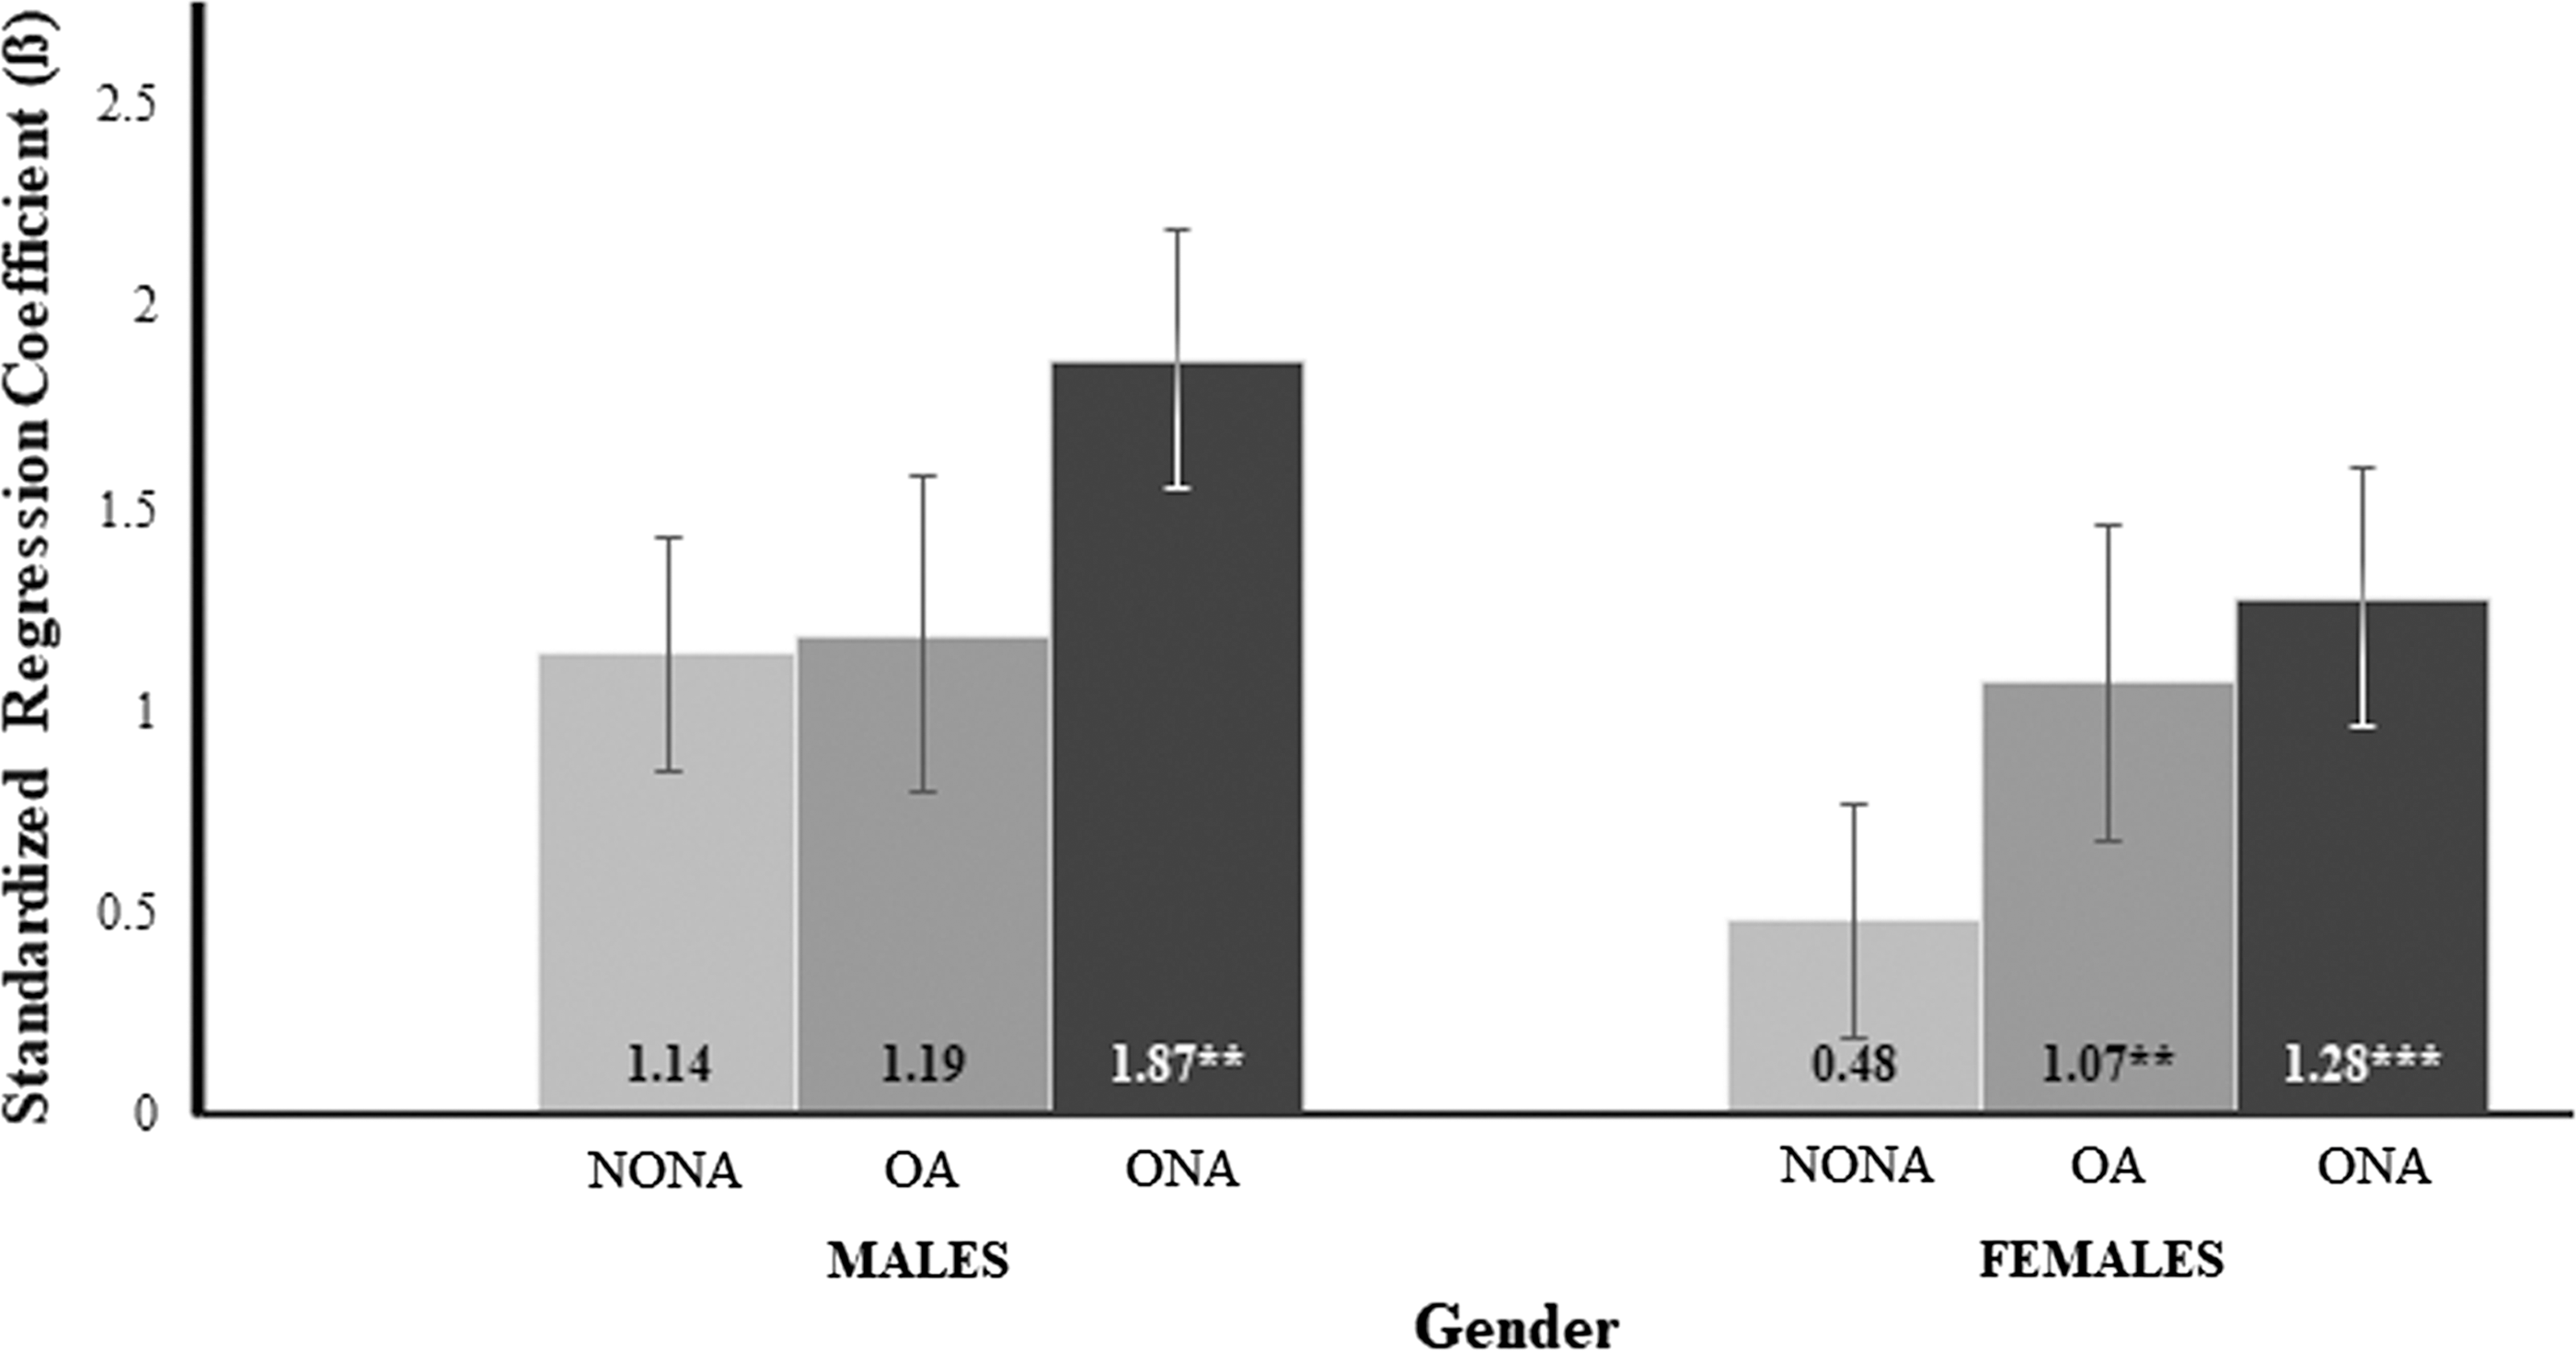
Association between BMI/PA categorization and cMetS score in U.S. Adolescents stratified by sex: NHANES 2007–2012. Data are standardized regression β-coefficients (95% CI), and outcomes are expressed as standardized z scores. All outcomes are adjusted for sex, race/ethnicity, and age. Referent group is NOA. **P < 0.01; ***P < 0.001. cMetS score, clustered metabolic risk score; BMI/PA, body mass index/physical activity; NOA, not overweight, active.
Tables 3 and 4 demonstrate the associations between categorization based on BMI and PA, race/ethnicity, and age with individual components of the cMetS score in males and females, respectively. Interestingly, while NONA and ONA males demonstrated significantly higher HDL-C z-scores compared to the referent, no significant differences were observed in females. In addition, while a significant positive dose–response relationship was observed between HDL-C z-score and age in males, the same was not observed in females. It was also observed that in ONA females only, FPG z-score was significantly higher compared to the referent. In both males and females, it was observed that MAP was positively associated with increasing age and that those OA and ONA both demonstrated significantly higher TG z-score compared to the referent.
Data are standardized regression β-coefficients, and outcomes are expressed as standardized z scores. All outcomes are adjusted for sex, race/ethnicity, and age.
P < 0.05.
P < 0.01.
P < 0.001.
Data are standardized regression β-coefficients, and outcomes are expressed as standardized z scores. All outcomes are adjusted for sex, race/ethnicity, and age.
P < 0.05.
P < 0.01.
P < 0.001.
Discussion
In a large nationally representative sample of U.S. adolescents, it was observed that those who were OA and ONA demonstrated significantly higher cMetS score compared to those who were NOA. It is thus observed that regardless of activity level, overweight classification was associated with increased metabolic risk. These results support previous literature suggesting that adiposity may mediate the existing relationship between PA and cMetS score in youth. 17,18 It should be noted that BMI is essentially a proxy for obesity, a chronic condition heavily associated with a number of unhealthy dietary and lifestyle habits. These contributors will affect the degree of one's obesity-related health risk.
A study by Väistö et al. 17 reported the independent and combined associations of PA and sedentary behavior with cardiometabolic risk in children. Their sample (n = 468) consisted of 6–8-year-old Finnish children who participated in the Physical Activity and Nutrition in Children (PANIC) Study between 2007 and 2009. Volumes and type of both habitual PA and sedentary behavior (SB) were assessed by the PANIC Physical Activity Questionnaire. These reports were further validated using the Actiheart monitor, which utilizes a combination of heart rate and accelerometer measurements; total PA measured by the questionnaire correlated positively with the total PA measured by the Actiheart monitor (r = 0.37, P = 0.033). A continuous cMetS score was derived from standardizing and summing the following risk factors: WC, insulin, FG, TG, HDL-C, and the mean of systolic and diastolic BP. While it was found that total PA volume was significantly associated with cardiometabolic risk (β = −0.135, P < 0.01), these relationships were no longer significant (β = −0.048, P = 0.232) following adjustments for body fat percentage (DXA). These findings, along with the present study, demonstrate the potentially mediating effect of adiposity on the metabolic benefits of PA.
The findings of Heshmat et al. 18 also suggest that adiposity mediates the relationship between PA and cMetS score. A cross-sectional analysis was performed in a sample of 5,625 Iranian students between the ages of 10 and 18 to examine the potential associations of PA on interactions between excess body weight and cMetS score. The sample included participants from the third survey of the Childhood and Adolescence Surveillance and Prevention of Adult Noncommunicable Disease (CASPIAN) study conducted in 2009–2010. Leisure time PA (LTPA) was assessed using a validated questionnaire, and participants were categorized according to how many days per week they participated in PA outside of school. The cMetS score included components such as WC, MAP, HDL-C, TG, and FG. It was reported that although a relationship existed between LTPA and clustered MetS components (β = 1.13, P < 0.05), adjustment for BMI and screen time resulted in the loss of statistical significance (β = 1.10, P > 0.05). It was also shown that BMI percentiles were associated with cMetS, independent of LTPA and screen time (β = 1.07, P < 0.05).
The present study also observed that only ONA adolescents demonstrated significantly higher FPG and HDL-C z-scores compared to those NOA (P < 0.01 and P < 0.05, respectively). Previous research has observed that activity may be protective of obesity-related components of metabolic risk. In 2006, Ekelund et al. 5 demonstrated that the relationship between PA and FPG in European adolescents (n = 1921) remained significant (P < 0.001) following adjustment for the sum of four skin folds. A similar significant relationship was reported in a previously discussed follow-up analysis by Ekelund et al., 14 in which FPG was inversely associated with moderate, vigorous, and total physical activity volume (TPAV) in European children and adolescents (β = −0.11, P < 0.001; β = −0.10, P < 0.001; and β = −0.11, P < 0.001 in moderate, vigorous, and TPAV, respectively). However, both of these studies observed that after adjusting for adiposity, the relationship between PA and HDL-C was no longer significant.
It was also observed in the present analysis that higher TG z-scores were observed for the OA and ONA groups (P < 0.01 and P < 0.001, respectively) compared to the referent. In a cross-sectional analysis of 5,625 Iranian students between the ages of 10 and 18, Heshmat et al. 18 observed that there was no significant association found between LTPA and TG concentration (P = 0.08). In addition, TG were significantly positively associated with BMI percentile, independent of LTPA (P < 0.001). These findings collectively suggest that regardless of activity level, adiposity is a predictor for undesirable levels of TG.
The present study observed that while only ONA males demonstrated significantly higher cMetS score compared to their respective male referent group, both OA and ONA females' cMetS scores were significantly higher compared to the referent. This suggests that in male adolescents, the mechanisms by which cMetS score is significantly increased may be different than those in similarly aged females. PA seems to be protective of an increased cMetS score in overweight male adolescents. In contrast, females demonstrated increased cMetS score when classified as overweight regardless of PA levels. In addition, while males demonstrated significantly higher HDL-C z-scores when categorized as “Not Active,” regardless of BMI, no significant differences in HDL-C were observed among females. Therefore, in males only, activity is predictive of HDL-C, regardless of weight status. A significant positive dose–response relationship was also observed between HDL-C z-score and age in males only.
Previous literature has demonstrated that in adolescents, different associations are seen between PA and HDL-C in boys and girls. Pahkala et al. 15 studied a sample of 13-year-old adolescents (n = 542) recruited from an ongoing atherosclerosis prevention study in Finland. Leisure-time activity was assessed using a self-administered questionnaire, which included questions regarding the frequency, duration, and intensity of the participant's LTPA. From these values, a PA index of metabolic equivalent hours per week (MET hr/week) was determined and used to compare adolescents who performed <5 MET hr/week of PA to those who performed ≥5 MET hr/week. The risk factors included in their cMetS score included BMI, HDL-C, TG, and systolic and diastolic BP. It was reported that in girls, LTPA was inversely associated with HDL-C only before adjusting for adiposity (β = 0.045, P < 0.05). When BMI was included in the analysis, this association did not remain significant. In contrast, LTPA had a significant beneficial effect on HDL-C following adjustment for BMI in boys (β = 0.043, P < 0.05). These results suggest that in girls only, adiposity may have a mediating effect on the significant relationship between LTPA and HDL-C, although this is not suggested by the results of the present study. However, these findings in combination with those in the present study do suggest that the mechanisms by which HDL-C is affected by PA and adiposity may be different in adolescents depending on sex. Further research should aim to study the effects of PA and BMI on individual metabolic risk factors in adolescents stratified by sex and should also seek to identify the specific mechanisms by which we observe these sex-related differences in metabolism.
The present study is not without limitations. First, due to the cross-sectional nature of the study, causality cannot be inferred. Second, due to the fact that activity levels were measured through self-report, volumes and intensities of PA are subject to recall and report bias. In addition, the cMetS score should be interpreted with caution due to the fact that the findings will only apply to a cMetS score composed of the same metabolic components (MAP, FPG, HDL-C, and TG). Stratification by sex and race/ethnicity yielded relatively small cell sizes, particularly for those classified as “Other”; these estimates should be interpreted with caution. Finally, all self-report data may be susceptible to the social desirability effect. The study design, however, also presents many strengths. The sample utilized is nationally representative, therefore offers strong external validity. The size of the sample provides increased statistical power. Bias is somewhat limited due to the fact that objective means of measurement are primarily used for the outcome variables. Finally, the cMetS score as a continuously distributed outcome measure serves to further maximize statistical strength.
In conclusion, the cMetS scores were higher in OA and ONA adolescents compared to those classified as NOA. While only ONA males demonstrated significantly higher cMetS score compared to their respective male referent group, both OA and ONA cMetS scores were significantly higher in females. To our knowledge, this is the first study to examine cMetS score among adolescents categorized by weight status and whether or not they meet the current PA guidelines.
Footnotes
Acknowledgments
This research did not receive any specific grant from funding agencies in the public, commercial, or not-for-profit sectors. The abstract from this article was published on the web site for the American College of Sports Medicine's Annual Meeting and World Congress, where it was presented in Denver, CO on June 2nd, 2017. The article has also been deposited as a chapter in a Master's thesis by the University of North Florida's Digital Commons titled, “Physical Activity, Body Mass Index, and Clustered Metabolic Risk in U.S. Adolescents: 2007–2012 NHANES.”
Author Disclosure Statement
No competing financial interests exist for all perceived authors. The work presented in this document is not under consideration elsewhere.