




Abstract
Background:
Mild obstructive sleep apnea (OSA) is a highly prevalent disorder in adults. However, it is not clear whether mild OSA has significant metabolic complications. This study examined the prevalence of metabolic syndrome (MS) in patients with mild OSA compared to control group.
Methods:
Adults (18–65 years of age) of both genders with a body mass index (BMI) ≤35 kg/m2 were included. The mild OSA group comprised of patients with an apnea–hypopnea index (AHI) score of ≥5 but ≤15 events/hr of sleep, independent of other symptoms. The control group (CG) comprised individuals with an AHI of <5 events/hr of sleep and an Epworth Sleepiness Scale score of <10. The following were used for both groups: two questionnaires on sleepiness, the maintenance of wakefulness test, and full-night polysomnography. Anthropometric measurements and fasting blood samples were obtained, including fasting glucose and insulin, total cholesterol and its subfractions [low-density lipoprotein, very low-density lipoprotein, and low-density lipoprotein cholesterol (HDL-c)], triglycerides (TG), and the TG/HDL-c ratio. In addition, the quantitative insulin sensitivity check index and homeostasis model assessment indices were calculated.
Results:
Thirty-two percent of mild OSA patients had MS, 43.5% of mild OSA patients had hypertension, 14% showed dyslipidemia, and 56% had prediabetes. The OSA group showed increased TG (CG: 90.0 ± 51.9 vs. OSA: 140.3 ± 78.2 mg/dL, P = 0.004), and TG/HDL-c (CG: 1.9 ± 1.4 vs. OSA: 3.1 ± 2.0, P = 0.05), independent of adjustments. Independent of obesity (BMI <30 kg/m2), there was a negative correlation between total cholesterol and TG with mean oxygen saturation, independent of obesity (BMI <30 kg/m2).
Conclusions:
Our findings showed dysregulation in lipid profiles after adjustments for confounders in the mild OSA group, and there was a correlation between these parameters and sleep hypoxemia. The TG/HDL-c ratio in particular was high, suggesting that it might be investigated as a marker of a detrimental metabolic profile in these patients.
Introduction
O
It is well known that the main confounder for exacerbating cardiometabolic risk in OSA is obesity. 12 In an epidemiological study, performed in Sao Paulo city (Brazil), we found obesity in 64.1% of OSA patients. 1 It is not clear whether mild OSA has an impact on CV outcomes independently of the effects of obesity. 13 –15
It also remains unclear if there is an association between mild OSA and markers of metabolic dysfunction and CV risk. 16 High triglycerides (TG) to high-density lipoprotein cholesterol (HDL-c) ratios (TG/HDL-c) have been demonstrated in moderate and severe OSA. This ratio is considered a strong marker for CV complications, and it is a convenient surrogate of insulin resistance in the general population. 15 As far as we know, this marker has not yet been studied in mild OSA.
A recent statement by the American Thoracic Society 16 suggested that there was a need to study metabolic and CV outcomes among patients with mild OSA. Although longitudinal studies have found that elevated crude associations exist between hypertension and mild OSA, 4,17 there are conflicting results, so elevated risk may be explained by differences in important confounders such as age, sex, body mass index (BMI), or baseline level of sleepiness.
Therefore, the present study aimed to analyze metabolic profiles in patients with mild OSA adjusting for the main confounders. In addition, we evaluated the prevalence of metabolic syndrome (MS) in patients with mild OSA and the correlation between intermittent sleep hypoxemia and metabolic profiles independent of obesity, as well as investigating the impact of excessive daytime sleepiness on the metabolic profile of mild OSA patients.
Materials and Methods
Recruitment of patients
This study was approved by the Ethics Committee (#91.493) of the Universidade Federal of São Paulo, and all volunteers signed an informed consent form before data collection. This analysis is part of a study registered in the Clinical Trials Database (NTC01461486) and represents part of a broader study in which continuous positive airway pressure (CPAP) and oral appliances were tested in patients with mild OSA. The participants were recruited from the Sleep Respiratory Disorders Outpatient Clinic at the Universidade Federal de São Paulo (2012–2016).
The inclusion criteria for both the OSA and control group were adults (18–65 years of age) of both genders with a BMI ≤35 kg/m2.
In the mild OSA group, patients with an apnea–hypopnea index (AHI) score of ≥5 but ≤15 events/hr of sleep were included, independent of the presence of symptoms. 18,19 The control group, with no sleep complaints, was a convenience sample (recruited from family and friends of the mild OSA group), with the inclusion criteria being an AHI <5 events/hr of sleep, a respiratory disturbance index (RDI) score ≤5, an arousal index (AI) score ≤15, and an Epworth sleepiness scale (ESS) score of <10.
Exclusion criteria included central apneas or other sleep disorders; previous OSA therapy; alcohol abuse; use of psychoactive medications or corticosteroids; and a decompensated clinical, neurological, or psychiatric disorder.
Information pertaining to medical history, medication use, and personal health habits was collected. At the Sleep Institute, questionnaires were administered and the polysomnography (PSG) was conducted. Participants went to bed at their usual bedtime. General physical measurements [body weight (kg), height (m), neck, waist, and hip (cm) circumferences] were taken immediately before the PSG hook-up following recommended procedures and using calibrated instruments. BMI was calculated as body weight divided by height squared.
Polysomnography
Both groups underwent full-night PSG in a sleep laboratory using a digital PSG system (Embla®S7000; Embla Systems, Inc., Broomfield, CO). The following physiological variables were monitored simultaneously and continuously: four channels for the electroencephalogram, two channels for the electrooculogram, two channels for the surface electromyogram (submental, anterior tibialis muscle), one channel for an electrocardiogram; oronasal airflow detection through a thermocouple and nasal pressure transducer (nasal cannula); and respiratory effort of the thorax and abdomen using inductance plethysmography; snoring using a neck microphone body position, and oxygen saturation (SpO2). Trained technicians visually scored all PSG readings according to standard criteria.
The sleep staging was performed as proposed by the new American Academy of Sleep Medicine (AASM) manual. 20 The definition of hypopnea followed the guidelines of the AASM, including a 30% drop in respiratory airflow associated with 4% desaturation. 20 The AHI was calculated as the sum of obstructive apneas, mixed apneas, and hypopneas divided by total sleep time. 20
Following the PSG night, the volunteers in both groups remained in the sleep laboratory the following day to perform the maintenance of wakefulness test (MWT), complete the questionnaires, and for blood sample collection.
Excessive daytime sleepiness
Objective sleepiness was determined by the MWT. This test consisted of four trials spaced at 2 hr intervals throughout the assessment day after waking up. Each lasted up to 40 min and was performed with the patient semireclined on a bed in a dimly lit sleep laboratory bedroom. Sleep latency of <8 min indicates excessive daytime sleepiness. 21 Subjects were instructed to remain awake as long as possible, without reading, singing, or making excessive physical movements between the trials. Sleep onset was scored from the first 30-sec epoch of any sleep stage using standard criteria, or as 40 min in the absence of sleep. 22,23 As described by Engleman and Joffe, 24 both the MWT and the multiple sleep latency test (MSLT) are used in research and clinical settings to assess the severity of sleep disorders and responses to treatment. However, we chose to use the MWT, as in a pilot study, the MSLT was unable to detect changes in mild OSA following treatment. 25,26
The ESS 27 is the most commonly used method of assessing subjective sleepiness. It consists of eight questions that describe situations that can induce drowsiness. Each question is scored from 0 to 3 points. A score above 10 indicates significant daytime sleepiness.
The Karolinska Sleepiness Scale (KSS) is a 9-point Likert scale based on a self-reported, subjective assessment of the subject's level of drowsiness at the time. 28,29 The KSS has been used widely, particularly for describing changes over time within subjects. 29 Higher KSS scores (7+) may refer more specifically to the state of drowsiness because the subject may then have experienced involuntary dozing behavior, with “lapsing” episodes and brief losses of awareness of the here-and-now, followed by arousal and the return of awareness, including some awareness of recently having dozed off. 30
For this study, for the characterization of sleepiness, the cutoffs used were: sleep latency of <8 min indicating excessive daytime sleepiness in the MWT; a score ≥8 in the KSS scale, and an ESS score of ≥10. We considered the individual to be somnolent when two of the cutoffs were found in patients in the mild OSA group.
Definition of MS
MS was diagnosed according to the modified NCEP ATP III criteria, 31 which consider MS to exist if three of the five following factors are present: (1) waist circumference (WC) ≥102 cm in men, and ≥88 cm in women; (2) TG ≥150 mg/dL (3) HDL <40 mg/dL in males and 50 mg/dL in females, or the patient on a specific drug treatment in all these conditions; (4) arterial blood pressure ≥130 or 85 mmHg, respectively, for systolic and diastolic blood pressure, or the patient on antihypertensive drug treatment; (5) fasting glucose ≥100 mg/dL or the patient on a specific drug treatment.
Blood sampling and biochemical marker determinations
Blood samples were collected in the outpatient clinic around 8 a.m. after an overnight fast. Fasting plasma glucose was measured using the glucose oxidase method, whereas fasting plasma insulin was assessed using radioimmunoassay. Total cholesterol, low-density lipoprotein cholesterol (LDL-c), HDL, very low-density lipoprotein cholesterol (VLDL), and TG levels were assessed using an auto analyzer and the appropriate reagents using a commercial kit (CELM, Barueri, Brazil). We calculated the TG to HDL-c cholesterol ratio (TG/HDL-c).
The hepatic insulin resistance index was assessed using the homeostasis model assessment of insulin resistance (HOMA-IR) and calculated as fasting serum insulin (mU/mL) × fasting plasma glucose (mmol/L)/22.5 as described by Matthews et al., 32 and HOMA of β-cell function, calculated by the formula: [20 × fasting insulin (mU/L)/glucose (mmol/L) −3.5]. 33 We considered the cutoff point for the presence of clinically significant insulin resistance (HOMA-IR) to be values >2.71 mmol · mU · mL as previously reported for the general Brazilian population. 34 Insulin sensitivity was determined by the quantitative insulin sensitivity check index: [1/(log fasting insulin (IU/mL) + log fasting glucose (mg/dL))]. 35
Statistical analyses
Continuous variables are presented as mean values and standard deviation, and categorical variables as absolute frequencies. Differences in proportions were assessed using the chi-squared test. The normality of the data was assessed using the Kolmogorov–Smirnov test and graphically through histograms. The non-normal distribution data were transformed using Z score. General linear model Univariate analysis was used to compare the PSG findings and metabolic profile. The effect size Hedges' G was calculated for each parameter. 36 In all analyses, we explored the confounding factors: age, BMI, gender, and WC in an adjusted model.
Spearman correlation was used to analyze the relationship between the metabolic profile and sleep parameters in OSA patients. In this subanalysis, we excluded patients with a BMI <30 kg/m2 and without current use of hypolipidemic medication. The results were considered statistically significant if the P-value was ≤0.05. SPSS (version 21.0; Chicago) was used for all statistical analyses.
Results
Initially, 222 volunteers were selected for the study; however, 102 of these subjects did not meet the inclusion criteria and were excluded. As a result, 120 individuals were included, of which 85 were allocated to the mild OSA group and 35 to the control group.
Fifty-five of the total sample were male (n = 59), with 55% (n = 44) of them in the mild OSA group.
In line with the selection criteria, mild OSA patients had higher ESS scores than the controls. We found higher values for age, BMI, WC, neck circumference, menopausal status, dyslipidemia, and hypertension in the mild OSA group compared with the control group (Table 1).
Data presented as the mean and SD (±), the comparison made using the general linear model test (GLM), * P ≤ 0.05: statistical significance representing the bold values.
Data presented as absolute frequency (n) and relative frequency (%).
Comparison performed using chi-squared test. Diabetes—chi squared = 1.69, degrees of freedom (df) = 1; hypertension—chi-squared = 8.44; (gl) = 1; Dyslipidemia—chi-squared = 7.26 (gl) = 1; Menopause—chi-squared = 3.51 gl = 1, * P ≤ 0.05.
Diabetes: defined as fasting plasma glucose levels ≥126 mg/dL and/or the use of any diabetes medications.
Dyslipidemia: defined as total cholesterol ≥240 mg/dL and/or the use of dyslipidemia medication.
Hypertension: defined by medical diagnosis and use of antihypertensive medication.
Metabolic syndrome: modified NCEP ATP III criteria, defined by three of the five following factors were present.
MWT: Sleep latency of <8 min indicates excessive daytime sleepiness.
Menopause status: defined as FSH ≥30 mIU/ml and/or medication and/or cessation of menstrual period for over 1 year.
OSA, obstructive sleep apnea; BMI, body mass index; df, degrees of freedom; ESS, Epworth Sleepiness Scale; FSH, follicle-stimulating hormone; MWT, maintenance of wakefulness test; SD, standard deviation.
PSG analysis
As expected, the mild OSA group exhibited significantly lower sleep efficiency (CG [control group]: 88.0 ± 6.5 vs. mild OSA: 81.0 ± 11.0, P < 0.001); higher AI values (CG: 8.7 ± 3.5 vs. mild OSA: 16.17 ± 7.56, P < 0.001); RDI (CG: 2.7 ± 1.7 vs. mild OSA: 14.7 ± 5.2, P < 0.001); AHI (CG: 1.3 ± 1.1 vs. mild OSA: 9.4 ± 2.9, P < 0.001); rapid eye movement desaturation index (CG: 3.2 ± 3.5 vs. mild OSA: 19.5 ± 15.5, P < 0.001), and nonrapid eye movement desaturation index (CG: 0.8 ± 0.9 vs. mild OSA: 7.7 ± 5.9, P < 0.01).
Metabolic profile
We found a higher frequency of hypertension and dyslipidemia in the mild OSA group. Thirty-six percent of mild OSA patients showed a statistically significant elevated TG/HDL-C ratio, compared with the control group. The prevalence of MS was 32% in the mild OSA group and 6% in the control group (Table 1).
As shown in Table 2, after adjustment for age, gender, BMI, WC, and medications for dyslipidemia, the mild OSA group presented higher values in TG and TG/HDL compared with the control group (P ≤ 0.05), a moderate effect size being found for these variables. We did not observe any statistical differences between the groups after controlling the variables in this profile. In the analysis of categorical variables, without adjustments for confounders, 30.6% of the mild OSA group showed insulin resistance and 56% presented prediabetes status compared with the control group (P ≤ 0.05).
Data presented as the mean and SD, comparison made using GLM Test, * P < 0.05: statistical significance representing the bold values. Data presented in absolute frequency (n) and relative frequency (%)#. Comparison performed using chi-squared test: TG/HDL-c: 4.34; gl = 1, Hb1ac: chi-squared test: 17.43, gl = 1; HOMA-IR: chi-squared test = 5.92; gl = 1.
P adjusted: Adjusted for age, BMI, abdominal circumference, gender, and medications.
HDL, high-density lipoprotein; TG, triglycerides; VLDL, very low-density lipoprotein; LDL, low-density lipoprotein; HOMA-IR, homeostasis model assessment of insulin resistance; HOMA-β, insulin resistance and β cell function evaluation; QUICKI, quantitative insulin sensitivity check index; HbA1c, glycated hemoglobin.
Correlation between metabolic profile and sleep parameters in the mild OSA group
The correlations between metabolic profile and sleep parameters in the mild OSA group, independent of obesity (BMI <30 kg/m2) showed: a negative correlation between mean SpO2 and total cholesterol (r = −0.4, P = 0.003), as well as between mean SpO2 and TG (r = −0.47, P = 0.01) (illustrated in Fig. 1).
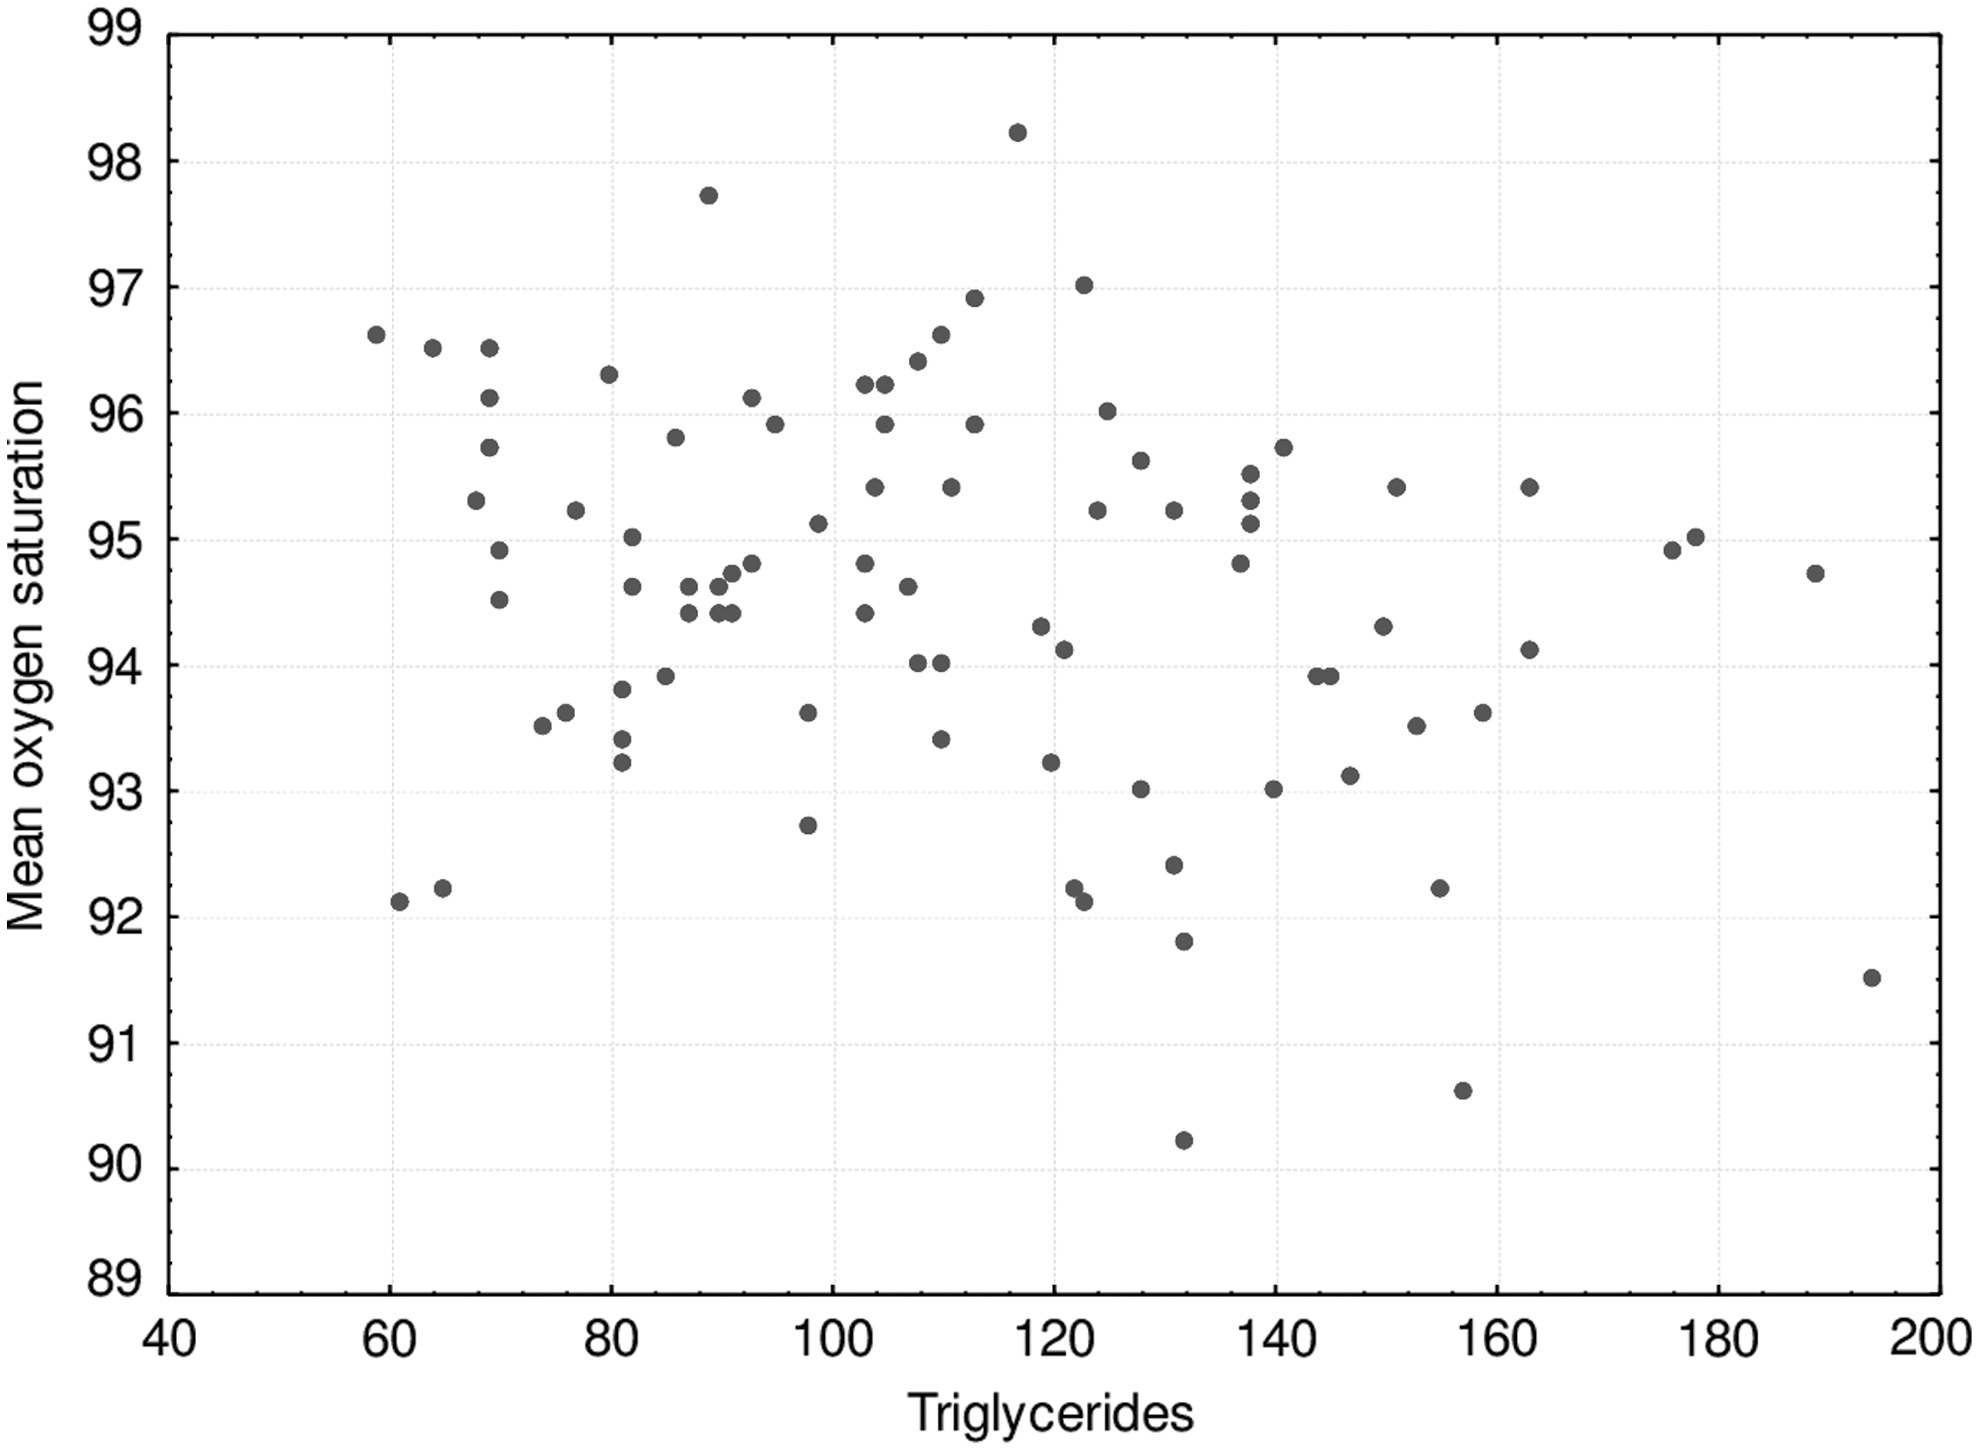
Correlation between triglycerides with mean SpO2 Spearman correlation (r = −0.47, *p = 0.01).
With respect to glucose metabolism, we did not find any significant results between: fasting glucose and mean SpO2 (ρ = −0.002, P = 0.87); fasting glucose and AHI (ρ: −0.007; P = 0.57); glycated hemoglobin (HbA1c) and mean SpO2 (ρ: −0.18, P = 0.18), and HbA1c and AHI (ρ: 0.09, P = 0.50). In addition, we did not find correlations between AHI, sleep stages, and arousals with lipid and glycemic parameters.
Impact of excessive daytime sleepiness on cardiometabolic and PSG profiles
There was no difference between metabolic and PSG profiles with respect to somnolent and nonsomnolent OSA patients (Table 3).
Data presented as the mean and SD (±), comparison made using GLM test, * P < 0.05.
P adjusted: adjusted for age, BMI, abdominal circumference, gender.
Discussion
As far as we are aware, this is the first study to show higher values of TG/HDL-c in mild OSA patients compared with controls with a large effect size. We also demonstrated that TG, independent of confounding factors, were higher in the mild OSA group. Both lipid parameters were associated with sleep hypoxemia. According to recent studies, the TG/HDL-c ratio has been identified as a possible early atherogenic marker in different populations, especially in moderate-to-severe OSA. 15,37,38
OSA is frequently associated with MS. In patients with MS, the prevalence of moderate-to-severe OSA is above 60%. 39 However, there are few studies addressing MS in mild forms of OSA (specifically with an AHI between 5 and 15 events/hr). 40,41 A recent meta-analysis that included patients with OSA (AHI ≥5) demonstrated a prevalence of MS ranging from 23% to 79%. 42 These findings support our study, which demonstrated a prevalence of 32% of MS in mild OSA patients.
The association between OSA and dyslipidemia has been investigated over the last decade. 43,44 This association has been more explored in moderate-to-severe OSA than in mild OSA, 15,37 and few studies have addressed mild OSA versus controls 11,13,38 ; however, those addressing whether dyslipidemia is associated with mild OSA have produced conflicting results 45 –47 and the association remains unclear.
A previous study by our group (Togeiro et al. 13 ) demonstrated that the insulin resistance index (HOMA-IR) may be considered an important predictor factor for dyslipidemia in mild OSA, odds ratio: 1.78 (1.21–2.62). It is known that IR increases insulin-stimulated hepatic lipolysis and causes a general accumulation of ectopic lipids. 44 The intracellular accumulation of lipids then triggers defects in insulin signaling and induces IR in the muscles and liver 35,45 –48 initiating a vicious cycle. In the current study, we did not find differences in IR between mild OSA and controls, so the mechanism which might explain the dyslipidemia in our patients needs to be more explored in further studies.
Additionally, in animal models, intermittent hypoxia has been shown to be a potent mechanism for atherosclerosis and induced increased levels of VLDL and TG. 49 Despite the small sample size in our subanalysis, our data showed a trend of association between mean oxygen saturation and variables of lipid metabolism, suggesting that hypoxemia may be a better marker than AHI for determining lipid abnormalities in our patients.
Reviewing the literature, Blomster et al. 50 found lower values of HDL-c in overweight patients with mild OSA compared with non-OSA subjects after adjusting for confounders, which is in agreement with our results.
Our data demonstrated that mild OSA is a presignal of CV risks, in concordance with the study of Guan et al., 51 which reported that some components of dyslipidemia increase independently of the severity of OSA.
Different results related to the metabolic outcomes of mild OSA in the literature might be explained by the variability in study methodologies, such as the recruited population and the definition of hypopnea, which contribute to misdiagnosis and misclassification of the severity of this disease. 8,16,49 The definition of hypopnea has changed over the years, and to be more rigorous, in our study, we used the hypopnea definition recommended by the AASM that is based on a 30% drop in respiratory airflow associated with 4% desaturation. Our recruited patients with mild OSA were, therefore, more prone to have some level of hypoxemia, which could explain our findings of an association between dyslipidemia and sleep hypoxemia.
With respect to somnolence, studies have reported an association between it and adverse outcomes, such as hyperglycemia, dyslipidemia, and systemic hypertension, independent of body weight and other factors. 52 –54 The negative findings in our study and the absence of any differences in metabolic parameters between somnolent and nonsomnolent groups might be due to similarities in the sample when evaluated by objective measure (MWT).
The present study has some limitations. First, our sample size was calculated based on a large ongoing study that is evaluating the effect of CPAP treatment on metabolic profile, which is the second part of this current study (Clinical Trials—NTC01461486). Second, factors related to lifestyle such as differing activity levels and diets could be confounders which were not analyzed.
On the other hand, the strength of our study is the presence of a control group without any sleep complaints, as well as the inclusion of a detailed evaluation of metabolic profile after adjusting for the main confounders. Additionally, a moderate effect size obtained in the main findings demonstrated that dyslipidemia is clinically significant, which will allow targeted treatment of patients with presignaling of MS.
We believe that future investigations should explore genetic and inflammatory markers for metabolic dysregulation in mild OSA, 55 –57 and that the identification of patients with metabolic abnormalities in mild OSA might help to provide better clinical management of this population.
Conclusions
Our findings showed that mild OSA is independently associated with dysregulation in lipid profiles that correlates with sleep hypoxemia. The TG/HDL-c ratio in particular was high, suggesting that it might be investigated as a marker of a detrimental metabolic profile in mild OSA. Additionally, we demonstrated a high prevalence of MS in our patients. In a subanalysis, we did not find an association between sleepiness and metabolic profile.
Footnotes
Acknowledgments
This work was financially supported by the Associação Fundo de Incentivo a Pesquisa (AFIP), CNPq: 478965/2012-5 and the São Paulo Research Foundation (FAPESP) grant #2013/13916-3. L.O.e.S., L.B., S.T., and S.M.T. are recipients of CNPq fellowships.
Author Disclosure Statement
No conflicting financial interests exist.