
Abstract
Objective:
Obesity and metabolic syndrome are preventable complex-multifactorial disorders that severely increase risk of cardiovascular disease (CVD). Indoleamine 2,3-dioxygenase (IDO) enzyme converts tryptophan (TRP) to kynurenine (KYN); besides, KYN/TRP ratio has been shown to predict major coronary events and all-cause mortality in patients with coronary artery disease. However, their role in metabolic syndrome is not understood.
Methods:
In a cross-sectional study (n = 161, mean population age in years = 32 ± 7.5, and sex = 53% female), standard anthropometric parameters, blood chemistry, high-sensitivity C-reactive protein, TRP, KYN, and KYN/TRP ratio were measured and compared with uric acid (UA), metabolic syndrome, and body mass index (BMI).
Results:
KYN/TRP ratio was significantly elevated in individuals with hyperuricemia (UA ≥7) (P < 0.0001), metabolic syndrome (P = 0.0066), and obesity (P = 0.0349), compared to their respective control groups. Moreover, increased presence of TRP does not correlate with increased TRP conversion to KYN, thus inflammation drives IDO enzyme activity. KYN/TRP levels were positively correlated with UA (R 2 = 0.1083, P < 0.0001), BMI (R 2 = 0.05267, P = 0.0036), and triglycerides (R 2 = 0.08053, P = 0.0003). Receiver operating characteristic curve implied that KYU/TRP ratio (AUC 0.7032, P < 0.0001) was more effective in stratifying CVD risk in combination with UA, and a gamma regression model (P < 0.001) demonstrated dependence of UA, BMI, and low-density lipoprotein along with KYN/TRP in CVD risk.
Conclusions:
TRP catabolism is altered in metabolic syndrome; however, further studies are needed to understand role of kynurenine in pathology and disease outcomes.
Introduction
G
Visceral fat accumulation in obesity is often accompanied by hyperuricemia and higher insulin resistance, which reduces uric acid (UA) excretion and is also associated with the metabolic syndrome. However, there is no consensus if UA is a protective or a risk factor in CVD, because on the one hand it has protective antioxidant and pro-oxidant role as demonstrated in several neurological diseases and on the other hand damaging pro-inflammatory effects on vascular cells and adipocytes. 3 However, it seems that acute elevation is a protective factor, whereas chronic elevation a risk for disease. In the clinical context, hyperuricemia seems to be accepted as a prognostic marker of renal disease, diabetes mellitus, and CVD. 3,4
Furthermore, endothelial dysfunction in atherosclerosis is the main etiological factor of CVD, a major pathologic consequence of obesity and metabolic syndrome. A higher likelihood of fatal cardiovascular events has been recently shown to be associated with increased serum kynurenine to tryptophan (KYN/TRP) ratios, a result of an increased conversion of TRP to KYN by enzyme indoleamine 2,3-dioxygenase (IDO). 5,6 Innate immune activation in individuals with obesity or metabolic syndrome causes low-grade chronic inflammation and an increase in interferon-γ (IFN-γ), tumor necrosis factor-α (TNF-α), and interleukin (IL)-1β, which are associated with a Th1 type immune response. 7 In addition, IFN-γ activates the rate-limiting enzyme IDO in monocyte-derived macrophages and dendritic cells. 8 Besides, there is ample experimental evidence for the involvement of TRP catabolism in the regulation of T cell apoptosis and maintenance of peripheral T cell tolerance. 8 Importantly, circulating serum KYN/TRP ratio can be a good estimator of IDO enzyme activity, which is associated with increased oxidative stress, inflammation, immune activation, and a higher likelihood of fatal cardiovascular events. 9,10 Concomitantly, this study evaluates role of KYN as a biomarker for cardiovascular risk and its correlation with standard laboratory markers.
Methods
Ethical considerations
This study was approved by the Universidade Federal do Amazonas (UFAM) Research Ethics Committee, in accordance with Brazilian law, which complied with the Declaration of Helsinki. All the study participants signed an informed consent before their enrollment.
Sample size and power analysis
Obesity is often accompanied by hyperuricemia; hence, UA was selected as the first dependent variable and KYN as the second dependent variable for sample size calculation and power analysis. From our previous studies (unpublished results), we observed a detectable difference of 0.97 mg/dL and a standard deviation of 1 mg/dL in UA levels. Setting a significance level of 0.05 and power at 95%, we calculated an effect size of 0.81 and estimated a sample size of 41 patients for each study group. To avoid dropouts and reduction in statistical power, we recruited minimum of 50 patients per group (assuming a maximum 25% of dropouts). Sample size calculation and power analysis were performed using the GPower 3.1 software. 11
Study population
Individuals with a requisition for UA testing from their physician were invited to participate in this study at Laboratory of Clinical analysis, Hospital Universitário Getúlio Vargas (HUGV, Manaus, Amazonas state, Brazil) between January and April, 2013.
One hundred sixty-one (n = 161) consecutive patients were enrolled in this observational and cross-sectional study to understand relationship between UA and KYN in obesity and metabolic syndrome. After signing the consent form, early morning fasting venous blood was collected, and anthropometric measurements were recorded. Blood was split into two parts: one part was used immediately for hematological and biochemical analysis to avoid contamination and hemolysis, whereas the second part was immediately centrifuged to separate plasma or serum at 2000g, 10 min, and stored at −70°C until further analysis.
Patient classification
For each participant standard anthropometric parameters were measured: waist circumference (cm), weight (kg), and height (cm). Body mass index (BMI) was calculated as weight/height2 (kg/m2); participants were considered to have obesity if the BMI was ≥30 kg/m2. After a rest period of 10 min, blood pressure (BP) was measured twice in a sitting position (right arm) using a sphygmomanometer with an interval of 3 min between the two measurements, and the mean value was calculated. Metabolic syndrome was defined according to Adult Treatment Panel III criteria. Patient with at least three of the following five criteria was considered having metabolic syndrome: fasting plasma glucose ≥110 mg/dL; systolic/diastolic blood pressure (SBP/DBP) ≥130/85 mmHg; triglycerides ≥150 mg/dL; high-density lipoprotein cholesterol (HDL-C) level <40 mg/dL in males or <50 mg/dL in female, and waist circumference ≥102 cm in males or ≥88 cm in females. Furthermore, subjects were classified as hyperuricemic with serum UA levels of 7 mg/dL for men and 6 mg/dL for women. 12,13
Blood chemistry and hematological analysis
Early morning fasting blood was collected, and following parameters were measured: glucose, total cholesterol, HDL-C, triglycerides, UA, urea, creatinine, aspartate transaminase (AST), alanine transaminase (ALT), gamma glutamyl transferase (Gamma-GT), alkaline phosphatase (ALP), α-1 glycoprotein, ferritin, and high-sensitivity C-reactive protein (hsCRP) using a biochemical autoanalyzer (BT plus 3000; Wiener Lab). The hemogram was performed by automated method using the equipment XT-2000i (Sysmex) by the method of flow cytometry and impedance.
Simultaneous TRP and kynurenine quantification by high-performance liquid chromatography
TRP and KYN concentrations in peripheral blood were measured simultaneously by reverse-phase high-performance liquid chromatography (HPLC) as described earlier. 14,15 The HPLC system (Shimadzu) was coupled with an analytical ODS C18 column of 15 cm, 4.6 μ and a PDA detector (collecting UV–Vis spectra from 190 to 800 nm, which can provide chromatograms at the desired wavelength in this range; Shimadzu), and fluorescence detector (Shimadzu). The mobile phase consisted of a mixture of 15 mM sodium acetate buffer with 27 mL acetonitrile adjusted to a final pH of 4.0 with acetic acid. Perchloric acid (final concentration 8%) was added to 200 μL of patient serum sample, homogenized by vortexing for 1 min, and centrifuged at 10,000 rpm at 4°C for 10 min. A clear supernatant was then injected into the HPLC system using an autosampler. In addition, TRP and KYN HPLC grade reagents were purchased from Sigma, and stock solutions were prepared in mobile phase buffer. For the standard curve a serial dilution was performed with TRP and KYN (TRP/KYN μM): 100/10; 50/5; 25/2.5; 12.5/1.25; 6.25/0.625; 3.125/0.325. The flow rate was 1.0 mL min−1 , and the volume per sample was 20 μL. TRP was identified at 278 nm and KYN at 360 nm by UV detection. 16 Retention time (Rt) was used to identify metabolites in the chromatogram, and standard curve was constructed by plotting the ratio of peak area (computed by LC Solution Software; Shimadzu) of TRP or KYN (y) against known TRP or KYN concentration (x), respectively. The linearity of the standard curves was confirmed using regression variance analysis, and significance of correlation of determination (R 2) checked using Student's t-test. Derived equation was used to quantify unknown concentrations in the patient samples. In addition, the intra-assay (reproducibility) variability was determined by analyzing samples in triplicate and the inter-assay (repeatability) variability by testing samples 3 and 6 days in triplicate after the first analysis. The concentration compared in inter- and intra-assay had no statistically significant difference.
Statistics and data analysis
Descriptive statistics was used to describe the main clinical and blood chemistry parameters. The two-tailed Student's t-test was used to compare means when normal distribution was observed in a Kolmogorov–Smirnov test. When normality was not observed the nonparametric Mann–Whitney test was used to compare medians. Linear regression was performed to assess the relationship between variables. Normality for regression analysis was assessed using D'Agostino and Pearson normality test. All abovementioned statistical tests were performed using the Prism 6.02 software (GraphPad) and InVivoStat version 3.5.
To assess the interaction of factors playing a role in CVD risk, we used quantitative variables UA, IDO activity (KYN/TRP), BMI, low-density lipoprotein (LDL), and triglyceride to perform a gamma regression model. Wherein, Yij was defined as KYN/TRP observed for the ith individual of the jth group (UA ≥7, j = 1, UA <7, j = 2). Assuming Yij ∼ G(μij,φ) which is a part of the equation (μij = μ + βj group + δ1BMIij + δ2LDLij). Then the data were adjusted for the gamma model with identity connection and applying the Akaike method; triglyceride as a factor was removed to obtain a best-fit model. Hence the model that remained was the group factor besides the quantitative variables BMI and LDL. Gamma model was performed using R software 3.02 with different packages. Significance level adopted was 0.05, and all tests were two tailed.
Results
The demographic characteristics, anthropometric measurement, plasma biochemistry, and hematological data for patients recruited in this cross-sectional study are presented in Table 1. Individuals with obesity (BMI ≥30), metabolic syndrome, and UA ≥7 or hyperuricemia showed significantly elevated resting glucose levels and lipid profile as described in the literature compared to nonobese, without metabolic syndrome, and UA <7, respectively. In addition, SBP and DBP in all disease groups were significantly altered compared to their respective control group. However, the blood pressure was more significantly altered in patients with metabolic syndrome and hyperuricemia. hsCRP was significantly elevated in patients with obesity and metabolic syndrome, whereas patients with hyperuricemia or without hyperuricemia had no difference (Table 1).
BMI, body mass index; DBP, diastolic blood pressure; HDL-C, high-density lipoprotein cholesterol; LDL, low-density lipoprotein; SBP, systolic blood pressure; UA, uric acid.
In addition, kynurenine (KYN) was significantly increased (P < 0.0001) in hyperuricemia (UA ≥7), metabolic syndrome, and obesity (BMI ≥30) (Fig. 1). Whereas TRP plasma levels were significantly increased only in individuals with obesity compared to control group (BMI <30, P = 0.0016) (Fig. 1C). As every individual consumes different amounts of TRP, which essentially enters the body through food or supplements, we performed a ratio of kynurenine and TRP to determine exact activity of enzyme. Kynurenine/tryptophan (KYN/TRP) ratio was significantly elevated in hyperuricemia (P < 0.0001), metabolic syndrome (P = 0.0066), and obesity (P = 0.0349) compared to their respective control groups (Fig. 1). However, KYN/TRP ratio was comparatively severely altered in hyperuricemia group compared to obesity and metabolic syndrome. In addition, KYN/TRP ratio was significantly positively correlated with UA (R 2 = 0.1083, P < 0.0001) and BMI (R 2 = 0.05267, P = 0.0036) (Fig. 2A, B), whereas lymphocytes were weakly negatively correlated with KYN/TRP ratio (R 2 = −0.08, P = 0.3180) (data not shown). Upon comparing lipid profile of study participants, we observed a significant positive correlation between triglycerides (R 2 = 0.08053, P = 0.0003) and KYN/TRP (Fig. 2C). Although LDL (R 2 = −0.001, P = 0.9918) (Fig. 2D) did not show any correlation with KYN/TRP, HDL (R 2 = −0.144, P = 0.07) (data not shown) was weakly negatively correlated with KYN/TRP ratio. LDL and HDL are standard markers used in defining cardiovascular risk in obesity and metabolic syndrome; however, absence of correlation with KYN/TRP ratio suggests that there might be unknown disease mechanisms involved that determine cardiovascular risk.
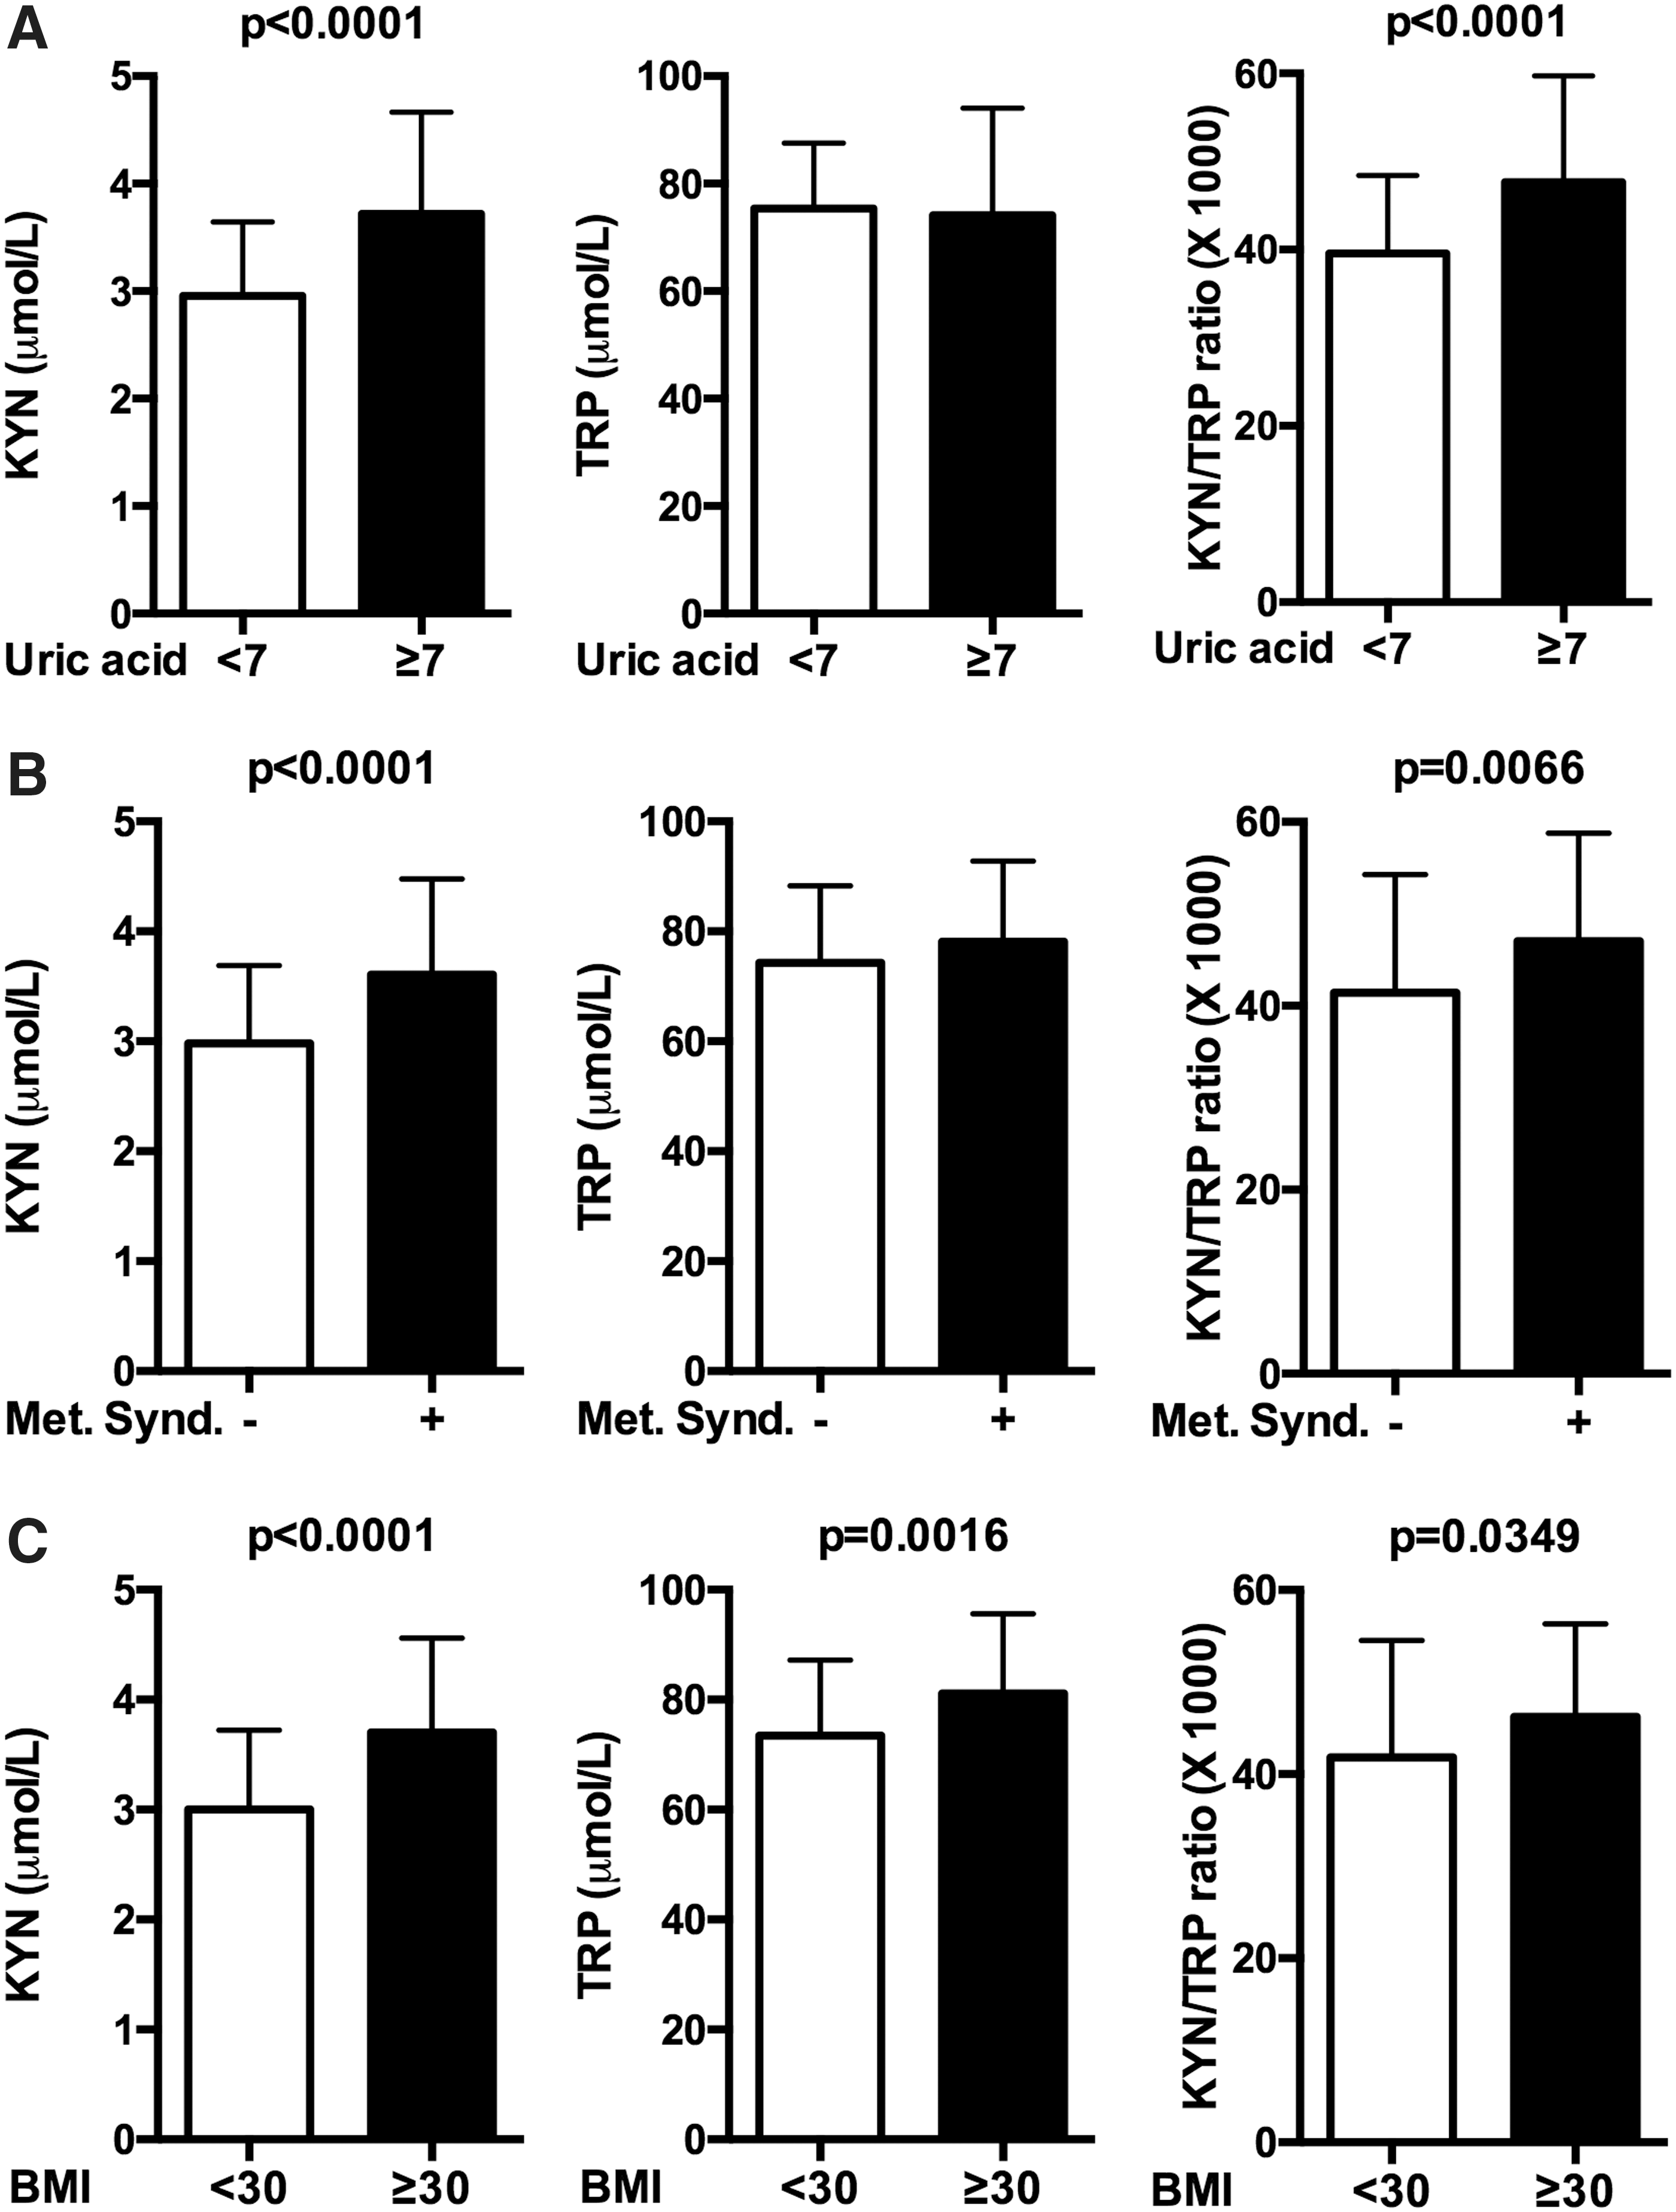
KYN/TRP ratio is increased in individuals with hyperuricemia, metabolic syndrome, and obesity. TRP and kynurenine levels were measured in patient serum (n = 161) by HPLC and stratified according to

IDO activity correlates with metabolic disease markers. Correlation between KYN/TRP ratio and
Besides, we performed a receiver operating characteristic (ROC) curve analysis to understand the influence of KYN/TRP ratio as a potential biomarker and to stratify study populations. The ROC curves visually represent the relationship between sensitivity (true positive rate) and 1-specificity (false positive rate) over the entire range of the index value. Cutoff values were not calculated for each disease population as a small study population was used and stratification was not performed according to sex. Nevertheless, the cutoff for KYN/TRP ratio was relatively higher in hyperuricemia group compared to individuals with obesity and metabolic syndrome (data not shown). Moreover, all the curves (Fig. 3) hyperuricemia (UA ≥7) versus UA <7 [AUC 0.7032, confidence interval (CI) 0.6134–0.7930, P < 0.0001], metabolic syndrome versus without metabolic syndrome (AUC 0.6630, CI 0.5753–0.7507, P = 0.0005), and obese versus nonobese (AUC 0.6457, CI 0.5532–0.7383, P = 0.0034) were statistically significant than what were expected by chance stratification. Risk for CVD and kidney disease is multifactorial; hence we performed a gamma multi regression analysis to understand influence of UA and KYN/TRP ratio on anthropometric and biochemical parameters measured in this study. A statistically significant best-fit model (P < 0.001) was obtained using UA, KYN/TRP, BMI, and LDL based on the interrelationship of the variables and their distribution implying their importance in the disease outcome (Table 2).

Sensitivity and specificity profile of KYN/TRP ratio as a stratification marker. ROC curve analysis was performed to study predictive performance of KYN/TRP ratios for
Discussion
Obesity and metabolic syndrome are a global epidemic affecting both children and adults and are associated with numerous co-morbidities, including CVD, hypertension, chronic kidney disease (CKD), and type II diabetes. In this study, we demonstrate that BMI, UA, and triglycerides are positively correlated with an increased conversion of TRP to KYN (KYN/TRP ratio); an interaction of these factors along with inflammation might collectively determine CVD risk; however, their role in pathology and disease remains unclear.
Recently, association between KYN levels was shown to be stronger for CVD mortality than for mortality due to cancer or other causes 6 ; moreover, KYN/TRP has also been shown to predict major coronary events and all-cause mortality in patients with coronary artery disease. 5,17 In addition, KYN has been shown to be involved in chronic renal failure. 18 IDO enzyme responsible for conversion of TRP to KYN is regulated by host inflammatory status. Recently, KYN/TRP ratio was shown to be elevated in individuals with obesity and metabolic syndrome. 19,20 Individuals with UA ≥7 and UA <7 had mean equal amounts of TRP in serum, but KYU/TRP ratio was significantly higher in patients with hyperuricemia. Thus, it confirms that the inflammatory status might drive conversion of TRP to KYN. 19 Furthermore, UA crystals have been shown to act as damage-associated molecular patterns and trigger IL-1β-mediated inflammation through activation of the NOD-like receptor protein 3 (NLRP3) inflammasome. 21,22 Likewise, IL-1β a pro-inflammatory cytokine in addition to IFN-γ and TNF-α increases KYN that appears to be central to pathological inflammatory condition in CVD and endothelial dysfunction.
In addition, CVD is usually caused by atherosclerosis, a focal inflammatory process involving the endothelial cells and smooth muscles of the vascular wall around lipid deposits called atherosclerotic plaque, which may remain stable for years or rupture causing fatal clinical end points like stroke. In obesity excess of visceral adipose tissue secretes has been shown to elevate UA 23 and several pro-inflammatory cytokines, 21,24,25 which are also characterized by elevations of hsCRP that may render otherwise stable atherosclerotic plaques vulnerable to plaque rupture. However, the events that lead to rupture of atherosclerotic plaque are not very well understood. In contrast, kynurenine and its metabolites induce apoptosis and endothelial dysfunction by inducing oxidative stress 26 ; these mechanisms of immune activation may be involved in triggering acute CVD events.
Furthermore, hypertriglyceridemia and hyperuricemia not only serve as biomarkers for increased coronary heart disease risk but also have an additive effect on DBP. 27 Besides, TRP metabolism by IDO has been shown to contribute toward regulation of vascular tone; KYN administration in hypertensive rats was observed to decrease blood pressure in a dose-dependent manner. 28 In our study, we not only observed a decreased DBP but also KYN/TRP ratio was positive correlated with BMI, triglycerides, and UA, which might collectively work together to reduce DBP. In addition, use of cholesterol lowering drugs in CKD patients not only reduced oxidative stress and inflammation but also significantly decreased KYN and KYN/TRP ratio. 29 In addition, it is well established that statins can suppress TRP breakdown by IDO-1 because of their anti-inflammatory properties. 30
Using collective evidence of principal players in obesity and metabolic syndrome, our gamma regression model implies that physiological processes are befittingly integrated; TRP metabolites, UA, BMI, and lipids work together toward disease progression and pathology. A small study population, absence of serum pro-inflammatory cytokine levels, and IDO-1 and IDO-2 gene expression in patients due to unavailability of sample are some of the limitations in this study. All patients gave fasting blood samples; however, due to lack of information we do not know the role of prolonged caffeine or tea intake or general protein or supplement intake in our study population. Nevertheless, KYN/TRP ratio provides reliable indirect evidence of increased IDO activity due to inflammatory status associated with pro-inflammatory immune response. However, further studies are warranted to better understand implications in children and individuals of both sexes along with genetic variations that confer protection or increase disease risk.
Currently, several kynurenine pathway inhibitor drugs are in advanced clinical trials for several chronic infections and might be suitable for treating obesity and metabolic syndrome in reducing CVD and CKD risk. 31,32 However, further studies are needed to not only improve our understanding of kynurenine pathway and metabolic disease biology but also to identify specific acute biomarkers and create specific therapies for treating these diseases.
Footnotes
Acknowledgments
The authors thank all the patients and medical staff of Hospital Universitário Getúlio Vargas-UFAM (HUGV-UFAM) that participated in this study. The authors acknowledge and thank Antonio Alcirley da Silva for statistical analysis. E.S.L. and P.L. are supported by grants from Conselho Nacional de Desenvolvimento Científico e Tecnológico (CNPq) and Fundação de Amparo à Pesquisa do Estado do Amazonas (FAPEAM). The funders had no role in study design, data collection and analysis, decision to publish, or preparation of this article.
Author's Contributions
E.S.L. and P.L. conceived and designed the study. N.H.M. carried out all the experiments. N.H.M., E.S.L., and P.L. analyzed the data. All authors were involved in writing the article and had final approval of the submitted and published versions.
Author Disclosure Statement
No conflicting financial interests exist.