
Abstract
Background:
Metabolic syndrome (MetS), which confers a high risk for cardiovascular diseases, needs early diagnosis and treatment to reduce morbidity and mortality. Lipid accumulation product index has been reported to be an inexpensive marker of visceral fat and metabolic syndrome. This study aimed to evaluate lipid accumulation product index as a marker for metabolic syndrome in the Indian population where the prevalence of the condition is steadily increasing.
Methods:
A hospital-based, case–control study was conducted with 72 diagnosed cases of metabolic syndrome and 79 control subjects. In all the participants, body mass index (BMI) and lipid accumulation product index were calculated. The difference between cases and controls in BMI, waist circumference (WC), and lipid accumulation product index was assessed by Mann–Whitney U test/unpaired t-test. Associations of BMI, WC, and lipid accumulation product index with metabolic syndrome were compared by multiple logistic regression analysis and receiver operating characteristic analysis.
Results:
BMI, WC, and lipid accumulation product index were significantly higher in metabolic syndrome (P < 0.05). Although all were independently associated with metabolic syndrome, lipid accumulation product index had the highest prediction accuracy. The parameter also had a high area under curve of 0.901 (95% confidence interval 0.85–0.95) and a high sensitivity (76.4%), specificity (91.1%), positive predictive value (88.7%), and negative predictive value (80.9%) for detection of metabolic syndrome.
Conclusion:
In the Indian population, lipid accumulation product index is a better predictor of metabolic syndrome compared to BMI and WC and should be incorporated in laboratory reports as early, accurate, and inexpensive indicator of metabolic syndrome.
Introduction
M
MetS has a rising prevalence worldwide (varying from 8% to 43% in men and from 7% to 56% in women). 3 The importance of MetS lies in the fact that it confers a cardiovascular risk higher than the individual components. A recent study has shown that patients with MetS have a 3.5-fold higher risk of the presence of an atheroma plaque. 4 Therefore, MetS identifies high-risk group of individuals who would have been missed by considering only the conventional risk factors. The risk of developing metabolic syndrome is evident for most of the obese patients, but the risk increases steeply even within overweight or “preobese” range. 5 Thus, the early diagnosis of these patients and implementation of lifestyle interventions like diet education, physical activity, weight control, smoking cessation, and behavior modification remain a high priority. 5 Among the MetS parameters, obesity alone ranks fifth in the list of causes of worldwide mortality. 6 Moreover, central obesity has been associated with severe abnormalities in the metabolic profile compared to general obesity. 7 Central obesity or abdominal fat comprises both visceral and subcutaneous fat, of which, the former is highly associated with MetS and cardiovascular diseases. 8
Several traditional anthropometric measurements exist for assessment of obesity such as body mass index (BMI), WC, and waist-to-hip ratio, but are unable to distinguish between visceral fat and subcutaneous fat. 9 Lipid accumulation product (LAP) index, computed from WC and serum TG, is thus proposed as a better predictor of MetS as it is a marker of visceral adiposity. 10,11 LAP index has been reported to be a better predictor of diabetes and cardiovascular risks compared to BMI. 12,13 It has been extensively investigated in polycystic ovarian disease (PCOD) patients, whereby it has emerged as a reliable marker of adverse cardiovascular risk profile. 14 –16
Recently a study done in Taiwan reported LAP index to be an accurate predictor of MetS in patients above the age of 50 years. 10 However, such studies in the Indian scenario, comparing LAP index with other anthropometric indices, are rare. Filling this knowledge lacuna is of particular importance in the Indian scenario where obesity, diabetes, and MetS have assumed epidemic proportions. Thus, this study was conducted to explore the association between LAP index and MetS and to compare LAP index with other commonly used anthropometric indices regarding their association with the development of MS in Indian population.
Materials and Methods
The study was a prospective case–control study conducted between September 1, 2015, and April 30, 2016, at a medical college hospital in south India. The study was approved by the institutional research committee and ethics committee, which follow the guidelines set by the Helsinki declaration. Informed written consent was taken from all study subjects who consented to be a part of this study. The study subjects included 72 cases of MetS as diagnosed on the basis of NCEP ATP-III criteria modified for Asian population, along with 79 healthy control subjects who came for routine health check to our hospital. 2 Subjects with a past history of cardiovascular disease or adverse cardiovascular event, any past history of thyroid, renal, or hepatic disease, and familial hyperlipidemia were excluded from the study.
Epidemiological information was collected from the patients and hospital records. General physical examination was done, including height, weight, WC, and blood pressure. BMI was calculated by the following formula: weight (in kg)/height (in m2). WC was measured using a measuring tape at the level of uppermost part of the hipbone around the abdomen, ensuring that the tape remains horizontal. Blood pressure was recorded by a sphygmomanometer twice after the subject was resting in a sitting position for 5 min. The average of the two measurements was taken as the subject's blood pressure.
Under aseptic precautions, 3 mL of fasting blood samples were taken by antecubital venipuncture into plain vacutainer tubes from the healthy controls and MetS patients. Samples were centrifuged at 1000 rpm for 10 min within 1 hr of collection and separated serum was analyzed. Serum fasting blood glucose, HDL-C, and TG were estimated using an automated routine chemistry analyzer (Roche Cobas Integra 400 plus; Roche Diagnostics Limited, Switzerland) with commercial kits (Roche cobas c packs; Roche Diagnostics Limited) according to the manufacturer's protocol. LAP index was calculated for men [{WC (cm) − 65} × TG (mmol/L)] and women [{WC (cm) − 58} × TG (mmol/L)]. 12
Statistical methods
The data were analyzed using SPSS statistical software (v 16; IBM Corporation, Armonk, NY). To describe continuous variables, mean and standard deviation were used. The difference between cases and controls for non-normally distributed data like WC and LAP index was tested by Mann–Whitney U test and for normally distributed data like age and BMI by unpaired t-test. A P value <0.05 was considered statistically significant. Simple and multiple logistic regression analyses were done to find out the significant predictor of MetS among WC, BMI, and LAP index. Receiver operating characteristic (ROC) curve was generated to detect a cutoff of WC, BMI, and LAP index with optimal sensitivity and specificity in the diagnosis of MetS. Sensitivity, specificity, along with positive and negative predictive values, and Youden's index were also estimated.
Results
The descriptive statistics of all the study subjects are given in Table 1. There is no significant difference in the percentage of females between cases and controls, but a significant difference exists with respect to age. The values of BMI, WC, and LAP index are higher in cases than in controls and the difference in each parameter is statistically significant (P < 0.05) (Table 2). Cases have 2.5 times higher LAP index value than controls. Simple logistic regression analysis of age, BMI, WC, and LAP index is shown in Table 3 and it indicates all four to be significantly associated with MetS independently. Multiple logistic regression analysis of BMI, WC, and LAP index taken individually as predictors of MetS after adjusting for age also showed that all the factors were significantly associated (P < 0.01). For all these factors, the odds ratio ranges from 1.11 to 1.16 with very narrow confidence interval (Table 4). Among the three models, the best fitted model in predicting MetS was Model 3 (age + LAP index) as the Akaike Information Criterion (AIC) value is smaller compared to other two models (AIC for model 1: 194.66; AIC for model 2: 179.36; AIC for model 3: 115.63). Figure 1 shows the ROC curve for BMI, WC, and LAP index in the diagnosis of MetS. ROC curve analysis showed that the area under the curve (AUC) was high for LAP index (0.901) compared to BMI (0.644), as well as WC (0.756) (Table 5). The optimal cutoff value for BMI, WC, and LAP index was 26.45, 84.5, and 38.05, respectively. Based on these best cutoff values, the diagnostic test indice accuracy like sensitivity, specificity, and positive and negative predictive values was higher for LAP index (sensitivity: 76.4%; specificity: 91.1%; positive predictive value: 88.7; and negative predictive value: 80.9) compared to BMI and WC (Table 5). LAP index also had the highest Youden's index (0.67) (Table 5).
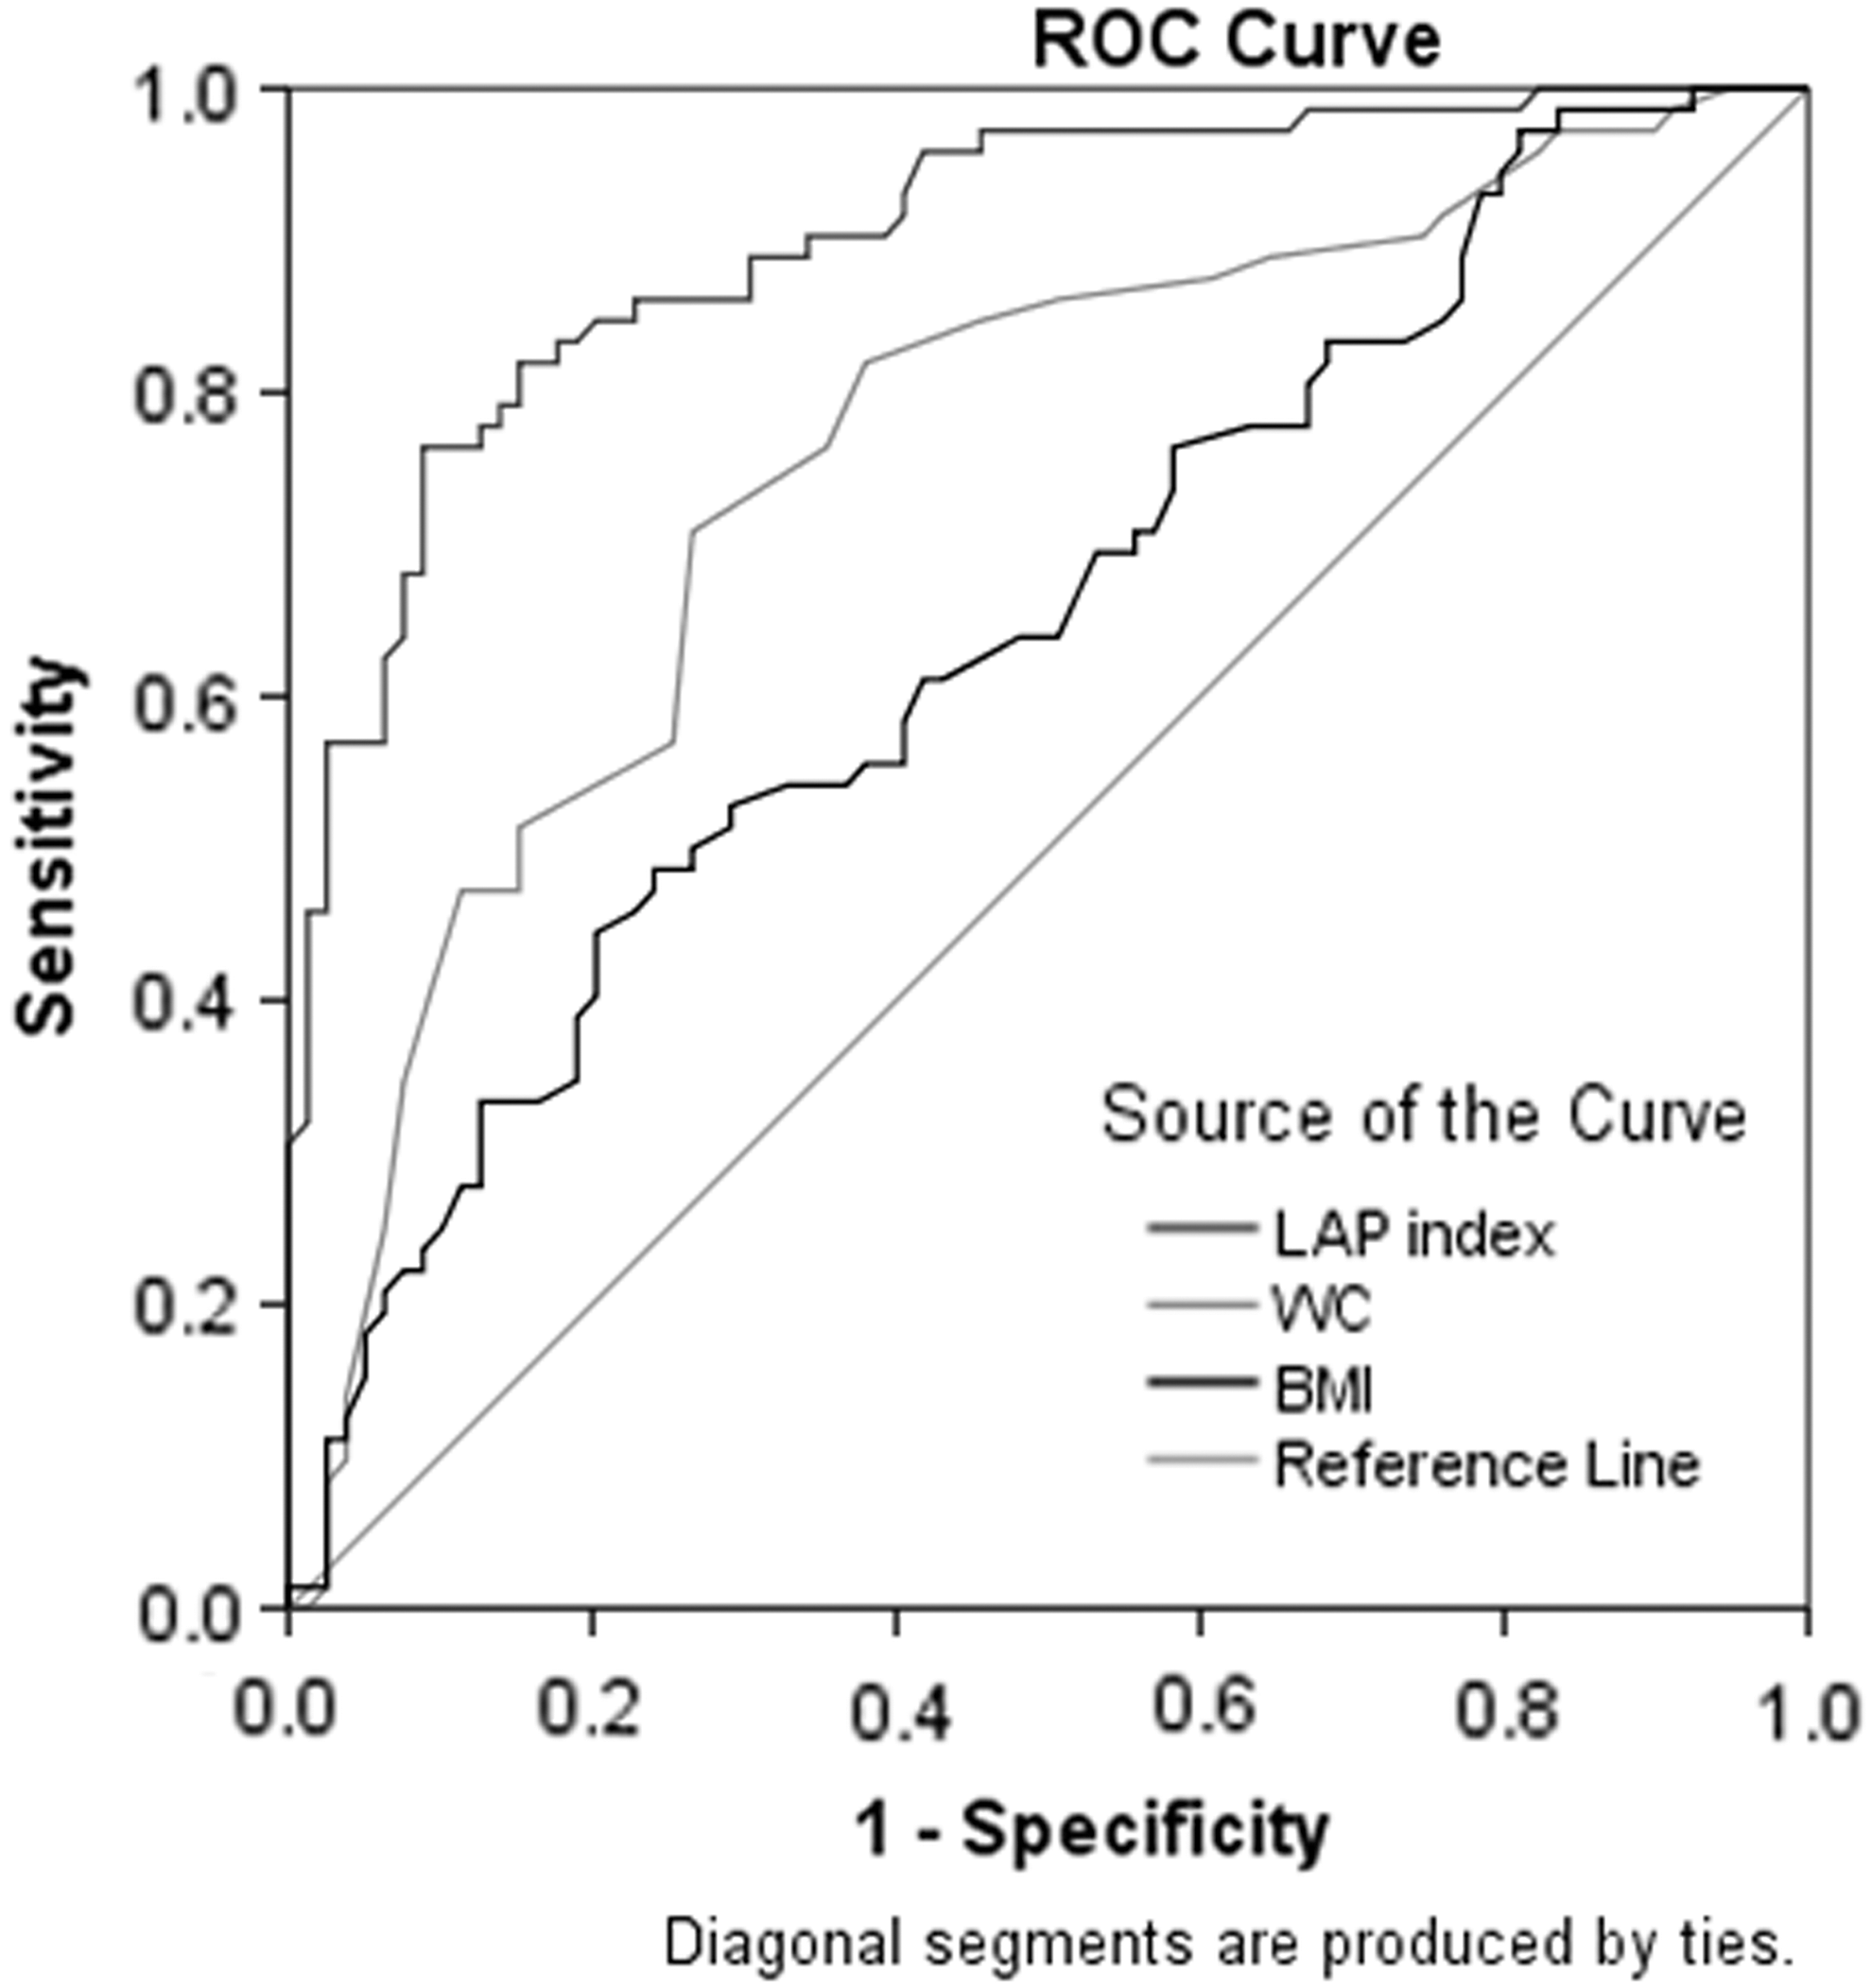
ROC curve of BMI, WC, and LAP index in the diagnosis of MetS. AUC of 0.901 is highest for LAP index. BMI, body mass index; LAP, lipid accumulation product; MetS, metabolic syndrome; ROC, receiver operating characteristic; WC, waist circumference.
Difference is statistically significant (P < 0.05).
MetS, metabolic syndrome; SD, standard deviation.
Difference is statistically significant (P < 0.05).
BMI, body mass index; LAP, lipid accumulation product; WC, waist circumference.
Difference is statistically significant (P < 0.05).
CI, confidence interval.
Difference is statistically significant (P < 0.05).
AUC, area under the curve.
Discussion
With the rising prevalence of MetS, the development of low-cost, risk-determining factors for early diagnosis has become the cornerstone of the strategies to reduce morbidity and mortality. 2,17 Although obesity has been ranked high among the leading causes of mortality, it is central obesity determined by WC that is associated with a worse cardiometabolic profile compared to general obesity. 7 Of the components of central obesity, it is the visceral adipose tissue that has been linked to metabolic derangements and high cardiovascular disease risk. 18 Previous research has indicated that higher levels of adipocytokines such as interleukin-6 and plasminogen activator inhibitor-1 are synthesized by visceral adipose tissue, which also has an enhanced rate of lipolysis. 19 Thus, it is useful to have an easily applicable indicator for estimating visceral fat for better assessment of cardiovascular disease risk in patients to avoid costly imaging studies for determining visceral obesity. 9 However, the prevalent anthropometric measurements such as BMI and WC cannot be used to differentiate between visceral and subcutaneous adipose tissue. In this regard, LAP index, which incorporates serum TGs and WC, thereby including the triglyceridemic waist in its calculation, has been strongly associated with visceral fat. 20 This study was thus conducted to investigate the association between LAP index and MetS and to compare LAP index with other commonly used anthropometric indices regarding their association with the development of MetS in Indian population.
Our study has shown that LAP index, BMI, and WC were significantly higher in the MetS population compared to controls, thereby indicating a higher visceral adiposity in MetS compared to controls. This is in agreement with a study done among polycystic ovary syndrome (PCOS) patients in Iran, where the patients having MetS had a significantly higher LAP index and WC compared to those who did not have MetS. 14 In contrast, they did not report any significant difference in BMI among the two groups. 14 This difference could be explained by our bigger sample size and different selection criteria of study samples. In a Brazilian study that evaluated LAP index as a marker of cardiovascular risk in PCOS patients, LAP index and WC were also higher in cases compared to controls. 16
Although ours was a hospital-based study, we proved that LAP index is a better marker of MetS compared to BMI and WC, although all three adiposity markers were independently associated with MetS. After adjusting for age, the better predictability of LAP index for MetS was determined by the AIC value of LAP index, which was lower than those of BMI and WC. This is in agreement with the study done in Taiwan where LAP index was the best predictor of MetS in the aged population. 10 Moreover, a study on 768 healthy Spanish adults also showed that in MetS defined using NCEP ATP-III and International Diabetes Federation criteria, LAP index had the highest diagnostic ability. 21 Other studies have also shown a strong positive association between LAP index and development of MetS, diabetes mellitus, and cardiovascular diseases. 22 –24 In many patients of visceral obesity, insulin resistance (IR) has often been noted irrespective of blood glycemic levels. 6 IR has also been postulated as a probable underlying factor in the development of MetS. 2 Moreover, the Brazilian study reported LAP index to be positively correlated with homeostasis model assessment for insulin resistance (HOMA-IR) index, which is a marker for IR. 16 A Korean study also reported that in multiple logistic regression analysis, LAP index exhibited a higher odds ratio for abnormal glucose regulation than did BMI after adjusting for several confounding factors such as age and family history of diabetes. 25 Since many of these studies have conclusively shown LAP index to be a better marker of IR, it would be interesting to speculate that the superior predictability of LAP index in the development of MetS was linked to its underlying cause of IR. However, despite extensive literature search, we could not find any previous AIC data related to LAP index, and thus ROC curve analysis was also attempted.
ROC curve analysis of LAP index showed a high diagnostic accuracy with AUC of 0.901, and at a cutoff of 38.05, showed high sensitivity, specificity, and positive and negative predictability, which were higher than those of BMI and WC. These findings are in broad agreement to other studies evaluating LAP index. In two studies done in PCOD females for diagnosing adverse cardiovascular profile in Iran and Brazil, LAP index had the highest diagnostic accuracy at the cutoff of 33.8 and 37.9, respectively. 14,15 In another Brazilian study, LAP index at a cutoff of 34.5 (sensitivity: 84% and specificity: 79%) showed a better performance than non-HDL-C, WC, or BMI to identify IR in all subjects. 16 Our AUC value for LAP index in MetS was similar to previously reported values, indicating the diagnostic value of LAP index across different regions and ethnicities. 10 In a cross-sectional study on 552 adult, apparently healthy Argentinian males, AUC for LAP index in MetS was reported as 0.91 and in a Nigerian study was shown to be 0.937. 26,27 In the Taiwanese study done on elderly subjects older than 50 years, the AUC for LAP index was 0.901, which too was similar to our study, and LAP index had higher sensitivity, specificity, and positive and negative predictive value compared to BMI and WC. 10 A Brazilian study found LAP index to be a better predictor of metabolic syndrome, even compared to waist-to-height ratio (WHtR) and waist-to hip ratio, apart from the standard anthropometric measurements like WC and BMI. 28 In contrast to our study, another Brazilian study found that WHtR showed more sensitivity and specificity than LAP index to detect MetS. The results of the same study, when analyzed by gender, demonstrated that WC and WHtR were better predictors of MetS. 29 Interestingly, LAP index was found to be a better predictor of metabolic syndrome, compared to other obesity indicators like visceral adiposity index, WC-TG index, and product of TG and glucose among type 2 diabetics and individuals over 40 years. 30,31 On the other hand LAP index was found to be high in type 2 diabetes and age-related testosterone deficiency syndrome, in addition to MetS and obesity. 32 Thus, our study indicates that LAP index, which can be easily computed from WC and TG, is an inexpensive and accurate marker of MetS, a claim validated by other studies done on general as well as specific populations. 10,21,26 –28,30 –33
We also showed that LAP index is a better predictor of MetS compared to BMI and WC and has high sensitivity and specificity. LAP index is a marker of visceral adiposity instead of subcutaneous fat and thus, a high LAP index in MetS compared to controls also proved the increased visceral adipose tissue in MetS patients, thereby indicating the adverse cardiometabolic profile and high cardiovascular disease risk in MetS patients. Since visceral fat has a stronger association with cardiovascular risk, it is of primary importance to include this simple marker of visceral adiposity in routine laboratory practice. 18 A high LAP index and therefore the presence of visceral obesity in the MetS patients reiterate the need to advocate healthy dietary practices and regular exercise protocols for these patients.
Limitations
Despite interesting results, our study is not without any limitations. Our study is a hospital-based, cross-sectional study with a relatively small sample size, where the lifestyle-related information such as alcohol intake, smoking, exercise, and dietary habits were not ascertained, which may potentially have an impact on the association of LAP index and MetS. Moreover, the study could not use an imaging method to detect visceral fat and thereby confirm the correlation between LAP index and visceral adipose tissue.
Future directions
Large-scale, community-based studies are the need of the hour to ascertain LAP index in the general population, which is imperative for determining the optimum cutoff for LAP index. The molecular mechanisms underlying the association of visceral adipose tissue with the development of cardiovascular diseases could be better elucidated by experimental studies conducted on animal models.
Conclusion
In conclusion, our study showed LAP index to be a simple, reliable, and inexpensive marker of MetS. It should be incorporated in our lipid profile reports to give clinicians a better indication of the cardiometabolic status of patients, leading to early diagnosis and management of MetS. High LAP index among the MetS population too stresses upon the need for community-based programs emphasizing on obesity awareness and lifestyle modification.
Footnotes
Acknowledgment
The authors would like acknowledge the management and Dean Research office of Pondicherry Institute of Medical Sciences for accepting the study as a PIMS faculty project.
Author Disclosure Statement
No conflicting financial interests exist.