
Abstract
Background:
Abdominal fat distribution varies across groups with different races or environments. Whether environmental factors, apart from racial differences, affect abdominal fat distribution is unknown.
Methods:
We compared the abdominal fat distribution of four groups; different races with similar environments (Caucasians vs. Japanese Americans), different environments with an identical race (Japanese Americans vs. Japanese), and similar races with similar environments (Japanese vs. Koreans). A population-based sample of 1212 men aged 40–49 were analyzed: 307 Caucasians and 300 Japanese Americans in the United States, 310 Japanese in Japan, and 295 Koreans in Korea. We compared the proportion of visceral adipose tissue area to total abdominal adipose tissue area (VAT%) and other factors that can affect abdominal fat distribution (smoking, alcohol use, physical activity levels, and metabolic factors).
Results:
VAT% was significantly higher in Japanese and Koreans than in Japanese Americans and Caucasians (50.0, 48.5, 43.2, 41.0%, respectively, P < 0.001). Even after adjustment for possible confounders, the significant VAT% difference remained in comparing groups with identical race but different environments (i.e., Japanese vs. Japanese Americans). In contrast, comparing groups with different races but similar environments (i.e., Caucasians vs. Japanese Americans), VAT% was not significantly different. Comparing groups with similar races and similar environments (i.e., Japanese vs. Koreans), VAT% did not significantly differ.
Conclusions:
Environmental differences, apart from racial differences, affect the difference in abdominal fat distribution across different groups in middle-aged men.
Introduction
A
Abdominal fat distribution varies across groups with different races or environments. East Asians have larger areas of VAT than Caucasians 5 even after adjustment of waist circumference 6 or body mass index (BMI). 7,8 The proportion of VAT area to the sum of VAT and SAT areas (VAT%) is also larger in east Asians than in Caucasians. 8,9 The reason for the different abdominal fat distribution across different groups is not yet fully clarified. In addition to racial differences, environmental factors are assumed to affect fat distributions. 10 Elucidating whether environmental factors, apart from racial differences, affect abdominal fat distribution may provide keys to preventing abdominal obesity, metabolic syndrome, and related diseases.
To clarify whether environmental factors, apart from racial differences, affect abdominal fat distribution, we compared the abdominal fat distribution of four different populations; Caucasians and Japanese Americans in the United States, Japanese in Japan, and Koreans in Korea in the ERA-JUMP study (The EBCT and Risk Factor Assessment among Japanese and U.S. Men in the Post World War II Birth Cohort). 6,11 –15 Examining these four different populations, we compared different races with similar environments (Caucasians vs. Japanese Americans), different environments with an identical race (Japanese Americans vs. Japanese), and similar races 16 with similar environments (Japanese vs. Koreans).
Materials and Methods
Participants and examinations
The ERA-JUMP is a cross-sectional international study to investigate subclinical atherosclerosis in men aged 40–49. Detailed methods were previously reported. 14,15 In brief, a total of 1227 men aged 40–49 were selected from four general populations during 2002 to 2006; 301 Koreans in Ansan, Gyeonggi-do, South Korea, 313 Japanese in Kusatsu, Shiga, Japan, 303 Japanese Americans in Honolulu, Hawaii, and 310 Caucasians in Allegheny County, Pennsylvania, in the United States. Koreans were randomly selected from the Korean Health and Genome Study, a population-based prospective cohort study. 17 Japanese were randomly selected from the Basic Residents' Register. The participants in Hawaii were randomly selected from the list of offspring of fathers who were participants in the Honolulu Heart Program. 18 The participants of the current study were the third or fourth generation of Japanese Americans without racial admixture. 15 Caucasians were randomly selected from the voter registration list. All participants were without clinical cardiovascular diseases or other severe diseases. We excluded 15 participants with missing computed tomography (CT) images. Our final sample was 1212 men: 295 Koreans in Korea, 310 Japanese in Japan, 300 Japanese Americans, and 307 Caucasians. All participants gave written informed consent. The study was approved by the Institutional Review Boards of Korea University, Shiga University of Medical Science, Kuakini Medical Center, and the University of Pittsburgh.
Physical examinations, questionnaires, and laboratory assessments, which all participants underwent, were described previously in detail. 14 In brief, body weight and height were measured while the participant was wearing light clothing without shoes. Waist circumference was measured twice at the umbilical level at the end of the exhalation phase while the participant was standing upright, and the mean of the two measurements was calculated. BMI was calculated as body weight (kg) divided by squared height (m2). Blood pressure was measured in the right arm of the seated participant after he emptied his bladder and sat quietly for 5 min, using an automated sphygmomanometer (BP-8800; Colin Medical Technology, Komaki, Japan) and an appropriately-sized cuff. The average of two measurements was used. Venipuncture was performed early in the clinic visit after a 12-hr fast. Serum samples were analyzed at the Heinz Laboratory, Department of Epidemiology, University of Pittsburgh as described previously. 14 High-density lipoprotein (HDL) cholesterol and triglycerides were determined using the standardized methods of the Centers for Disease Control and Prevention. Fasting serum glucose was determined by an enzymatic procedure. A self-administered questionnaire was used to obtain information of smoking habits, alcohol drinking, and physical activity levels descriptive of the participants' current job. Smoking status was determined as nonsmokers, exsmokers, current smokers with less than 20 cigarettes/day, or smokers with 20 cigarettes or more/day. Amount of alcohol intake was calculated as ethanol intake (grams/day) by using the self-administered questionnaire, which asked the participants the kind, the amount, and the frequency of their drinking. The physical activity level of the participants' current job was classified into four categories; “sedentary,” “light physical activity,” “medium physical activity,” and “very heavy, lots of physical activity.”
Measurement of visceral and SAT areas by CT imaging
CT images in the supine position were taken to assess SAT and VAT in a standardized way as previously described. 6,11 Image analysis software (AccuImage; AccuImage Diagnostics, San Francisco, CA) was used to quantify VAT and SAT areas on one cross-sectional scan obtained at the level of umbilicus and expressed in millimeters squared. VAT% was calculated as the proportions of VAT area to the sum of VAT and SAT areas. Adipose tissue was determined in a CT range from −130 to 0 Hounsfield Unit. 11 A GE-Imatron C150 Electron Beam Tomography scanner (GE Medical Systems, South San Francisco, CA) was used at all study sites. All CT images were analyzed at the University of Pittsburgh by one trained reader who was blinded to participant's characteristics. The intraclass correlation coefficients were 0.99 for VAT area and 0.99 for SAT area. 6
Statistical analyses
To compare anthropometric indices and other characteristics across the four sampling strata (Table 1), general analysis of variance models were used for continuous variables. For comparison of dichotomous data, chi-square tests were used. For pairwise comparisons, Bonferroni-adjusted P values were derived by multiplying the unadjusted P values by 6 (the number of comparisons being made). If the subsequently created P value is <0.05, this is equivalent to significance being declared when an unadjusted P value is <0.0083. P values ≥0.05 are not reported. Participants were then divided into approximate tertiles of BMI, defined as low, medium, and high according to BMI strata <24, 24 to <27, and ≥27 kg/m2 (Tables 2 and 3). Anthropometric measures across the study populations within a BMI stratum were then compared using the same methods as in Table 1 (including the derivation of adjusted P values).
Data are mean values (SD) or n (%).
P < 0.05; ** P < 0. 001.
P < 0.001 for overall comparison in all characteristics.
BMI, body mass index; HDL, high-density lipoprotein; SAT, subcutaneous adipose tissue; VAT, visceral adipose tissue; VAT%, proportion of VAT area to the sum of VAT and SAT areas.
Data are mean values (SD).
P < 0.05; ** P < 0. 001.
P < 0.001 for overall comparison in characteristics except VAT (BMI <24, 24 to <27).
Data are mean values (SD).
P < 0.05; ** P < 0. 001.
P < 0.05 for overall comparison in all characteristics except fasting blood glucose (BMI <24) and Triglycerides (BMI <24 and BMI ≥27).
To help account for confounding from other variables, comparisons were further assessed by examining differences of VAT, SAT, and VAT% among the four populations (Table 4 and Fig. 1). In an attempt to further adjust for confounding from BMI, analyses were limited to the medium BMI stratum (24 to <27 kg/m2) because the BMI was significantly different among the four populations. The average BMI within the medium stratum was similar across the four groups. In this analysis using the medium BMI stratum, adjustments were made for age, height, waist circumference, and other factors through the use of general analysis of covariance (ANCOVA) models. Reported P values were also adjusted according to the same Bonferroni correction method described earlier. While VAT%, VAT, and SAT were the dependent variables, three ANCOVA models were considered. The first model (model I) was adjusted for age, height, and waist circumference. The second model (model II) was adjusted for the model I covariates with additional adjustments for smoking status (nonsmokers, former smokers, smokers who smoke <20 cigarettes/day, and smokers who smoke ≥20 cigarettes/day), alcohol intake (grams/day), and work-related physical activity level (sedentary, light, medium, and heavy physical activity) because these factors had been reported to affect VAT area 19 –21 in studies of a singular group. The third model (model III) was adjusted for the model II covariates with additional adjustments for levels of systolic blood pressure, fasting blood glucose, triglycerides, and HDL-cholesterol. Throughout our analyses, all tests were based on a two-sided significance level with α = 0.05. Statistical analyses were performed using the IBM SPSS ver. 22 (IBM Corp., Armonk, NY).
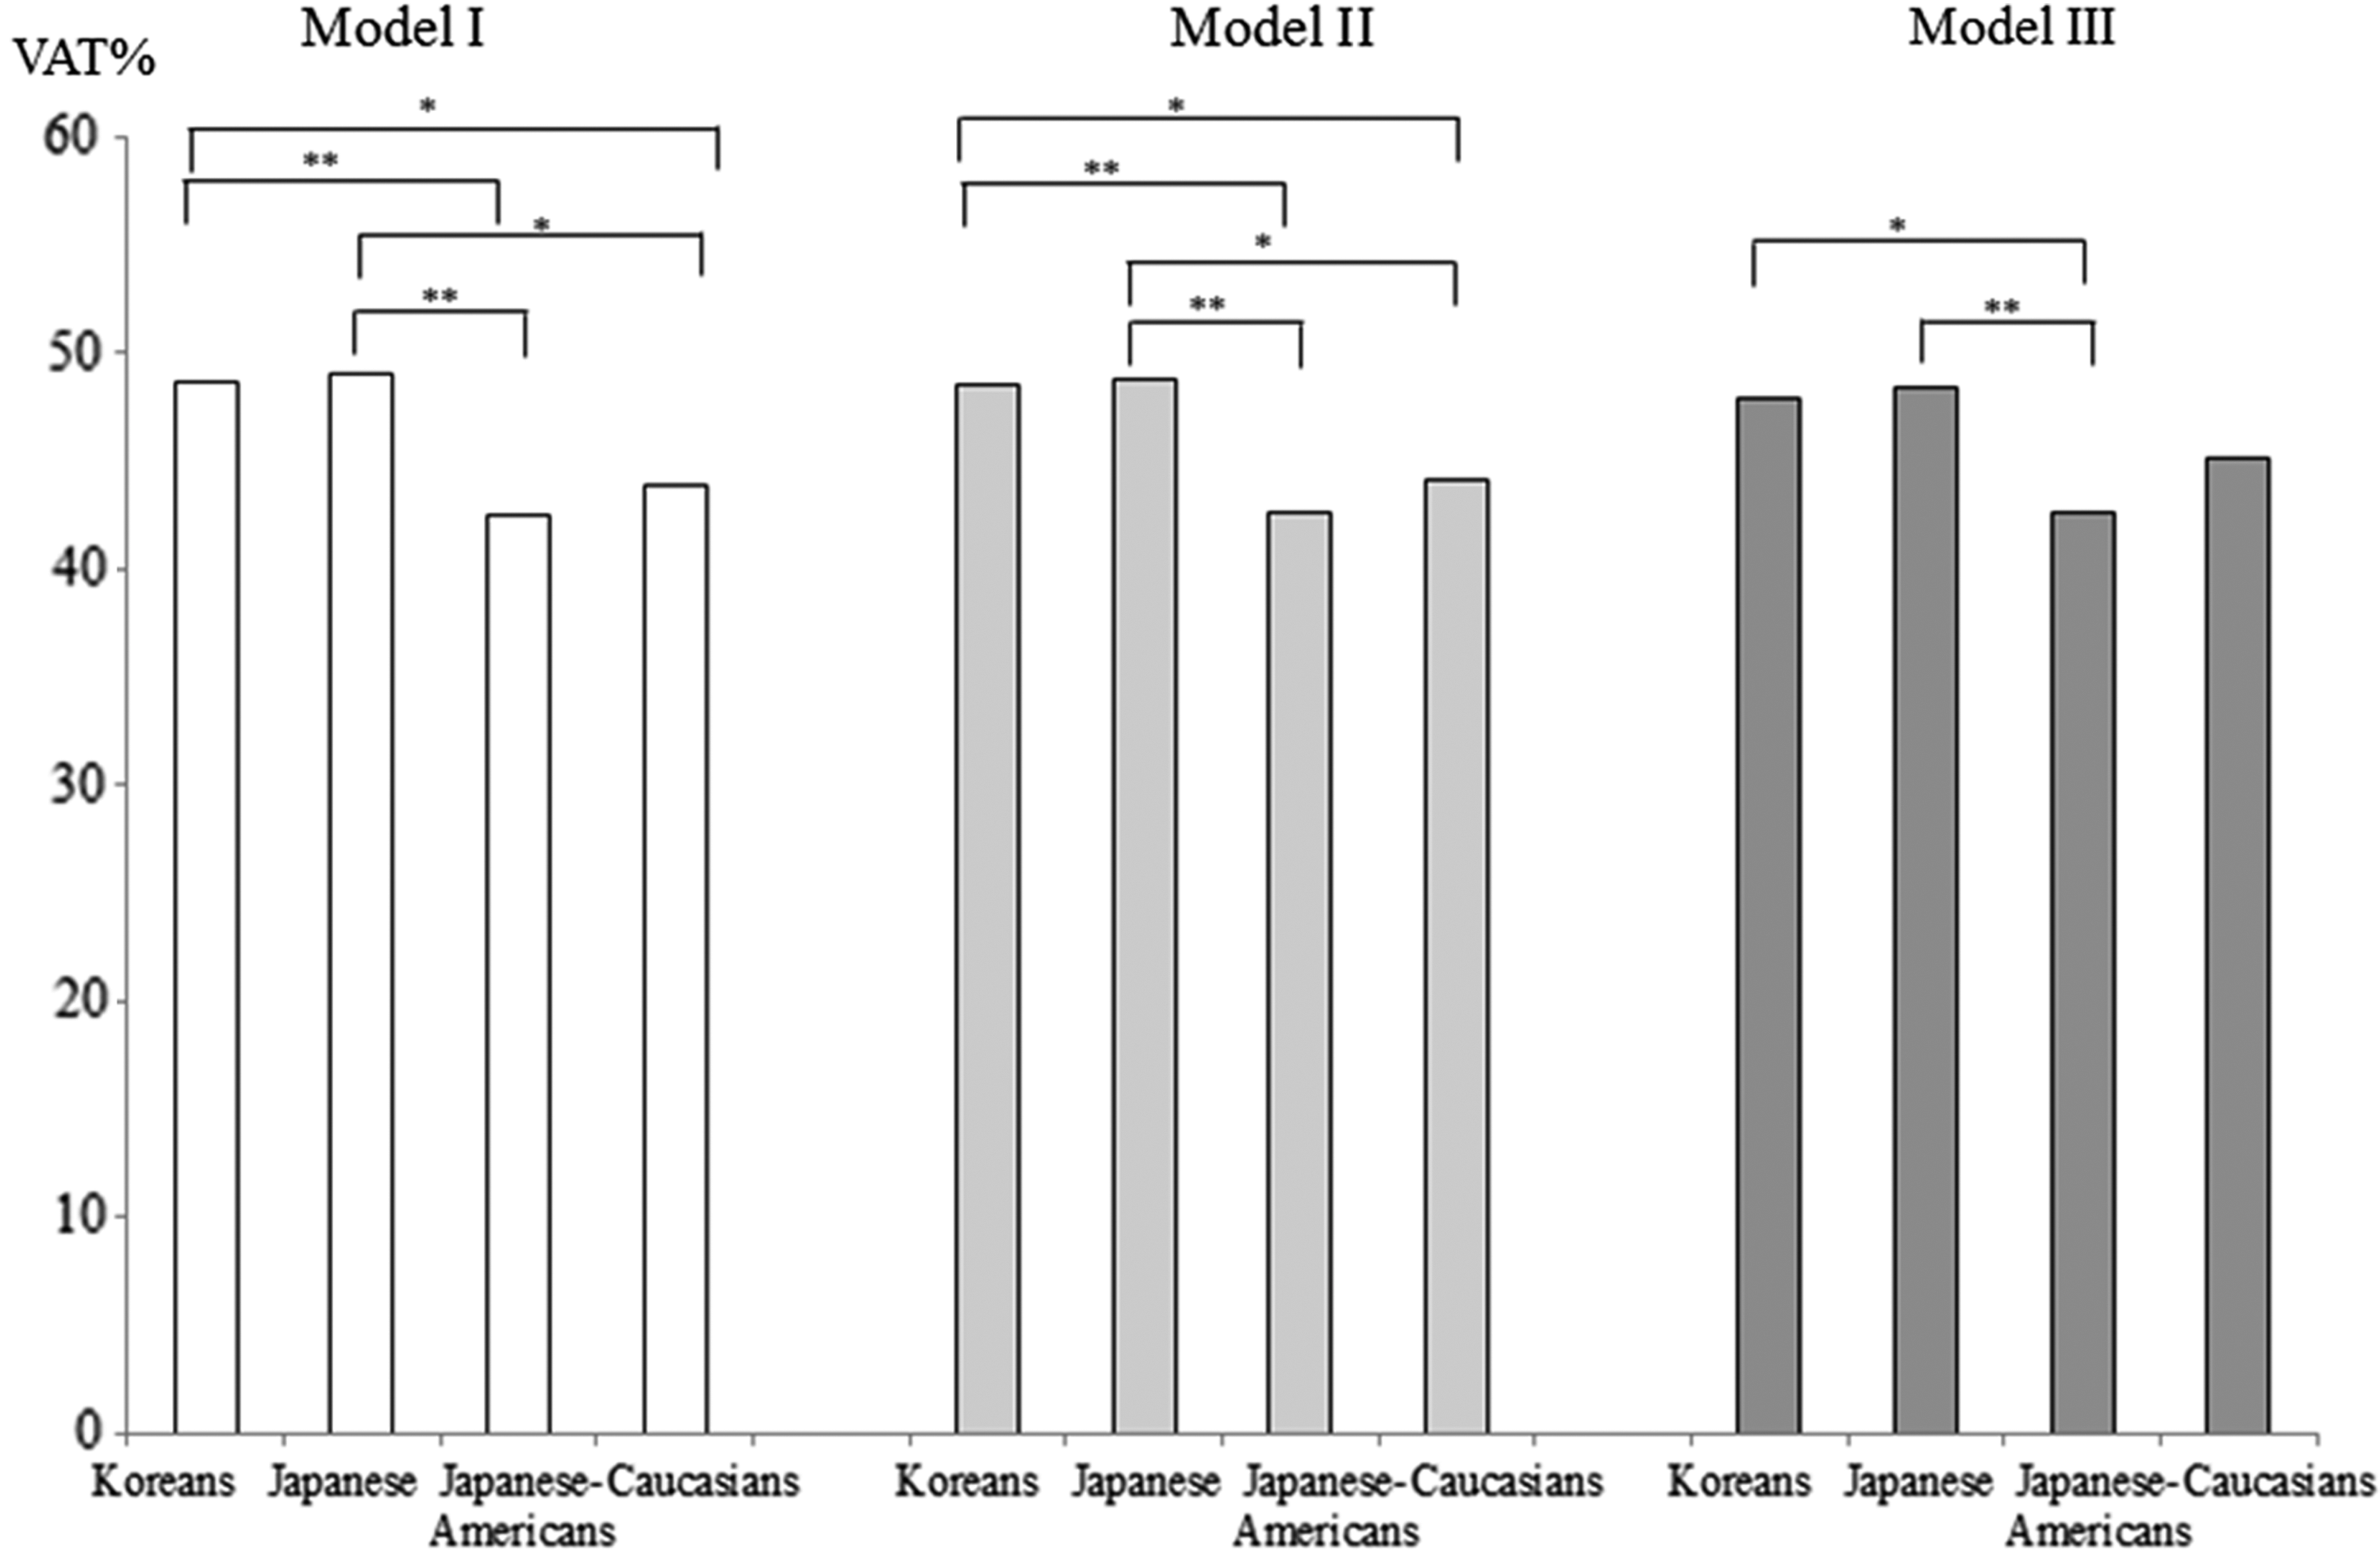
Multivariable-adjusted mean values of VAT% among men with 24≤ body mass index <27 kg/m2. Model I was adjusted for age, height, and waist circumference. Model II was adjusted for variables in model I plus smoking status (nonsmokers, exsmokers, smokers less than 20 cigarettes/day, or smokers 20 cigarettes or more/day), amount of alcohol intake (grams/day), and physical activity levels of the participants' current jobs (sedentary, light physical activity, medium physical activity, or very heavy). Model III was adjusted for variables in model II plus levels of systolic blood pressure, fasting blood glucose, triglycerides, and high-density lipoprotein cholesterol. P < 0.001 for overall comparison in all characteristics. For pairwise comparisons, *P < 0.05, and **P < 0.001. VAT%, proportion of VAT area to the sum of VAT and SAT areas.
Data are mean values (95% CI).
P < 0.05; ** P < 0. 001.
P < 0.05 for overall comparison for all variables.
Model I was adjusted for age, height, and waist circumference.
Model II was adjusted for variables in model I plus smoking status (nonsmokers, exsmokers, smokers less than 20 cigarettes/day, or smokers 20 cigarettes or more/day), amount of alcohol intake (grams/day), and physical activity levels of the participants' current jobs (sedentary, light physical activity, medium physical activity, or very heavy).
Model III was adjusted for variables in model II plus levels of systolic blood pressure, fasting blood glucose, triglycerides, and HDL cholesterol.
CI, confidence interval.
Results
Characteristics and indexes of the abdominal adipose tissue in the four populations are shown in Table 1. Waist circumference was larger in order of Caucasians, Japanese Americans, Japanese, and Koreans. The waist circumference of Japanese and Koreans was not significantly different. BMI was significantly lower in Koreans and Japanese than in Japanese Americans and Caucasians. BMI of Japanese Americans and Caucasians were not statistically different. The areas of VAT, SAT, and total abdominal adipose tissue (the sum of VAT and SAT) were significantly lower in Japanese and Koreans than in Japanese Americans and Caucasians. VAT% was significantly higher in Japanese and Koreans than in Japanese Americans and Caucasians.
Even after dividing participants into three BMI strata, VAT% and SAT were significantly different among the populations. VAT% remained significantly higher in Koreans and Japanese than in Japanese Americans and Caucasians in the low and the medium BMI level, and SAT areas were significantly lower in Koreans and Japanese in each BMI level (Table 2).
Table 3 shows the metabolic indexes by the three BMI strata. No metabolic index was significantly different between Japanese and Japanese Americans.
Table 4 shows the multivariable-adjusted means of VAT and SAT, and Figure 1 shows multivariable-adjusted means of VAT% among the four populations (24 ≤ BMI <27 kg/m2). After adjusting for the potential confounding factors and metabolic factors, the difference in the fat distribution remained. When comparing Japanese Americans with Japanese or Koreans, Japanese Americans had significantly smaller VAT% than Japanese or Koreans.
Discussion
Abdominal fat distributions vary across different races and environments. Our results clarified that environmental differences, apart from racial differences, affect abdominal fat distributions. Comparing groups with an identical race but different environments (i.e., Japanese vs. Japanese Americans), significant differences existed in VAT% and SAT. In contrast, comparing groups with similar races and similar environments (i.e., Japanese vs. Koreans), VAT%, VAT, and SAT did not significantly differ. Comparing groups with different races but similar environments (i.e., Caucasians vs. Japanese Americans), VAT and VAT% were not significantly different. To our knowledge, this is the first report to elucidate that different environments affect the abdominal fat distribution by comparing groups with an identical race but different environments, unlike previous studies in different racial groups in similar environments. 7 –9,22
Our results are consistent with those from previous reports in terms of comparing different races. VAT% is larger in Chinese men than Caucasian men in the same level of obesity. 8 VAT is larger in Japanese, 5,6 Chinese, 8 and Filipino 7 men than Caucasian men in the same level of obesity. SAT is larger in Caucasian men than Asian men, 23 Chinese men 22 or Japanese men 5 in the same level of obesity. In terms of comparing groups with an identical race but different environments, Wang et al. reported that body fat% was different between Asian women aged 20–25-year-old living in the United States for 12 years or longer compared with those living in the United States for shorter than 12 years, 10 suggesting that environments affect fat distribution. In our present report, we concurrently examined the effects of race and environments in middle-aged men who are mostly in the early stage of subclinical atherosclerosis.
We used VAT% rather than absolute VAT area, to enable us to compare populations with different levels of height and obesity. In our study, Caucasians were significantly taller than Japanese Americans, Japanese, and Koreans. BMI of Caucasians and Japanese Americans was significantly greater than that of Japanese and Japanese Americans. While absolute VAT area is an established cardiometabolic risk indicator, 24 some studies report that the proportion of VAT is a better cardiometabolic risk indicator than VAT area itself. 25,26
While factors affecting VAT or SAT distributions are reported, no previous study reported that environmental factors cause different abdominal fat distribution among groups of an identical race. VAT area is reported to be related to dietary intake 20 and exercise. 19 –21 Effects of smoking 20,27 and drinking 28,29 are controversial. SAT area has been reported to be correlated with total energy intake. 30 Our data showed that while smoking, drinking, and work-related physical activity levels were not associated with abdominal fat distribution difference across populations, alcohol consumption in Caucasians and smoking in Japanese and Koreans were significantly associated with abdominal fat distribution (model III). Even after adjusting for those variables, difference in VAT% remained between Japanese Americans vs. Japanese and Koreans (model III in Fig. 1). The results may indicate that the differences in abdominal fat distribution across groups are caused by some environmental factors other than smoking and drinking. Although the results may be due to lack of detailed data, especially for physical activity, it is indicated that these factors do not cause a large impact on the difference in the abdominal fat distribution. Further studies obtaining detailed dietary habit and physical activity are needed to elucidate environmental factors, apart from racial difference, affecting abdominal fat distribution.
As in any observational study, there are several limitations that need to be considered. One is that this is a cross-sectional study. However, in this particular study, reverse causality due to cross-sectional design can hardly have occurred, because each participant was assumed to be of one particular race and in one particular geographical environment for his whole life. The other is that participants were limited to men aged 40–49. While men aged 40s were of particular interest in terms of subclinical atherosclerosis and related factors, women and other age groups also need to be studied. Finally, while we elucidate that environmental factors, apart from racial differences, affected abdominal fat distribution, we could not elucidate specific environmental factors that caused such differences, because data across the four populations were limited. Further studies to elucidate such factors can help prevent abdominal obesity and related diseases.
A strength of the study is the direct comparison of international populations with use of a predetermined standardized protocol (i.e., VAT, SAT, and BMI), minimizing measurement bias across the populations.
In conclusion, abdominal fat distribution was affected by environment factors rather than racial differences in middle-aged men. Additional research will be needed to further identify and clarify specific environmental factors affecting abdominal fat distribution.
Footnotes
Acknowledgments
This work is dedicated to Dr. J. David Curb, the former PI of the ERA-JUMP Honolulu Center, deceased in 2012. We also thank all following members and staff; ERA JUMP Study Group: Pittsburgh, Pennsylvania, USA (Coordinating and field Center) Akira Sekikawa, MD, PhD, Daniel Edmundowicz, MD, Kim Sutton-Tyrrell (deceased), DrPH, Emma J.W. Barinas-Mitchell, PhD, Rhobert Evans, PhD, Lewis H. Kuller, MD, DrPH. (University of Pittsburgh). Honolulu, Hawaii, USA (Field Center) Kamal H. Masaki, MD, Bradley WIllcox, MD (University of Hawaii), Todd B. Seto, MD (Queen's Hospital). Otsu, Shiga, Japan (Field Center) Hirotsugu Ueshima, MD, PhD, Katsuyuki Miura, MD, PhD, Akira Fujiyoshi, MD, PhD, Takashi Kadowaki, MD, MPH, PhD, Takashi Hisamatsu, MD, PhD, Aya Kadota, MD, PhD, Atsunori Kashiwagi, MD, PhD, Kiyoshi Murata, MD, PhD, Kenichi Mitsunami, MD, PhD, Hiroshi Maegawa, MD, PhD (Shiga University of Medical Science), Tomonori Okamura, MD, PhD (Keio University), Yasuyuki Nakamura, MD, PhD (Kyoto Women's University), Ansan City, South Korea (Field Center) Chol Shin, MD, PhD (Korea University).
Funding: This work was supported by Grant-in-aid for Scientific Research [(A) 25253046, (A) 23249036, (B) 24790616, (B) 21790579, (C) 21590688, (C) 23590790, and (C) 23590791] from the Ministry of Education, Culture, Sports, Science, and Technology Japan, and by grants (R01 HL068200 and HL071561) from the National Institutes of Health, United States, and by government budget code: (2004-E71001-00, 205-E71001-00) from Korea Centers for Disease Control and Prevention.
Author Disclosure Statement
No competing financial interests exist.