
Abstract
Background:
The relationship among inadequate vitamin D status, obesity, and cardiometabolic risk and the potential impact of physical activity-based interventions on vitamin D status are poorly characterized in children. This study aimed to address these issues.
Methods:
We studied a total of 21 adolescents (15 obese and 6 normal weight; age: 14–18 years; Tanner stage>IV). Adolescents with obesity (n = 15) underwent a randomized controlled (8 in the intervention group and 7 in the control group) 3-month physical activity-based lifestyle intervention. 25-Hydroxy vitamin D [25(OH)D] by mass spectrometry, adiponectin, leptin, high-sensitivity C-reactive protein (CRP), insulin, and glucose were measured and body composition was assessed by dual-energy x-ray absorptiometry (DXA). Analysis of covariance and mixed-effects model were used to compare mean change in 25(OH)D between intervention and nonintervention groups. Bootstrap method was used to validate the estimates and principle component analysis reduced the variables in the data for adjustment.
Results:
25(OH)D was lower (P < 0.001) in the obese versus lean adolescents. Homeostasis model assessment-insulin resistance, CRP, fat mass (FM), and body mass index z-score were negatively correlated with baseline 25(OH)D, while adiponectin showed a positive correlation. After adjustment for baseline biomarkers of cardiometabolic risk, the concentration of 25(OH)D increased in the obese intervention group (P = 0.06), but not in the nonintervention group. Fat-free mass increased and FM decreased (P < 0.05 for both) in the intervention group. The magnitudes of increase in 25(OH)D and decrease in FM directly correlated (P < 0.05).
Conclusions:
The increase in circulating 25(OH)D concentration by physical activity-based lifestyle-only intervention in adolescents with obesity, who did not receive vitamin D supplementation, suggests a putative independent role of physical activity-based interventions in the regulation of vitamin D status and potentially in the mitigation of risk factors of cardiovascular disease.
Introduction
V
Amid the shadow of conflicting studies and lack of consensus on exact mechanisms for the obesity-related deficiency and/or insufficiency of vitamin D in humans, various hypotheses have been invoked. These include its inadequate input from exogenous sources such as dietary and cutaneous, negative feedback from higher circulating 1,25(OH)2D levels in obesity and/or volumetric dilution and increased clearance by a large body fat pool, sequestration and/or storage in body tissues, predominantly fat, and interaction with muscle. 5 –7 Although complicated, if the obesity-related lower circulating 25(OH)D concentration is linked to its sequestration in fat, then an intervention that reduces fat mass (FM) could result in the release of the fat-stored cholecalciferol into the circulation, leading to an elevation of 25(OH)D concentration. The increased concentration of 25(OH)D should then, potentially, enhance its presumed functions. Physical activity-based intervention could play a role in enhancing the signals that stimulate the metabolism of vitamin D in fat and muscle.
There is increasing interest on the putative “non-classical” roles of vitamin D, particularly on its possible effects on the cardiovascular system. 1,8 Epidemiologic studies have consistently suggested an association between hypovitaminosis D and an increased risk of chronic diseases, including type 2 diabetes (T2DM) and CVD. 9 –11 Since vitamin D receptors are ubiquitously present in the body, including cardiomyocytes and smooth muscle cells, 8 a potential link between vitamin D concentration and CVD is plausible. However, data in children and adolescents are scarce and inconsistencies exist. 12 –14 Nonetheless, vitamin D deficiency and obesity are two highly prevalent health conditions among children and adolescents. 1,15 –17 There are numerous reports and ongoing studies, both in adults and children, on the potential effect of vitamin D supplementation in enhancing the circulating levels of 25(OH)D. 18 –20 Despite the enhancement of 25(OH)D concentration in response to vitamin D supplementation, the majority of studies in children with obesity suggest negligible impact on risk factors for CVD. 18 –22
The potential effect of physical activity-based lifestyle interventions on vitamin D status in children and the relationship between vitamin D deficiency and risk factors of CVD remain unclear in children. This study assessed the effect of a physical activity-based lifestyle intervention on circulating 25(OH)D and the relationship between physical activity and vitamin D status, and selected novel risk factors of CVD in adolescents with simple obesity.
Materials and Methods
Baseline data are included in Tables 1 and 2. Some aspects of this study have previously been reported.
23
Briefly, we studied 21 postpubertal (Tanner stage >4) and age-matched (14–18 years) healthy adolescents in both genders. Of these, 15 were obese and 6 lean, with body mass index (BMI) percentiles for age and sex of >95 and <85, respectively. Participants were excluded from the study if they were taking β-adrenergic blockers and/or steroids, actively participating in any organized diet programs and/or regular exercise activity >20 min twice/week, smokers, and alcoholics. Participants with comorbidities such as diabetes, heart, liver, and/or renal diseases were also excluded. The study protocol was approved by the Baptist Medical Center/Wolfson Children's Hospital Institutional Review Board and the study was registered at
Data are presented as mean and standard error of mean (SEM). Student's t-test P values and bootstrap P values are also included.
HOMA-IR, homeostasis model assessment-insulin resistance; CRP, C-reactive protein; 25(OH)D, 25-hydroxy vitamin D; BMI, body mass index.
FM, fat mass; IL-6: interleukin-6.
Eligible subjects were asked to maintain their current lifestyle, including eating habits, and keep a log of the food they ate for, at least, 3 days before the study sampling days. The evening before the study day, participants were admitted to Wolfson Children's Hospital's Clinical Research Center (CRC), where all patient studies were performed. All blood samples were collected the next day (study day) after a supervised overnight fast at the CRC.
After the baseline study, the obese participants (n = 15) were randomly allocated to either a physical activity-based intervention (n = 8) or a control (n = 7) program. Those in the intervention group underwent a physical activity-based lifestyle intervention, mainly brisk walking, for 45 min a day thrice a week for 12 weeks. 23 Each week, a research team member monitored one of these workout sessions and at least one parent participated. The activities of the participants during the rest of the days were monitored by the parent(s). The physical activity intervention was supplemented with other lifestyle changes such as snacking less, switching high-calorie snacks with low-calorie/low-fat ones, reducing portion size of meals, limiting the intake of sugar-based carbonated drinks, and minimizing the amount of time spent watching television. Participants in the obese control group were advised not to change their routine lifestyle during the study period. The participants in the lean control group were studied only at baseline. 25(OH)D was measured using liquid chromatography-tandem mass spectrometry (LC MS-MS), body composition by dual-energy x-ray absorptiometry (DXA), and biomarkers of CVD as previously described. 23
Statistical analysis
Baseline characteristics, including cardiometabolic disease markers and 25(OH)D levels of the participants, were summarized by lean and obese, as well as by intervention and nonintervention groups. An unpaired t-test was used to compare mean 25(OH)D levels and other cardiometabolic markers between the lean and obese groups, as well as between intervention and nonintervention groups. The bootstrap method, a data-based simulation where random samples undergo repeated replacement from the original data, was used to assess the accuracy of estimated means and standard errors of the mean (SEM).
Pearson correlation coefficient was used to examine the association of 25(OH)D levels with cardiometabolic markers such as FM, homeostasis model assessment-insulin resistance (HOMA-IR), adiponectin, leptin, log C-reactive protein (CRP), IL-6, albumin, and BMI z-score in combined (lean plus obese) and obese participants. Based on the correlation of baseline cardiometabolic markers with 25(OH)D levels, HOMA-IR, adiponectin, log CRP, and IL-6 were selected to adjust for the analysis to compare the preintervention to postintervention mean change in 25(OH)D levels between the intervention and control groups.
The small sample size might not be adequate for adjusting the relevant analysis of the four correlated cardiometabolic markers. Therefore, to reduce the number of variables for adjustment, we performed a principal component analysis (PCA) of baseline cardiometabolic markers and generated latent variables based on the correlations of the four cardiometabolic markers. These latent variables (principal component [PC] scores) were generated as a linear combination of the original variables such that the PCs are ordered. The first PC (PC1) accounts for as much variability in the original variables as possible and then each succeeding PC, in turn, has the next highest variance possible. This resulted in a very high correlation of 25(OH)D with PC1 only and PC1 was selected for adjusting the analysis of comparison of postintervention mean change in 25(OH)D between the two groups.
Analysis of covariance (ANCOVA) was performed to compare the mean change in 25(OH)D from preintervention to postintervention measures. The analysis was adjusted for the baseline 25(OH)D levels and PC1. A bootstrap analysis of 1000 replications of the data, with replacement and stratified by treatment group, was performed to assess the accuracy of the estimates in the ANCOVA model. In addition, a mixed-effects model with a random slope was used to compare the mean trajectories of the change in 25(OH)D between the two groups. Time of measurements (preintervention and postintervention), treatment, interaction of time and treatment, and baseline 25(OH)D levels were used as the fixed effects. Time was also used as the random effect to account for the heterogeneity in the individual-level changes in 25(OH)D. The predicted mean trajectories of change in 25(OH)D are presented in Fig. 1. Model assumptions were checked before analyses. All tests were two tailed at the level of significance of 0.05. The statistical software SAS version 9.3, SAS Institute, Cary, NC, was used for the analysis.
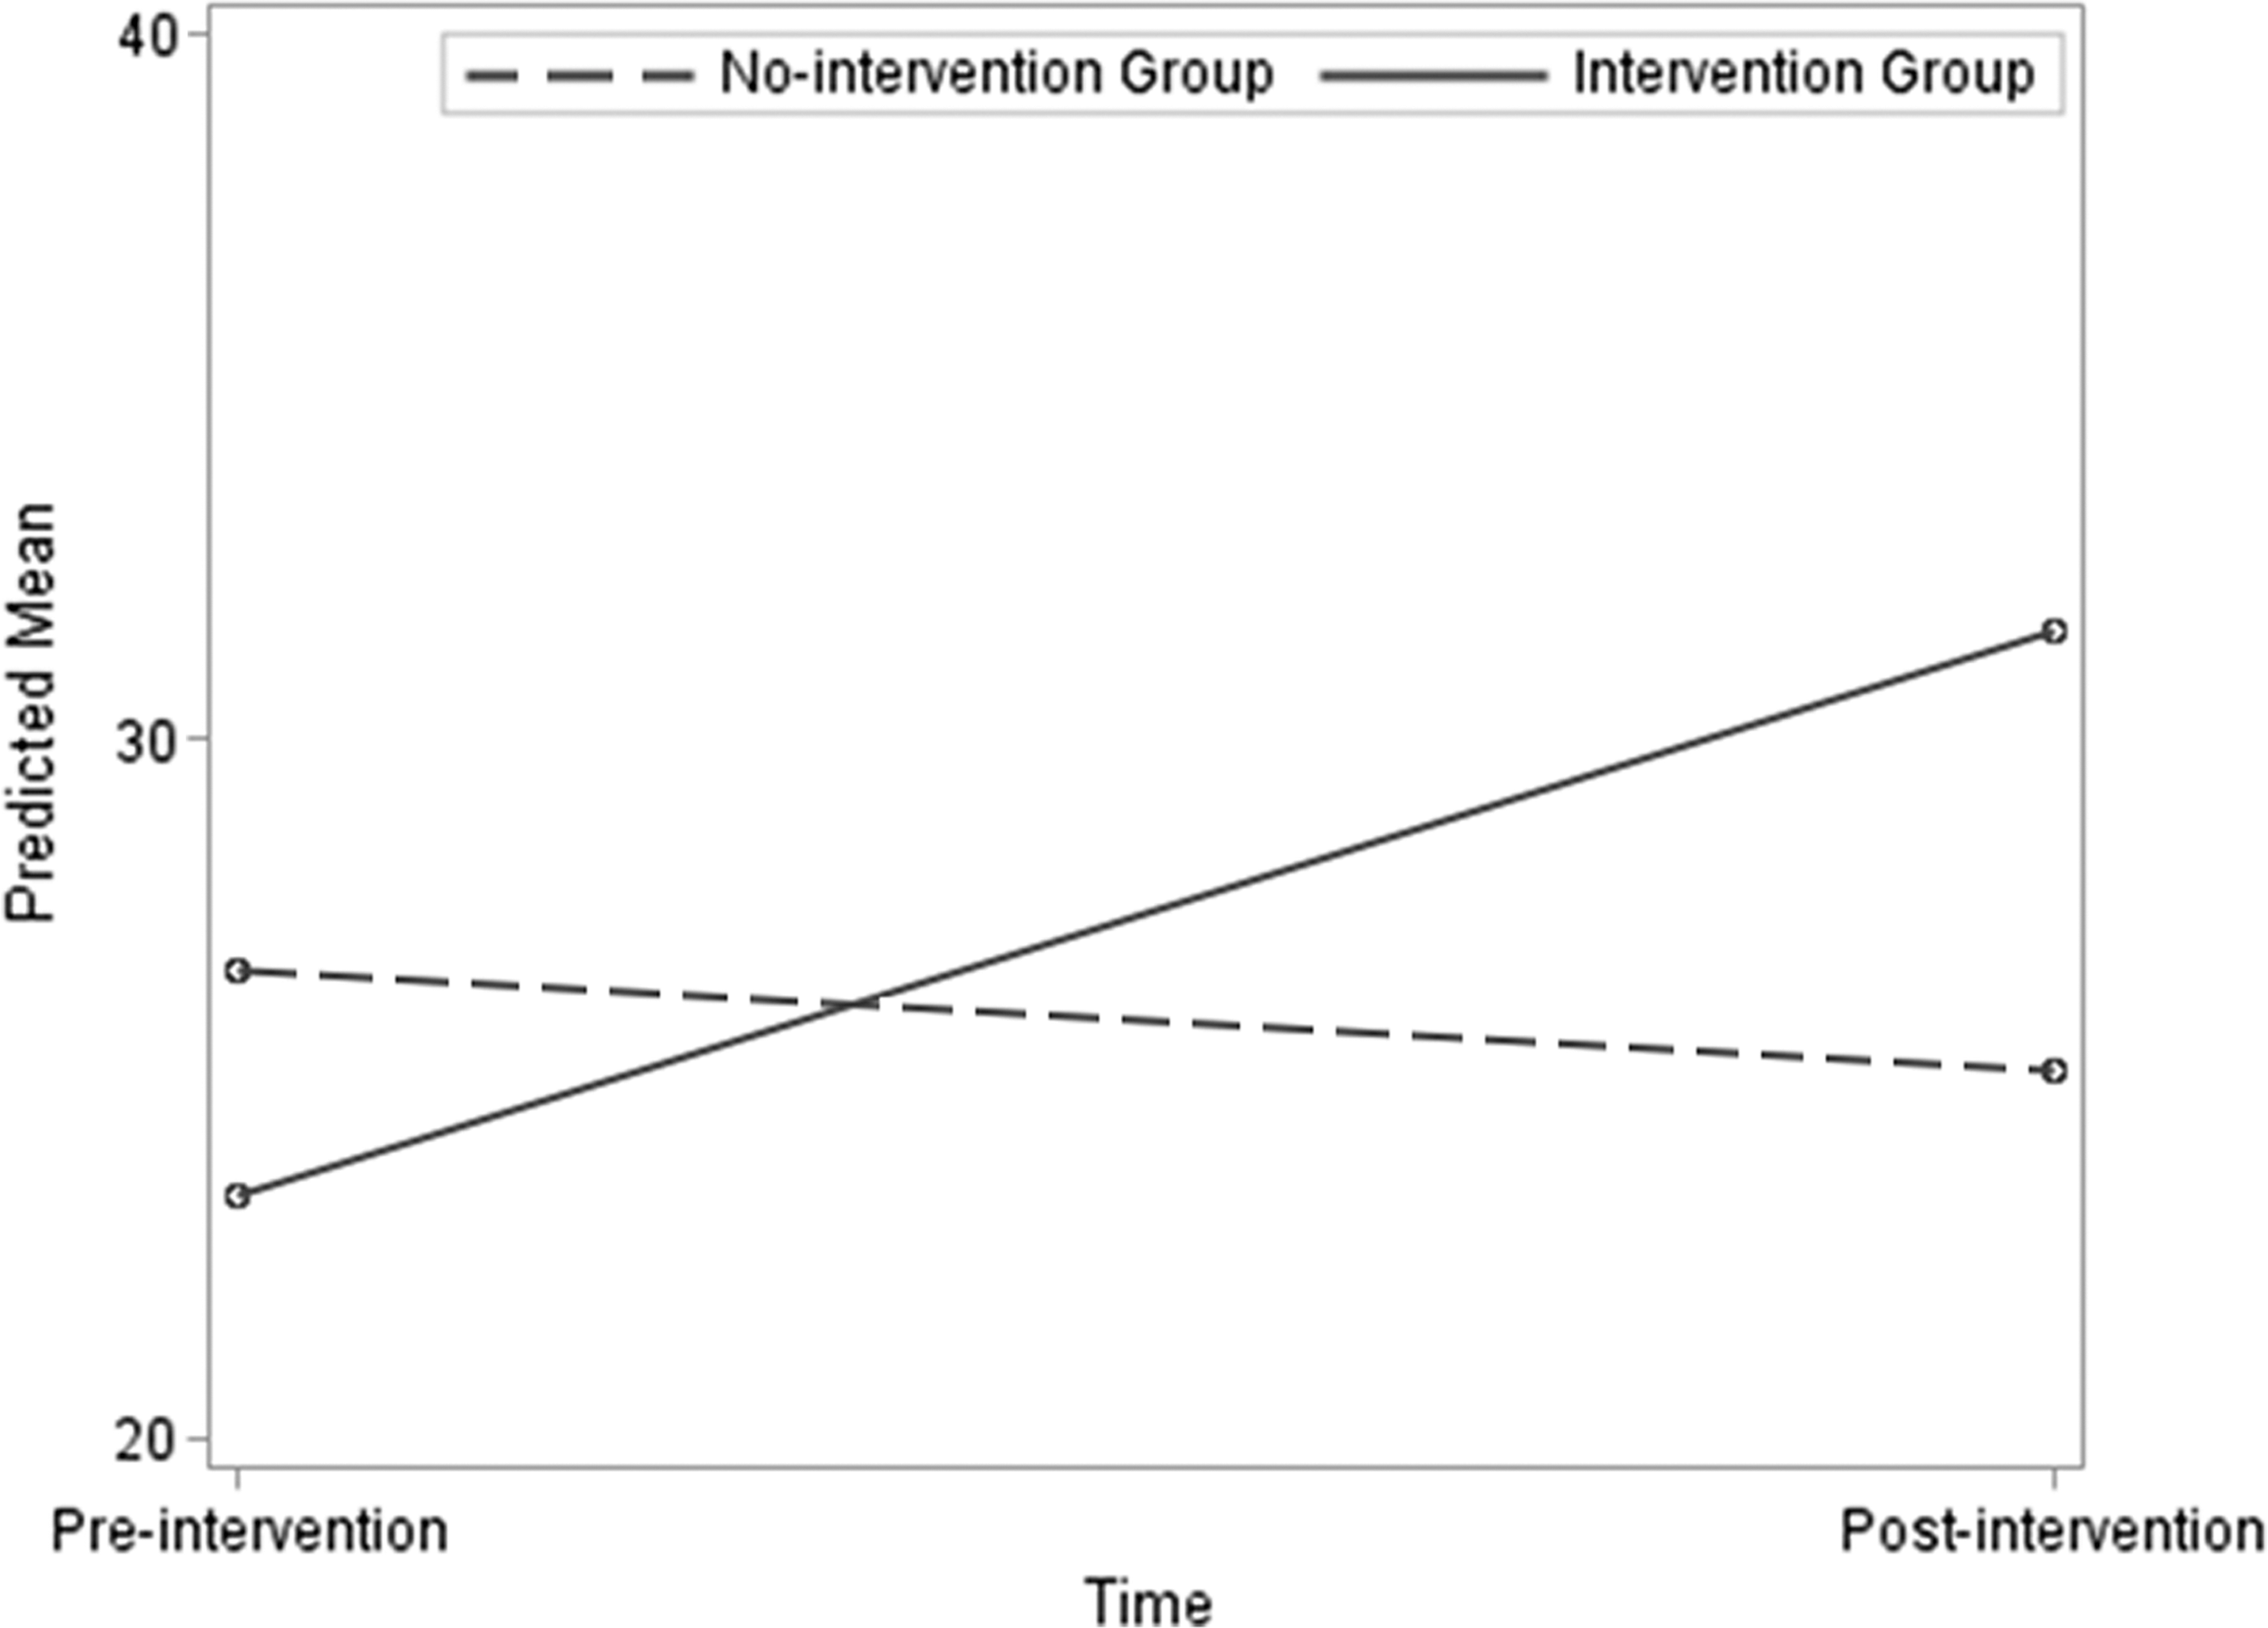
Mean changes in 25(OH)D between intervention and no-intervention groups. Figure 1 presents the predicted mean trajectories of change in 25(OH)D. A mixed-effects model with a random slope was used to compare the mean trajectories of the change in 25(OH)D between the two groups. Time of measurements (preintervention and postintervention), treatment, interaction of time and treatment, and baseline 25(OH)D levels were used as the fixed effects. Time was also used as the random effect to account for the heterogeneity in the individual-level changes in 25(OH)D. 25(OH)D, 25 hydroxyvitamin D.
Results
Table 1 presents the mean and standard error of mean (SE) of 25(OH)D levels and other cardiometabolic markers in lean and obese groups. Corresponding data for the intervention group are also included. The baseline mean 25(OH)D (SE) in obese participants (24.41 [13.24] ng/mL) was significantly lower than that in their lean counterparts (51.63 [6.59] ng/mL). The difference in the mean between the two groups (obese vs. lean) was 27.22 (6.78) ng/mL, P = 0.001 with the bootstrap estimated P value of 0.006. The baseline mean cardiometabolic markers such as FM, HOMA-IR, adiponectin, leptin, log CRP, and IL-6 were significantly different between lean and obese, but not between the two obese groups. The analogous P values of the t-test and bootstrap analyses in Table 1 justify the robustness of comparisons between groups based on our dataset of the small sample size.
Table 2 presents the Pearson correlation coefficients of baseline 25(OH)D with baseline cardiometabolic markers in both combined (lean + obese) and obese-only participants. In the combined sample, when considered a continuum, all markers were highly correlated with 25(OH)D levels. Adiponectin showed a positive correlation with 25(OH)D, while BMI z score, FM, HOMA-IR, leptin, CRP, and IL-6 displayed negative correlations. Only HOMA-IR, adiponectin, log CRP, and BMI z score had moderate to high correlations with baseline 25(OH)D levels when obese-only participants were considered. The first PC (PC1) accounted for about 52% of the total variation of these four variables, the second PC (PC2) explained for 21%, and the third PC (PC3) explained for 14% of the total variation. Table 3 provides the correlation of the first three PCs with 25(OH)D levels and the four markers used for PCA. Only PC1 strongly correlated with 25(OH)D (r = −0.61) and was therefore selected for the adjustment of the analysis of comparing the postintervention change in 25(OH)D between intervention and nonintervention groups.
PC, principal component.
After adjustment for baseline values, there was a substantial preintervention to postintervention increase in mean 25(OH)D levels (standard error [SE]): 7.89 (3.73) ng/mL, P = 0.06, in the intervention group, but a slight decrease in mean 25(OH)D levels in the nonintervention group, −1.3 (3.73) ng/mL, P = 0.73 (Fig. 2). Although not significant, the difference in the mean change in 25(OH)D levels between the two groups was substantial, mean difference (SE) = 9.19 (5.3), P = 0.11. The bootstrap P value of this comparison was 0.20. After further adjustment for the PC1, the preintervention to postintervention estimated mean change in 25(OH)D levels (SE) was 8.04 (3.98) ng/mL, P = 0.07, and −1.45 (3.96) ng/mL, P = 0.71 in the groups with and without intervention, respectively. The estimated mean difference (SE) in the change in 25(OH)D levels between the two groups was 9.49 (5.74), P = 0.13, and the bootstrap P value of this comparison was 0.28. There was a participant with extremely outlying increase in the mean change in 25(OH)D levels in the intervention group. In this small sample, the outlier could have a substantial impact on the estimates and therefore, to account for this, we dropped the outlier and repeated the analysis. The estimated mean change was 3.15 (2.18) ng/mL, P = 0.19, and −1.05 (2.01) ng/mL, P = 0.62, in the intervention and nonintervention groups, respectively. The mean difference in the change in 25(OH)D levels (SE) was 4.20 (3.04) ng/mL, P = 0.20, and the bootstrap P value of this estimate was 0.24. In the mixed-effects model, the mean trajectories of the change in 25(OH)D levels (interaction of time and treatment group) were significantly different between two groups (P = 0.02).
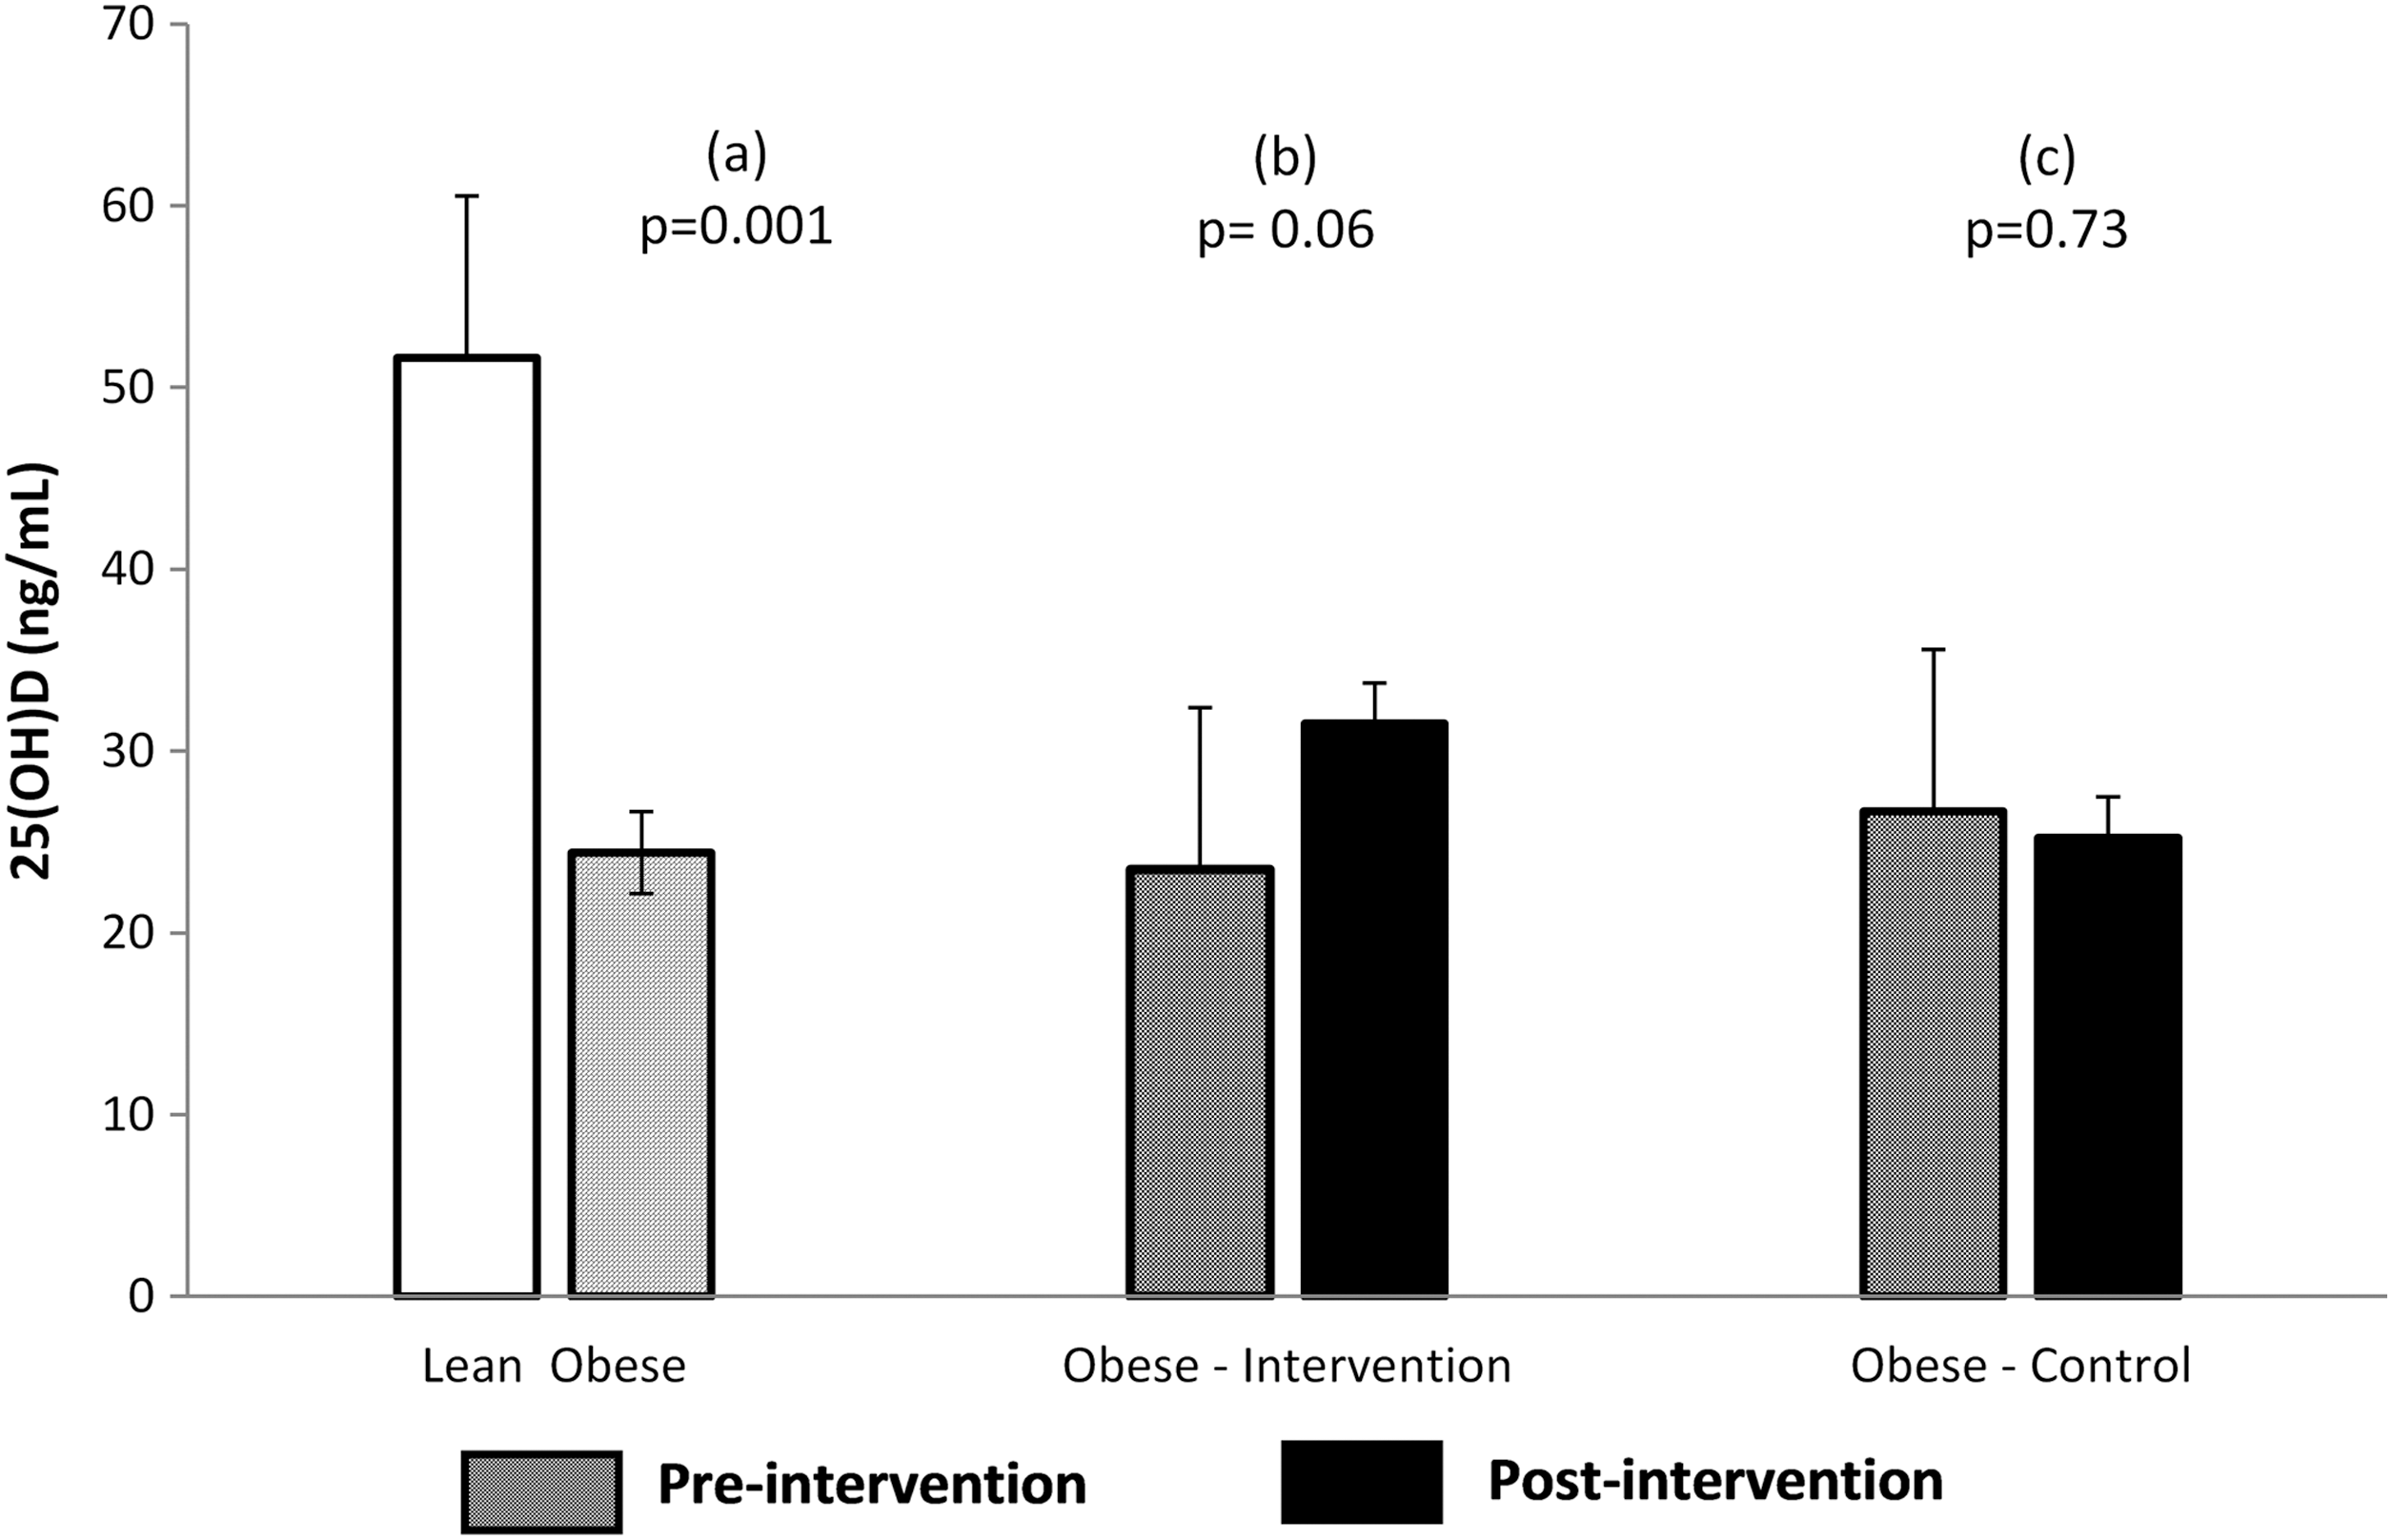
Adjusted mean differences in 25(OH)D. 25(OH)D concentration (ng/mL):
While FM decreased, fat-free mass (FFM) increased (P < 0.05 for both) in the intervention group. Since these and the changes in the cardiometabolic factors have been reported in our previous reports, 23 these are not included in this study. However, we used these data for clarity of interpretation of the changes in 25(OH)D levels. We found that the Δ-increase in 25(OH)D in response to the intervention was related to Δ-decrease in FM (Spearman rank correlation coefficient, ρ = −0.7 and P = 0.006), with a rather modest relationship (ρ = −0.5, P = 0.06) between 25(OH)D and Δ-increase in FFM. The magnitude of intervention-induced changes in 25(OH)D levels correlated with the corresponding magnitude of changes in HOMA-IR (ρ = −0.71, P = 0.005), log CRP (ρ = −0.56, P = 0.04), and adiponectin (ρ = 0.53, P = 0.05).
Discussion
The increased concentration of 25(OH)D by physical activity-based lifestyle-only intervention, without vitamin D supplementation in adolescents with obesity, was similar to the increases that were elicited by vitamin D supplementation, as reported in previous studies. The magnitudes of increase in 25(OH)D concentration and decrease in DXA-derived FM showed a direct correlation. Robust relationships between baseline 25(OH)D concentration and various biomarkers of obesity-related cardiometabolic disease were also observed. To our knowledge, this is the first report in children investigating the direct effect of a lifestyle-only intervention on the 25(OH)D concentration in nonvitamin D supplemented children/adolescents with obesity.
Recently, Cediel et al. suggested a precipitous decline in 25(OH)D with the onset of puberty and that this decline could be, at least in part, explained by puberty-related physiologic increase in adiposity. 14 In a separate study, they reported a negative association between 25(OH)D and body fat and insulin resistance, as well, in prepubertal children. 24 In this study, we not only show diminished 25(OH)D concentration in postpubertal adolescents with severe obesity compared to age-matched normal-weight counterparts, similar to previous reports, 3,4,25 but also a close relationship with an increase in DXA-derived FM. While there is no consensus on the exact mechanisms for decreased levels of 25(OH)D in obese children, one argument hinges on the notion that vitamin D is fat soluble and is sequestered in fat, likely resulting in its diminished levels and possibly making it less available for its deemed functions. 5
The association of low vitamin D levels with increased risk for CVD per se remains contentious, especially in children. 17,26 –33 This study showed robust relationships between 25(OH)D concentration and various baseline novel cardiometabolic risk factors. Leptin, IL-6, CRP, and HOMA-IR were negatively correlated with 25(OH)D, while adiponectin was positively correlated, similar to previous studies. 26,30 –32 In a study in obese African American adolescents, CRP was not significantly associated with 25(OH)D levels. 16 The conflicting data may be attributable to the differences in the cohorts studied such as the degree of obesity, age, pubertal status, ethnicity, and/or the degree of CVD risk, the degree of hypovitaminosis D, and the variance in study protocols, including the methods employed for measuring 25(OH)D levels and seasonal effects. On the other hand, the significant correlations among the magnitude of change in 25(OH)D concentration and cardiometabolic risk factors such as adiponectin, CRP, and HOMA-IR in this study are interesting. Although interesting and these data shed light on the potential role of these biomarkers of CVD in the regulation of 25(OH)D, considering the small sample size, these observations need to be confirmed in larger studies.
The enhancement of 25(OH)D levels in non-vitamin D supplemented adolescents with obesity, in response to a physical activity-based lifestyle-only intervention, is remarkable. Interestingly, the magnitude of increase in the concentration of 25(OH)D was comparable to that elicited through the supplementation of vitamin D3, as reported in various studies in children and adolescents with obesity. 18 –20,34 Adult studies have shown that interventions to reduce adiposity are associated with an increased 25(OH)D concentration in participants with obesity. 35,36 Reinehr et al. showed an increase in 25(OH)D concentration in obese children with absolute weight reduction, but not in those without significant weight loss. 37 These studies suggest the potential role of obesity parameters in regulating the status of vitamin D. The strong correlation between the magnitudes of increase in 25(OH)D and decrease in DXA-derived FM, and increase in FFM, without absolute weight reduction in this study, suggests the potential role of redistribution of body composition parameters rather than body weight per se in the regulation of vitamin D status in obese adolescents. Furthermore, the increase in 25(OH)D concentration seems not attributable to the ingested vitamin D, as the participants were not supplemented by exogenous vitamin D other than that ingested in their regular diet.
The potential mechanisms for the lower concentrations of vitamin D in the obese versus lean remain unclear. In pursuant to the argument of sequestration of vitamin D in the adipocytes, 38,39 the close relationship between the Δ-decrease in FM and Δ-increase in 25(OH)D, observed in this study, could indicate the release of the fat-stored vitamin D leading to its increased levels. Recently, Gangloff et al. reported a linear relationship between physical activity-induced reduction in adiposity and 25(OH)D concentration in sedentary and dyslipidemic obese men with obesity. 7 The relationship between CVD and vitamin D levels is difficult to establish in children, as overt CVD is not often present in children. The beneficial effects of vitamin D supplementation on CVD risk factors, despite an absolute increase in 25(OH)D concentration in vitamin D supplemented children remain ambiguous. This may suggest that the sole increase in the concentration of circulating 25(OH)D is not sufficient for its beneficial effects and it appears that the physical activity-based intervention could mobilize the metabolic functions of 25(OH)D if and when it is available, either by its release from fat or through other mechanisms. The increase in FFM observed in the obese intervention group also showed a relationship with the enhanced 25(OH)D levels corroborating the potential role of muscle in the maintenance of vitamin D levels and/or vice versa in the body. 40
All studies were performed at our CRC after an overnight fast and in metabolically stable conditions, under the supervision of experienced clinical personnel at the CRC. This and the well-matched and controlled participants in the study may have helped offset potential variabilities. The study results should be interpreted cautiously, considering the relatively small sample size and other limitations of this study.
As in any study with a small size, the estimates can be less reliable as the model assumptions can easily be violated and selection bias as well as outliers can distort the estimation. To recuperate the limitation of small sample size, we used a bootstrap analysis for validating our estimations (see Statistical Analysis section). The results of parametric tests resemble the bootstrap analysis results, indicating robustness of our estimations, despite the small sample size. Future studies with larger sample size should build on these results for further confirmation as well as extension of these findings to other settings such as different ethnic groups.
Since we do not have an objective measure of exercise intensity in this study, the increase in 25(OH)D concentration should be interpreted prudently and may not be attributable, exclusively, to the physical activity-based intervention. We do not have tangible measures of dietary intake in this study. Furthermore, we could not exclude the possibility that the active children might have received more sunlight as we do not have objective measures of sun exposure to delineate the contribution of cutaneous vitamin D synthesis. While acknowledging the relationship between sun exposure and 25(OH)D synthesis, intriguingly, the clinic-monitored intervention in our study was performed indoors without direct exposure to sunlight. Other potential limitations include the lack of information on calcium intake before and during the study period, the somewhat shorter duration of the study, and lack of measurement of parathyroid hormone (PTH).
We report that a physical activity-based lifestyle-only intervention, without vitamin D supplementation, enhances 25(OH)D concentration to a magnitude similar to that elicited by physiological doses of vitamin D supplementation, in previous studies, in adolescents with obesity. The improvement in 25(OH)D status, although did not completely normalize the suboptimal vitamin D levels, was associated with a remarkable decrease in FM and an increase in FFM, suggesting a pivotal role of body composition in the regulation of vitamin D status in obese adolescents.
Physical activity is known to have substantial health benefits and the increase in 25(OH) by physical activity-only intervention gives another dimension to it. While arguments for and against vitamin D supplementation exist, additional research is warranted to determine whether a combination of physical activity and vitamin D supplementation may have synergistic and/or additive beneficial effects, especially in children with obesity. The data from this study also point to the crucial need for careful monitoring of physical activity levels/patterns in vitamin D supplementation trials to preclude potential data bias due to this confounder.
Footnotes
Acknowledgments
We thank the volunteers for their participation, Linda Russell and Leslie Berry for excellent support with the study, Burnese Rutledge and the nursing staff of the CRC for their superb assistance, and Karl Mann and Shawn Sweeten, Nemours Biomedical Analysis Laboratory, for their skilled technical assistance. Funding: American Heart Association grant no. 0030342B.
Author Disclosure Statement
No conflicting financial interests exist.