
Abstract
Objective:
A sex-specific standard waist circumference (WC) is widely used to determine cardiometabolic risk across ages even though aging impacts the link between fat distribution and cardiometabolic risk. The objective was to propose WC thresholds that better predict metabolic abnormalities according to sex, age, and body mass index (BMI) categories.
Methods:
First, receiver operating characteristic analyses were performed to identify optimal age (20–49, 50–64, and 65–80 years) and BMI (normal weight, overweight, obese I, and obese II+) specific WC thresholds to correctly identify at-risk individuals, that is, presenting ≥2 cardiometabolic risk factors of metabolic syndrome (n = 23,482; NHANES 2007–2014). Second, cross-validation analyses (n = 18,686; NHANES 1999–2006) were used to validate these WC optimal thresholds. Univariate logistic regression models with WC as an independent predictor were performed to quantify odds of being at-risk for each age and BMI subgroups.
Results:
When age and BMI categories were considered in the identification of optimal WC thresholds, sensitivity to correctly identify at-risk individuals significantly improved.
Conclusions:
Our results indicate that the use of WC thresholds that are specific to age and BMI subcategories significantly increases the capacity to accurately identify at-risk individuals. They would thus be highly appropriate for clinicians in the context of efficient cardiometabolic risk assessment and intervention recommendations.
Introduction
T
Several WC thresholds have been accepted to assess abdominal and visceral obesity related health risks in the context of MetS. 16 –18 On the basis of several reports and studies, 11 the NCEP ATP III uses WC ≥102 cm for men and ≥88 cm for women. 19 In contrast, and given that the prevalence of MetS increases proportionally with adiposity levels, 20 Ardern et al. 21 have proposed specific WC thresholds according to sex and BMI categories to identify more efficiently individuals at increased health risk. However, despite the increasing prevalence of MetS and WC with aging in both sexes, 22 –24 the contribution of aging to the association of WC with MetS has not been considered in clinical practice. It cannot be ruled out that the crude and BMI-WC thresholds 21,25 may overestimate or underestimate obesity related health risks in some age groups. 26
Thus, the aim of the present study was to propose optimal WC thresholds to better identify individuals having two or more components of MetS when taking into account sex, age, and BMI.
Methods
This study was conducted using data from The National Health and Nutrition Examination Survey (NHANES) 1999–2014. In brief, the NHANES procedures involved a household interview and a thorough health examination. Participants were asked questions about education level, health status, and lifestyle behaviors, including alcohol intake and smoking. The health examination was performed in a mobile examination center. All participants provided written informed consent. The National Center for Health Statistics approved the protocol. 27
Metabolic syndrome
According to the harmonized definition, MetS was based on the presence of at least three of the following criteria: (1) elevated WC (≥102 cm in men; ≥88 cm in women), (2) high triglycerides (≥1.69 mmol/L), (3) low HDL-C (<1.30 mmol/L in women and <1.03 mmol/L in men), (4) high resting blood pressure (≥130/85 mmHg or pharmacological treatment for hypertension), and (5) elevated fasting plasma glucose levels (≥5.6 mmol/L or pharmacological treatment for diabetes). 28
Anthropometric measures
Body weight and height were measured to the nearest 0.1 kg and 0.1 cm, respectively. BMI was then calculated [weight (kg)/height (m2)]. WC was measured to the nearest 0.1 cm at the iliac crest level.
Blood lipids
Triglycerides and HDL-C levels were measured after an overnight fast (for at least 9 hr). Blood samples were stored at −20°C and shipped to Fairview Medical Center Laboratory at the University of Minnesota for analysis, based on NHANES laboratory protocol (NHANES 2010). Fasting plasma glucose was measured using a modified hexokinase enzymatic method (NHANES 2003–2004).
Resting blood pressure
Resting systolic (SBP) and diastolic (DBP) blood pressure were measured using a mercury sphygmomanometer (NHANES 2010). Participants were instructed to rest in a sitting position quietly for 5 min before measurements. Four measurements were recorded, and then the average value was used for both SBP and DBP.
Statistical analysis procedures
Continuous data are presented as mean ± SD, whereas categorical variables are presented as n and %. Unpaired t-tests were performed to compare group means, and Chi-squared tests were used to identify differences for categorical variables among groups. Factor analyses were also performed to compare within and between age and BMI subgroups.
Step 1: WC threshold identifications
Participants were included in the analysis if they had complete data for the components of MetS, as well as measurements of WC. The sample was limited to participants aged between 20 and 80 years (n = 23,482; 48.6% men).
For the purposes of this study, we used the clustering of two or more components of MetS in the receiver operating characteristic (ROC) curve as the target outcome. Consequently, threshold values for WC were determined within age and BMI categories with optimum sensitivity and specificity to identify individuals having two or more metabolic abnormalities associated with MetS. Sensitivity was defined as the probabilityof correctly identifying individuals having high risk (true positive) to develop cardiometabolic complications. Specificity was defined as the probability of correctly identifying individuals having no risk (true negative) at a given WC threshold.
Optimal WC threshold values were determined based on the lowest distance from upper-left corner to the ROC curve in younger (20 to 49 years), middle age (50 to 64 years), and older (65 to 80 years) men and women who were normal weight (18.5 to 24.9 kg/m2), overweight (25.0 to 29.9 kg/m2), obese grade I (30.0 to 34.9 kg/m2), and obese grade II+ (≥35.0 kg/m2).
Step 2: cross-validation and assessment of WC threshold performance to detect the clustering of components of MetS
Once WC thresholds specific to gender, age, and BMI categories were determined using the NHANES 2007–2014 sample, sensitivities and specificities were computed using data from the NHANES 1999–2006. For consistency with the developmental study, the sample was limited to those 20 to 80 years of age (n = 18,686; 47.7% men). The clustering of risk factors associated with MetS criteria was determined using the same components as in first step. Overall, this procedure of cross-validation consists in determining the ability of WC thresholds found in the first step to correctly classify individuals having ≥2 or <2 components of MetS. Sensitivity and specificity were calculated using the same equations cited above.
The optimal WC thresholds found at step 1, and validated at step 2, were used to classify individuals with normal and elevated WC. Then, univariate logistic regression models using binary WC threshold (normal WC vs. elevated WC) were used to quantify the odds of having a clustering of at least two components of MetS for each age and BMI categories, for both sexes.
All analyses were performed using SPSS 20 program for windows (IBM Corp., Armonk, NY), with statistical significance set at P ≤ 0.05.
Results
Table 1 shows the general characteristics of the study sample used to determined WC thresholds. Men (48.6%) and women (51.4%) were represented equally and were similar for age (49.5 ± 17.8 years and 49.6 ± 17.8 years, respectively). Mean BMI was significantly higher in women than men, whereas WC was significantly higher in men (P ≤ 0.001). Compared to women, men presented a more deteriorated cardiometabolic profile with higher triglyceride and fasting glucose levels, higher resting systolic and DBP, and lower HDL-C values (all P ≤ 0.001).
P ≤ 0.001: Significant difference between sexes (independent t-test).
P ≤ 0.001: Significant difference between sexes (chi-squared test).
BMI, body mass index; HDL-C, high density lipoprotein cholesterol; WC, waist circumference.
Mean WC (Table 2) and optimal AGE+BMI-WC thresholds (Table 3) increased significantly among each age and BMI groups (P ≤ 0.001) and were significantly higher in men than women for each subgroup (P ≤ 0.001). Except for the obese II+ category where no significant difference was observed, younger men and women had significantly lower WC thresholds compared to middle age and elderly individuals for a given BMI category (P ≤ 0.001).
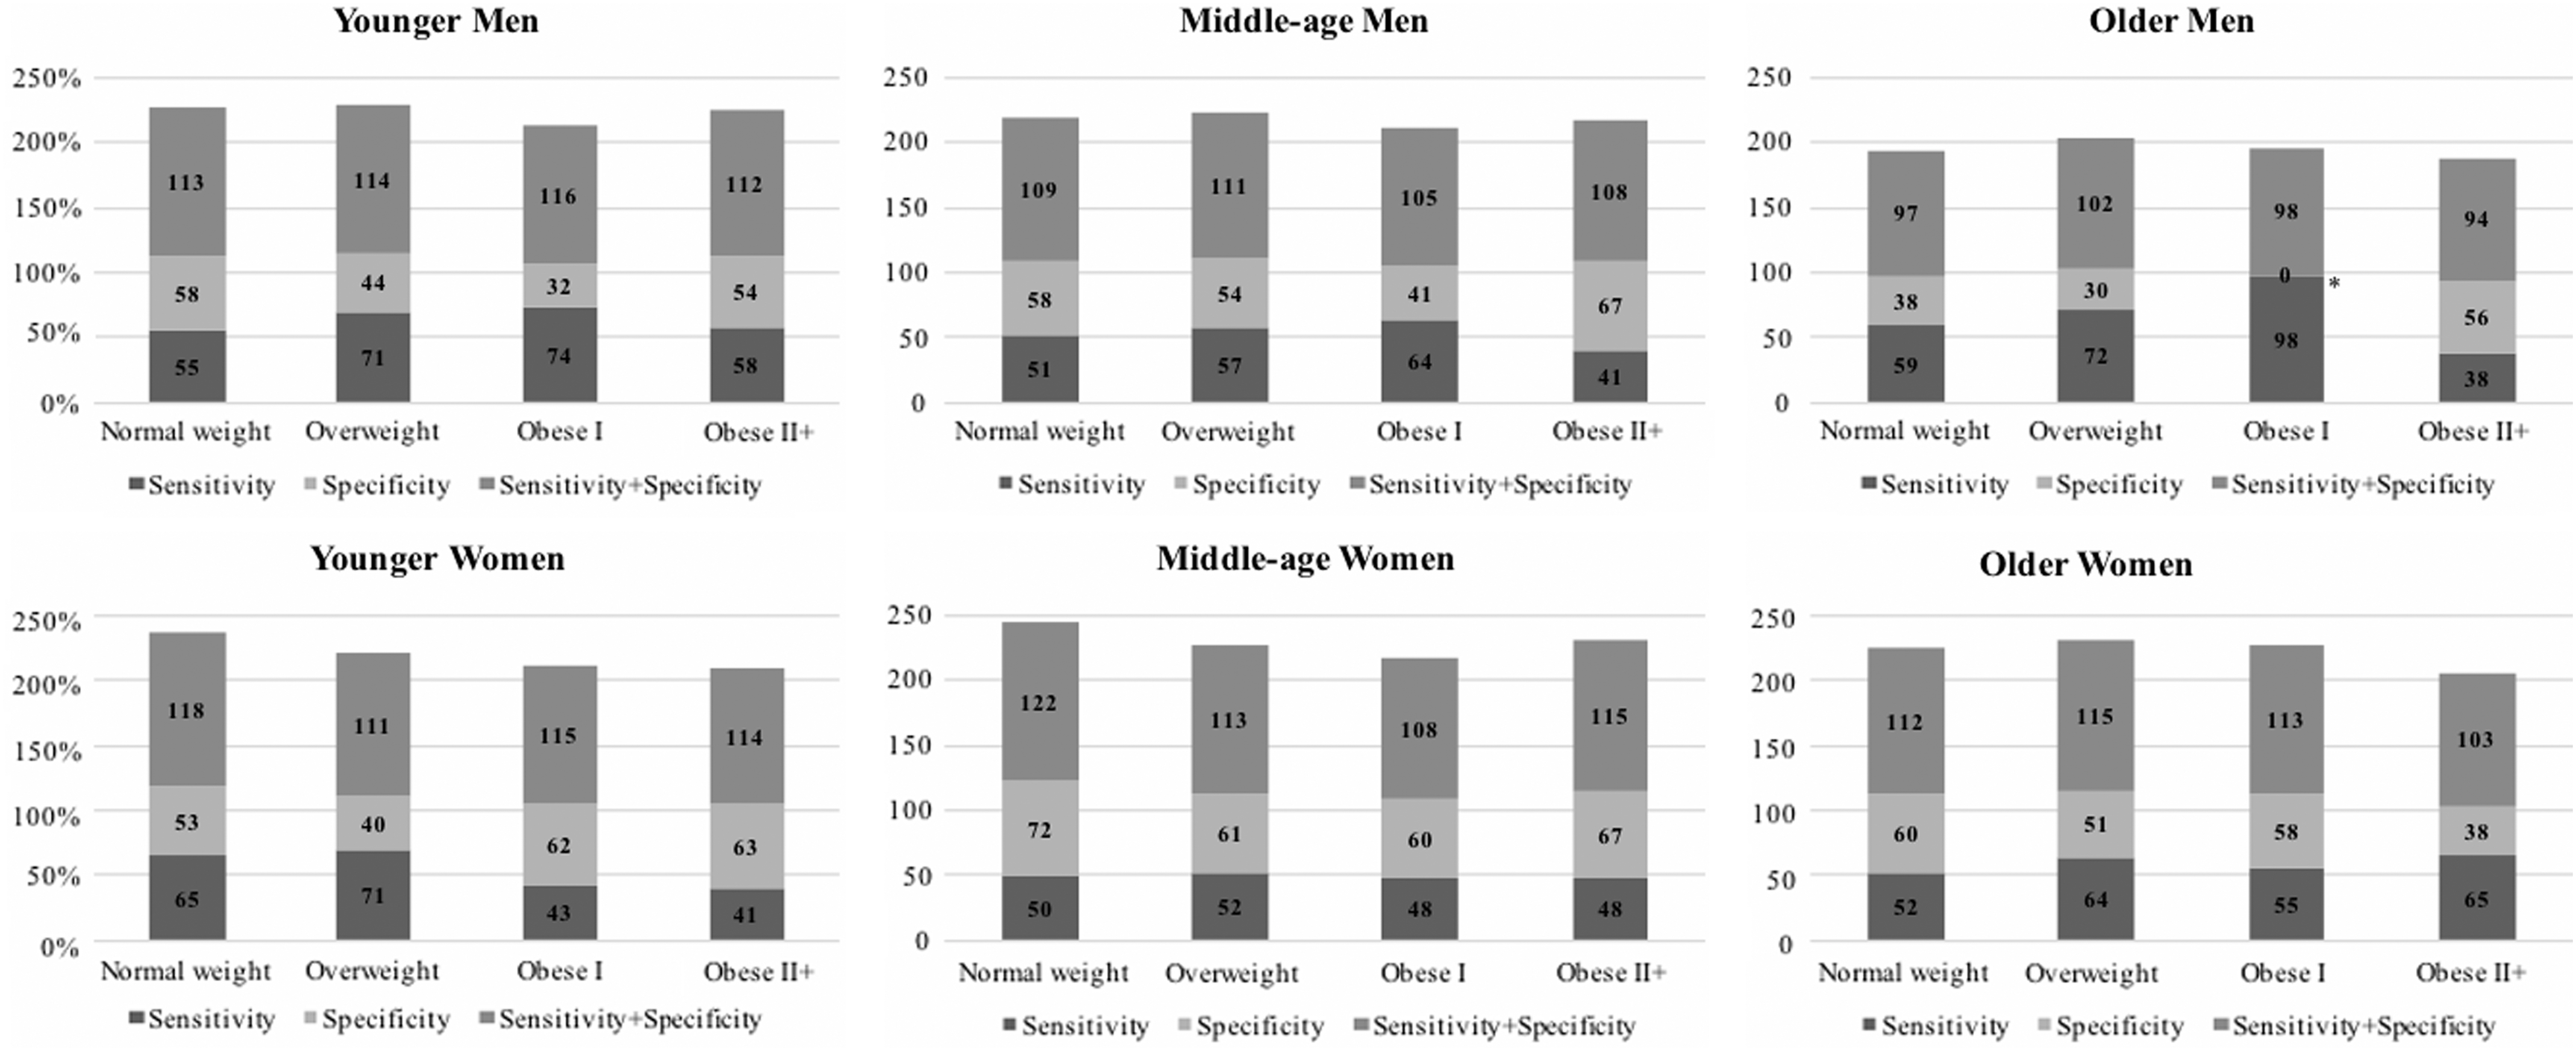
ROC curve results of optimal AGE+BMI-WC thresholds are presented in Fig. 1. Overall, the sum of sensitivity and specificity ranged between 105 and 122 in men groups and between 109 and 121 for women groups.

Optimal AGE+BMI-WC thresholds that identify men and women having two or more components of MetS (NHANES 2007–2014). Sensitivity, probability of correctly identifying individuals having ≥2 components of MetS; Specificity, probability of correctly identifying individuals having no ≥2 components of MetS; Sensitivity+Specificity, sum of sensitivity and specificity. Younger (20 to 49 years); Middle age (50 to 64 years); and Older (65 to 80 years). Normal weight (18.5 to 24.9 kg/m2); Overweight (25.0 to 29.9 kg/m2); Obese grade I (30.0 to 34.9 kg/m2); and Obese grade II+ (≥35.0 kg/m2). AUC, area under curve; BMI, body mass index; MetS, metabolic syndrome; WC, waist circumference.
Overall, the results from the cross-validation step showed that for men, the sum of sensitivity and specificity decreases with aging and from normal weight to grade II+ obesity. In women, a higher sum of sensibility and specificity was observed in middle age subgroup compared to younger and older women for each BMI category (Fig. 2). Finally, for each age and BMI subgroups, AGE+BMI-WC thresholds for women were better to identify those with ≥2 components of the MetS than in men.
Cross-validation study to assess the ability of AGE+BMI-WC thresholds to correctly identify individuals having or not two or more components of MetS from NHANES 1999–2006. Sensitivity: probability of correctly identifying individuals having ≥2 components of MetS; Specificity: probability of correctly identifying individuals having no ≥2 components of MetS; Sensitivity+Specificity: sum of sensitivity and specificity. Younger (20 to 49 years); Middle age (50 to 64 years); and Older (65 to 80 years). Normal weight (18.5 to 24.9 kg/m2); Overweight (25.0 to 29.9 kg/m2); Obese grade I (30.0 to 34.9 kg/m2); and Obese grade II+ (≥35.0 kg/m2). *No individual was under that threshold in the validation cohort.
Figure 3 displays the difference in percentage between AGE+BMI-WC and BMI-WC to correctly determine the proportion of individuals having ≥2 components of the MetS. Our results show that AGE+BMI-WC appears more accurate to identify individuals at high risk of metabolic complications in 11 subgroups (proportion of individuals correctly identified >0%) than BMI-WC thresholds proposed by [18]. For example, in younger men with grade I obesity, the use of AGE+BMI-WC correctly identified 42% more individuals having ≥2 components of the MetS compared to BMI-WC.

Comparison between AGE+BMI-WC thresholds and BMI-WC thresholds proposed by Ardern et al. 21 to correctly identify the proportion (%) of individuals having ≥ components of MetS (NHANES 1999–2014). [Values higher than 0% indicate the proportion of individuals correctly identified using AGE+BMI-WC thresholds compared to those of Ardern et al. 21 ]. Younger (20 to 49 years); Middle age (50 to 64 years); and Older (65 to 80 years). Normal weight (18.5 to 24.9 kg/m2); Overweight (25.0 to 29.9 kg/m2); Obese grade I (30.0 to 34.9 kg/m2); and Obese grade II+ (≥35.0 kg/m2).
Table 4 describes the odds of having ≥2 components of the MetS when WC is above AGE+BMI-WC. Except for middle age men and older men and women with grade II+ obesity where the results are not statistically significant, having WC above the proposed thresholds was associated with higher risk of having ≥2 components of the MetS in both sexes.
MetS, metabolic syndrome.
Discussion
To the best of our knowledge, the present study is the first aimed to develop optimal WC thresholds that are specific to gender and age for different BMI categories that may help correctly identify individuals at higher risk of metabolic complications. Our results first showed that WC thresholds may be different according to age subgroups for a given BMI category, with smaller WC thresholds for younger men and women compared to middle-aged and older individuals. Our results confirm the previous findings which reported that WC is age dependent and should be adjusted for age 13 –15,29,30 since age influences the association between MetS and WC. 31 This is in agreement with our results showing that WC increased significantly from normal weight to grade II+ obesity and from younger to older age category (P ≤ 0.001).
Based on our results, AGE+BMI-WC thresholds for high risk individuals we found differ considerably from the well-accepted crude WC thresholds of 102 cm in men and 88 cm in women. 25 Indeed, depending on BMI and age, the use of crude WC thresholds could under- or overestimate the proportion of individuals displaying metabolic complications. For example, overall and independently of WC, 10% of younger men with normal weight had ≥2 components of the MetS in our cohort. Then, only 0.6% of them had ≥2 components of the MetS when using 102 cm, while we correctly identified 51% of men having the condition when we used the AGE+BMI-WC specific to this subgroup (≥83 cm; data not shown). Similar results were observed for all other subgroups in both sexes. Overall, the AGE+BMI-WC were more sensitive to correctly identify individuals at risk of metabolic complications than using 102 cm in men and 88 cm in women. 25
Clinically, our results are of great interest. For example, when using 102 and 88 cm WC thresholds to identify individuals having high risk of metabolic complications, particularly in younger, middle age, and older men and women with normal weight, the risk of false negatives is high. A large proportion of these individuals would thus be falsely classified as having no metabolic complications and, hence, not taken in charge, although at high risk. Therefore, our results do not fully support an absence of cardiometabolic risk in normal body weight individuals. However, they are in line with studies reporting obesity associated metabolic disorders in a subgroup of normal weight individuals, 32,33 known as metabolically obese but normal-weight individuals. 32 Overall, our results showed that compared to the accepted thresholds of WC (102 and 88 cm), AGE+BMI-WC perform better to identify individuals who may be left out otherwise and would not benefit from adequate early intervention for metabolic complications.
Another interesting finding of the present study is that AGE+BMI-WC thresholds are different from those proposed by Ardern et al., 21 BMI-WC. For example, in normal weight, overweight, and grade I obese younger men, AGE+BMI-WC thresholds were lower than those proposed by Ardern et al. 21 In contrast, in middle-aged and older men with grade II+ obesity, AGE+BMI-WC thresholds found associated with cardiometabolic risk were higher than those in the study by Ardern et al. 21 Overall, differences of ±5 cm were observed between AGE+BMI-WC thresholds compared to BMI-WC. Hence, further analyses showed that the addition of age in conjunction with BMI specific WC thresholds improved the overall sensitivity compared to BMI-WC thresholds proposed by Ardern et al. 21 (Fig. 3). In other words, the use of AGE+BMI-WC thresholds resulted in a more accurate identification of individuals having ≥2 components of the MetS.
In agreement, we showed that the use of AGE+BMI-WC thresholds decreased the number of false-negative cases, an indicator of better performance of a diagnostic test. For example, when using BMI-WC thresholds, 21 75% of normal weight younger men who displayed ≥2 components of the MetS would be misclassified, while 46% would be misclassified with AGE+BMI-WC (data not shown). Taken together, this supports that the use of AGE+BMI-WC thresholds improves the ability to correctly identify individuals at risk of metabolic complications by reducing the proportion of the false-negative cases.
Some limitations of this study should be noted. First, analyses were performed on cross-sectional data, which limit our ability to distinguish cause-and-effect associations. Second, the cross-validation analyses showed that, for some age and BMI subgroups, the sensitivity and specificity improved using AGE+BMI-WC thresholds compared to the crude and BMI-WC thresholds. However, the balance between sensitivity and specificity remains relatively low, although comparable to other studies. 31 Third, AGE+BMI-WC thresholds did not consider the effect of ethnicity. As a matter of fact, a few studies showed that WC is ethnicity dependent and have proposed WC thresholds specific to ethnicity. 21,34 –38 However, given the relatively small number of individuals in each ethnic group in the cohort of individuals used in present study, statistical adjustment was not possible. Despite these limitations, the present study is strengthened by several factors. First, we used a large cohort representative of the US population to determine specific WC thresholds. Second, we also used a different cohort representative of the US population (NHANES 1999–2006) for the validation phase. Finally, we used univariate logistic regression models to assess the efficacy of AGE+BMI-WC thresholds to predict the odds of having metabolic complications in a large representative sample of the U.S. population (NHANES 1999–2014).
Conclusion
The present study is the first aimed to optimize BMI-specific WC thresholds taking into account the effect of age in the context of MetS. Our results showed that BMI specific WC thresholds differ within age categories, suggesting the importance of taking into account not only sex and BMI but also age to identify more accurately individuals having metabolic complications. Other studies are needed to confirm our results.
Footnotes
Author Disclosure Statement
No conflicting financial interests exist.