
Abstract
Background:
Diabetic retinopathy (DR) is mainly caused by metabolic factors, vascular inflammation, and endothelial dysfunction. We aimed to evaluate the relationship of DR with inflammatory and biochemical alterations in type 2 diabetics.
Methods:
A total of 89 diabetic patients with retinopathy [(DR (+) (n = 30)], without retinopathy [(DR (−) (n = 32)], and 27 control subjects were involved in the study. Demographic properties, biochemical values, ophtalmologic evaluation, C-reactive protein (CRP), and pentraxin-3 (PTX-3) levels were recorded.
Results:
There was significant difference between controls, DR (−) and DR (+) groups with regard to serum PTX-3 levels. Control group had the lowest and DR (+) group revealed the highest PTX-3 levels. Severity of retinopathy was not related with CRP or PTX-3 levels. Duration of diabetes was longer, systolic blood pressure (SBP) and urinary albumin-creatinine ratio (UACR) were significantly higher in DR (+) subjects than DR (−) subjects. Multivariate analysis revealed that PTX-3 level and SBP were the variables that had a significant effect on DR (P = 0.002, OR = 1.61, and P = 0.021, OR = 1.06, respectively).
Conclusions:
Plasma PTX-3 levels may be a valuable predictor of DR-like factors such as duration of diabetes, hypertension, and UACR. Although inflammation has an important role in DR, we think that biomarkers reflecting inflammation is not sufficient to predict development and progression of DR; but follow up with PTX-3 levels along with ophthalmological evaluation may be useful. A single determination may not reflect the variations over time, so repeat measures may provide knowledge if PTX-3 is just a biomarker or has a causal role.
Introduction
T
Chronic hyperglycemia triggers metabolic and vascular changes along with increased oxidative stress, inflammatory, and vasoactive substances and result in neuronal damage due to retinal ischemia. 2 Hyperglycemia causes nonenzymatic glycation of proteins and lipids and creation of AGEs, which lead to tissue damage and accelerate complications by increasing inflammation and vascular permeability. Increased vascular permeability, hemostatic abnormalities, ED, tissue ischemia, and neovascularization are hallmarks of DR pathophysiology. 4 Endothelium modulates the vascular tone via vasoconstrictor and relaxing factors. ED, as determined by high Endothelin-1 levels, is correlated with diabetic vascular complications through inflammatory and hemorheological alterations along with biochemical mechanisms. 7 –9 Hyperglycemia induces oxidative stress, leads to overexpression of VEGF, which increases vascular permeability, activates protein kinase isoforms, and promotes angiogenesis and causes damage to blood-retina barrier. 10 –12 Tissue hypoxia, proinflammatory mediators and growth factors upregulates VEGF expression, which is associated with the presence and severity of DR. 11 The main systemic factors involved in DR are hyperglycemia, hypertension (HT), hyperlipidemia, and genetic factors. Inflammation and neuronal dysfunction have been identified as contributing factors. 13 Inflammatory mediators such as interleukins, tumor necrosis factor α, adhesion molecules, C-reactive protein (CRP), and pentraxin-3 (PTX-3) etc. are involved in these inflammatory processes. 1,2
Pentraxins are divided into two groups: short pentraxins, CRP and serum amyloid P, are produced in the liver in response to interleukin-6 (IL-6); but long pentraxin group (PTX-3) is produced by a variety of tissues and cells in response to an inflammatory stimulus. So PTX-3 levels may be the true indicator of inflammation. 14 PTX-3 may modulate inflammation-induced tissue damage and possesses regulatory functions on angiogenesis, atherosclerosis, and tissue repair. 15 –17
The aim of this study is to investigate PTX-3, as an inflammatory biomarker, in type-2 diabetic patients with and without DR and in normal subjects, to search for the relationship with demographic and metabolic variables and to compare them. We also wanted to see if there is an association with PTX-3 levels and severity of retinopathy.
Methods
The study was approved by the Istanbul Training and Research Hospital Ethics Committee and was conducted in accordance with the Declaration of Helsinki. All patients gave informed consent.
Subjects
A total of 89 patients, with DR (n = 30), without DR (n = 32), and control subjects (n = 27) between the ages of 32 and 82 years were included in the study. DM was diagnosed according to the American Diabetes Association (ADA) criteria or using oral antidiabetics and/or insulin. Pregnant women, patients with chronic cardiovascular, renal, hepatic, rheumatic, malign or endocrine diseases, smokers, and subjects who were taking drugs that could affect our results were excluded. Subjects with ocular disease other than DR were also excluded. Control group consisted of 27 healthy people from our hospital staff. They did not have diabetes or glucose intolerance, confirmed with oral glucose tolerance test. The control subjects had no hepatic, renal, infectious, malign, or cardiovascular disease. All subjects were Turkish descent. The weight and height of each person were measured and body mass index (BMI) was calculated according to the formula: Weight/height (m2). Waist circumference (WC) was measured with a flexible tape measure at the level of navel. HT was defined as systolic blood pressure (SBP) >140 mmHg, diastolic blood pressure (DBP) >90 mmHg or current use of antihypertensive medications. 18 Presence of HT, nephropathy, retinopathy (RP), neuropathy (NP), and history about coronary heart disease (CHD), cerebrovascular event (CVE), and diabetic foot (DF) were reported.
Ophthalmological evaluation
All patients underwent a complete ophthalmic examination, including assessment of best corrected visual acuity (BCVA; measured with Snellen chart), biomicroscopic evaluation, intraocular pressure measurement with Goldmann applanation tonometry, and biomicroscopic funduscopy with 90D lens. Optical coherence tomography (OCT) and fundus fluorescein angiography (FFA) were performed on all patients after examination.
FFA images were recorded with a digital fundus camera system (Zeiss Visucam 500). After pharmacologic pupil dilation with tropicamide 1% drops, 5 mL of 10% fluorescein dye (fluorescein 10%; Novartis Pharma, Bern, Switzerland) was injected intravenously and FFA was performed. The severity of retinopathy (mild, moderate, severe nonproliferative, and proliferative) was determined according to FFA and funduscopy based on Early Treatment Diabetic Retinopathy Study Cassification. 19,20 Macular OCT images were obtained using Optovue (ARTRueVersion V 5.1; Optovue, Inc. Fremont, CA).
Laboratory analysis
Sample collection and preparation
The last insulin dose was administered at previous night, and blood samples were obtained before drug use in the morning. Samples were collected in EDTA-containing tubes and anticoagulant-free tubes after an overnight fast. After immediate centrifugation at 3000 g for 10 min, at 4°C, plasma and serum samples were separated in Eppendorf tubes and were frozen immediately at −80°C until analysis.
Measurement of plasma PTX-3 levels
Plasma PTX-3 levels were measured by a commercially available competitive enzyme-linked immunoassay kit (Catalog #: HK347; Hycult Biotech, The Netherlands). The coefficients of intra- and interassay variation were 4.5% (n = 20) and 5.7% (n = 20), respectively.
Routine biochemical parameters were measured by autoanalyzer, CRP was carried out by nephelometric means, and insulin concentrations were determined by chemiluminescence immunoassay (Beckman Coulter). Urinary albumin–creatinine ratio (UACR) was determined by immunoturbidimetric method (Beckman Coulter) in spot urine sample; microalbumin/creatinine: 30–300 mg/g. C-peptide levels were measured by chemiluminesence method (Siemens Advia Centaur XP, Siemens Healthcare Diagnostics). Homeostatic model assessment-insulin resistance (HOMA-IR) was not calculated because half of the diabetics were on insulin treatment.
Statistical analyses
Statistical analyses were performed using NCSS (Number Cruncher Statistical System) 2007 Statistical Software Program (Utah). For evaluation of data, we used descriptive statistical methods (mean, standard deviation), One-way analysis of variance for comparison of groups, Tukey test for subgroups'comparisons, and chi-square test for comparison of qualitative variables. For numerical data, Pearson's correlation test was used to see the relationship of variables. Multivariate regression analysis was performed to determine the independent risk factors for DR. To assess the diagnostic accuracy for PTX-3, we performed receiver operating characteristic (ROC) curve analysis using MedCalc Statistical Software version 14.8.1 (MedCalc Software bvba, Ostend, Belgium)
Results
Demographic findings (age, gender, height, weight, BMI, WC) of control subjects, DR (+), and DR (−) groups revealed no significant difference. As shown on the Table 1, duration of diabetes, presence of HT, CHD, DR nephropathy, and NP were different between groups. Treatment with regard to oral antidiabetic or insulin use was similar in both diabetic groups. DR (+) group had higher SBP and DBP; and this group had diabetes for longer period of time. DR (−) group had higher SBP compared with controls. History of DF and CVE was not different between groups.
The statistically relevant results are highlighted in bold.
CHD, coronary heart disease; CVE, cerebrovascular event; DBP, diastolic blood pressure; DF, diabetic foot; HT, hypertension; NP, neuropathy; OAD, oral antidiabetic drug; RP, retinopathy; SBP, systolic blood pressure.
Biochemical values of the groups are shown on the Table 2. As expected, fasting blood glucose (FBG), urea, and HbA1c levels were higher and C-peptide levels were lower in diabetics than controls, whereas there was not any difference between DR (−) and DR (+) groups. UACR, urea, and PTX-3 levels revealed similar increase from controls to DR (+) patients.
The statistically relevant results are highlighted in bold.
CRP, C-reactive protein; FBG, fasting blood glucose; HDL-C, high-density lipoproteins; LDL-C, low-density lipoproteins; PTX-3, pentraxin-3; UACR, urinary albumin–creatinine ratio.
Severity of retinopathy did not reveal any association with PTX-3 and CRP levels (Table 3).
NPDR, nonproliferative diabetic retinopathy; PDR, proliferative diabetic retinopathy.
Comparison of the groups according to the SBP, DBP, and metabolic variables are shown on the Table 4.
The statistically relevant results are highlighted in bold.
CG, control group.
PTX-3 level of the groups showed no correlation with age, SBP, DBP, BMI, WC, HC, FBG, HbA1c, insulin, C-peptide levels, and UACR (Table 5). The only relationship was between SBP and PTX-3 level in DR (−) group (r = −0.419, P = 0.015).
Statistically significants results are highlighted in bold.
BMI, body mass index; WC, waist circumference.
The results of logistic regression analysis for demographic factors, biochemical analysis, and PTX-3 levels are presented on the Table 6. As shown on the Table, significant and independent risk factors were HT and PTX-3 levels.
Independent risk factors are highlighted in bold.
A comparison of the ROC curves, cutoff levels of PTX-3, sensitivity, specificity, PPV, NPV, LR and AUC in control, DR (−), and DR (+) groups are shown on the Table 7, and ROC curves are shown on the Figures 1 –3.
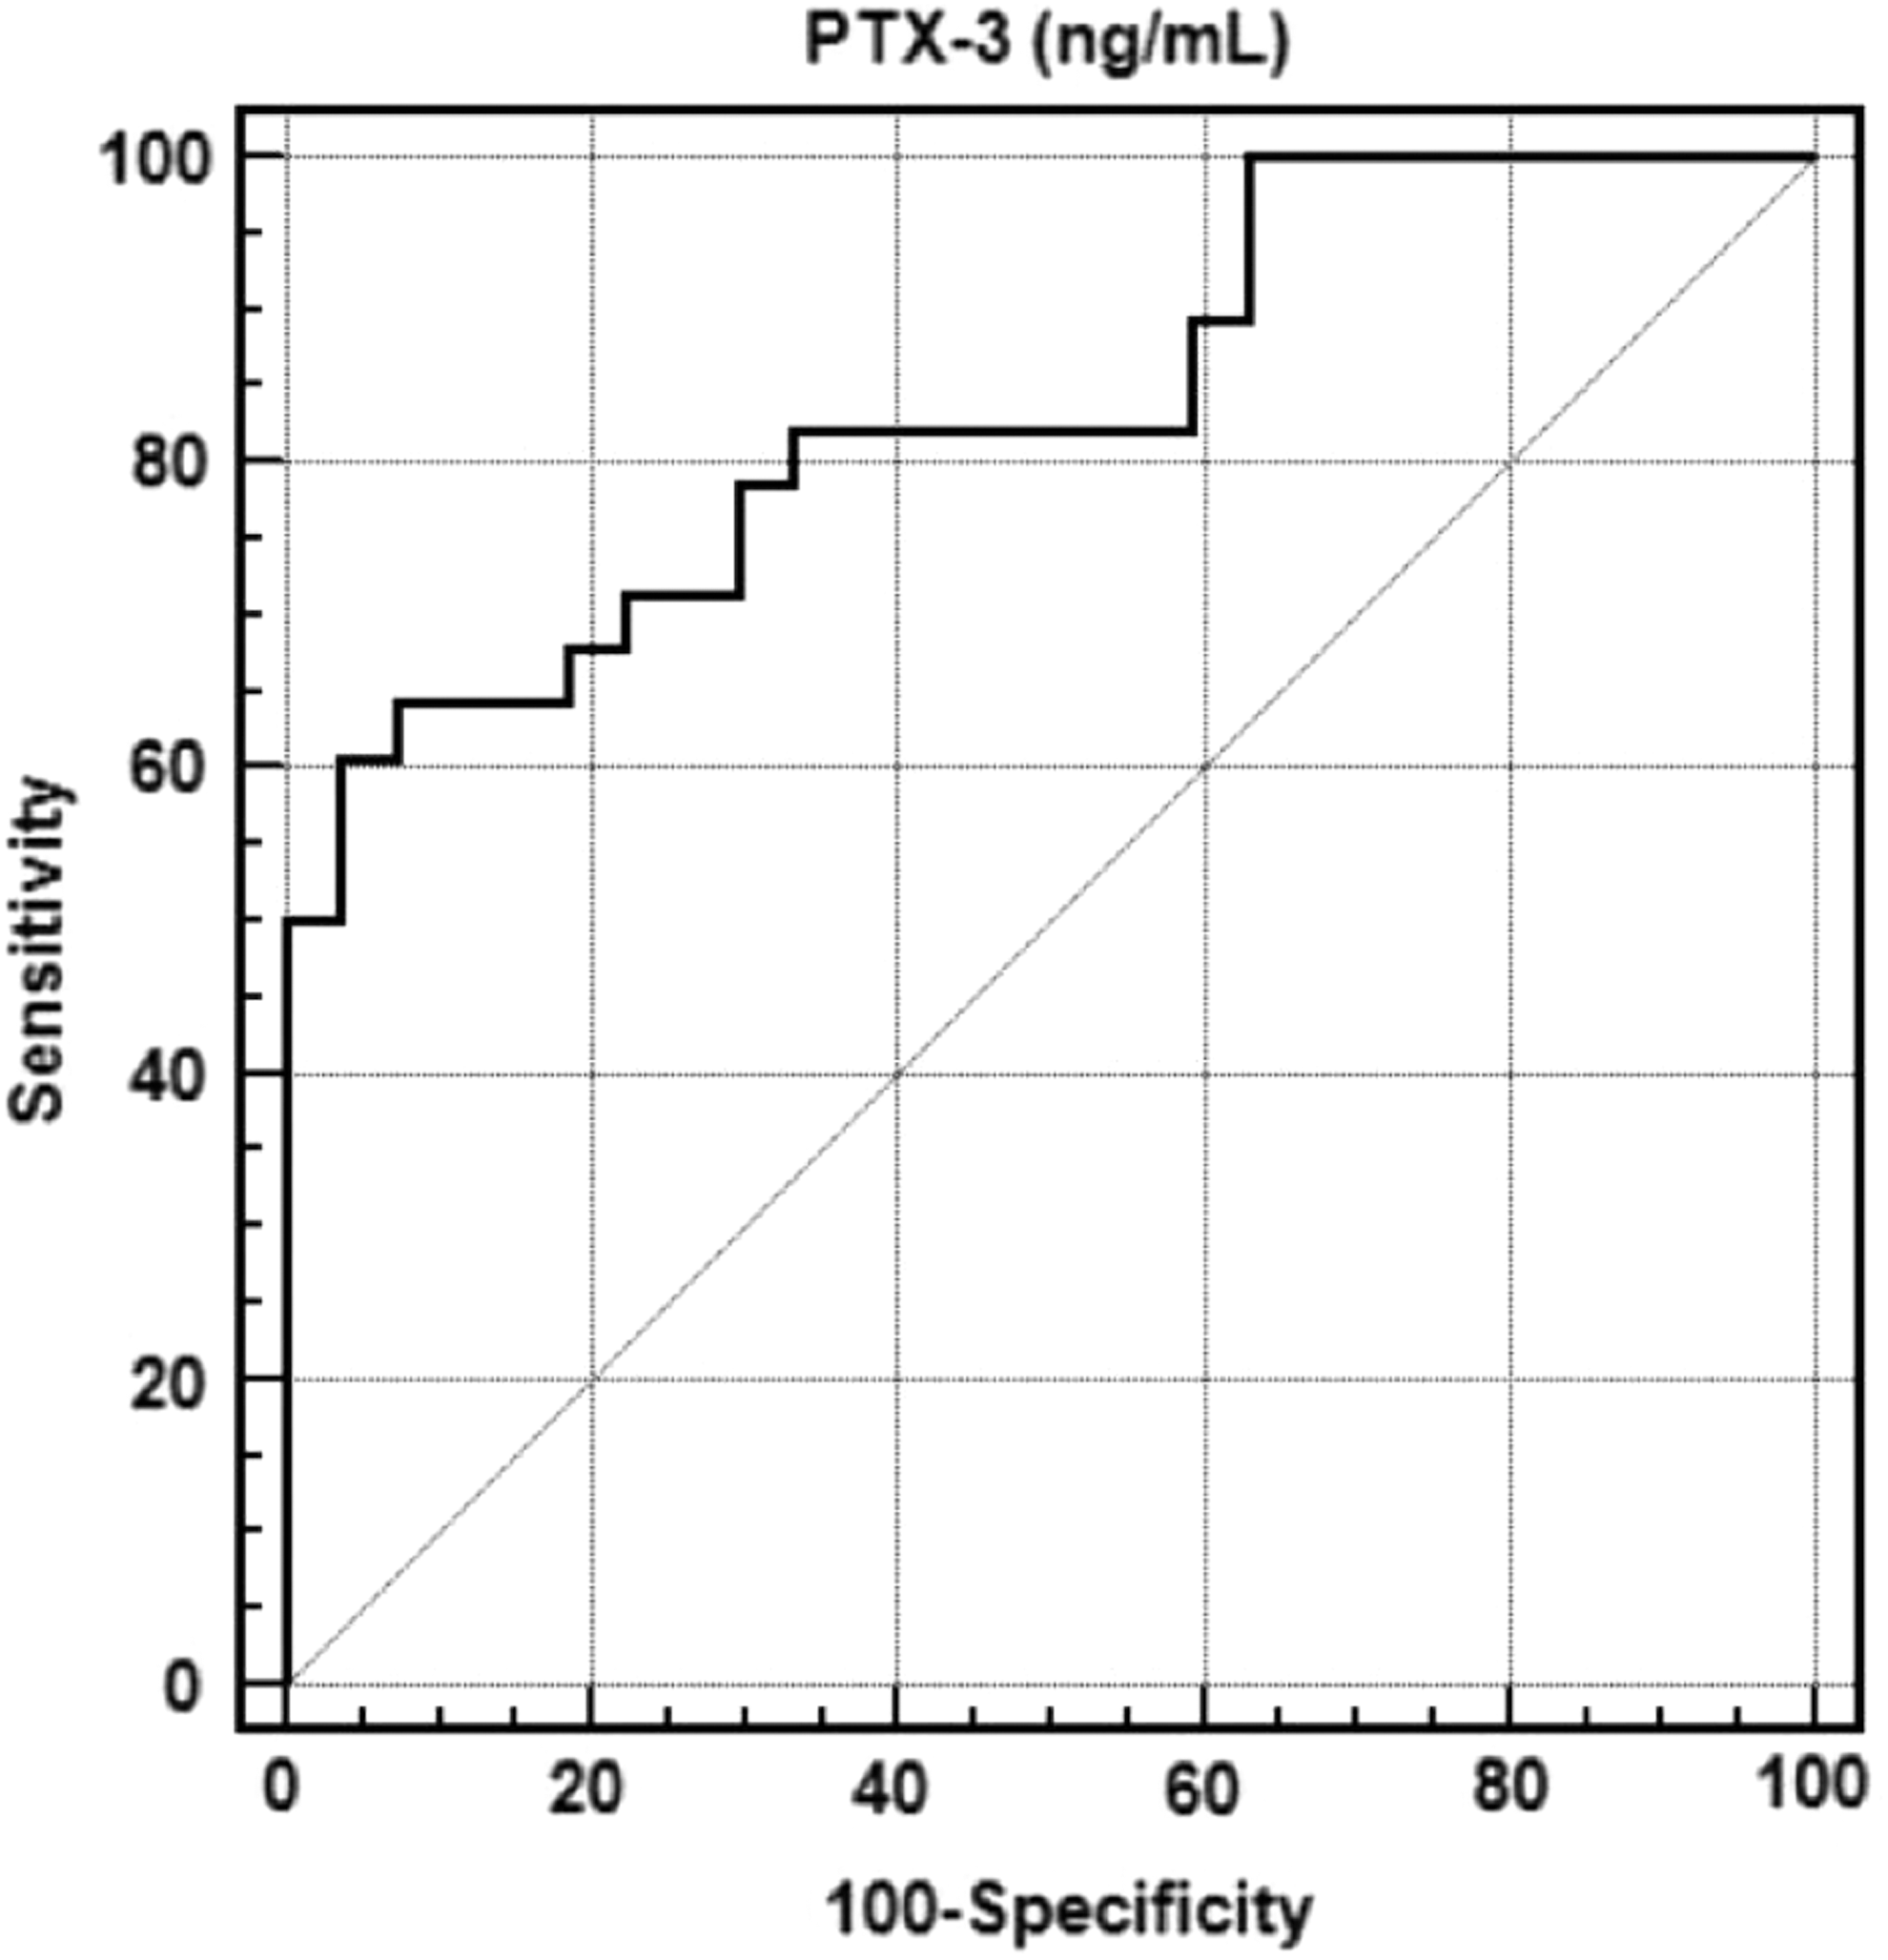
Prediction capacity of PTX-3 for discriminating control and DR (+) groups. Likelihood of having diabetic retinopathy was 16.39 times more in a patient who had PTX-3 level ≥5.03 ng/mL, compared with a control subject having PTX-3 level <5.03 ng/mL. DR, diabetic retinopathy; PTX-3, pentraxin-3.

Prediction capacity of PTX-3 for discriminating control and DR (−) groups. Likelihood of not having DR was 2.64 times more in a patient who had PTX-3 level ≥3.96 ng/mL, compared with a control subject having PTX-3 level <3.96 ng/mL.

The prediction capacity of PTX-3 to discriminate DR (+) and DR (−) groups. Likelihood of having retinopathy was 1.94 times more in a diabetic patient who had PTX-3 level ≥7.572 ng/mL, compared with a diabetic patient having PTX-3 level <7.572 ng/mL.
AUC, area under curve; LR, likelihood-ratio; NPV, negative predictive value; PPV, positive predictive value.
Likelihood of having diabetes (without retinopathy) was 2.64 times more in a patient who had PTX-3 level ≥3.96 ng/mL, compared with a patient with PTX-3 level <3.96 ng/mL. The likelihood of having retinopathy was 16.39 times more in a patient who had PTX-3 level ≥5.03 ng/mL, compared with a patient having PTX-3 level <5.03 ng/mL. Among diabetic patients, prediction capacity of PTX-3 for DR was 2.56 times more in a patient who had PTX-3 level ≥7.572 ng/mL, compared with a patient who had PTX-3 level <7.752 ng/mL.
Discussion
The major findings of the present study are as follows: there was significant difference between controls, DR (−), and DR (+) diabetic groups with regard to serum PTX-3 levels. Control group had the lowest values, whereas DR (+) group revealed the highest values. Duration of diabetes was longer, and SBP and UACR were higher in DR (+) group than DR (−) group. The presence and severity of retinopathy was not related with CRP or PTX-3 levels. In none of the groups PTX-3 values showed correlation with age, gender, BMI, WC, DBP, FBG, HbA1c, UACR, insulin, and C-peptide. Only in DR (−) group, PTX-3 was negatively correlated with SBP.
The main outcome of this study, in line with some others is that, duration of diabetes, poor glycemic control, UACR, and dyslipidemia are related to DR. 7,10,21,22
There are conflicting results about the relationship of PTX-3 levels with lipid levels and obesity. 15,16,23 We did not find an association between PTX-3 values and laboratory and clinical markers of arteriosclerosis such as lipid levels and presence of CHD. Similarities of BMI in all groups may be due to the high BMI in control subjects. With regard to nondifferent lipid levels; it may be explained by restricted diets and lipid lowering drugs in diabetics.
Mean CRP values between our groups were not different although inflammatory markers are reported to be increased in DR and in diabetic nephropathy. 2,5,24 –28 The discrepancy may be explained by racial and methodological differences. There are numerous inflammatory biomarkers in DR. 29 –32 There was not a correlation of CRP with presence and severity of retinopathy in our research. We suggest that local inflammation of DR may not always cause increased plasma CRP levels. The small number of this study may also be another explanation.
PTX-3 is produced in response to ischemic and proinflammatory signals and may more directly reflect the vascular inflammation. 15 –17 Higher plasma levels of PTX-3 in DR (+) patients than both DR (−) and control subjects imply that DR is related to systemic inflammation, which increases the release of inflammatory mediators in the retina. Besides, progressive retinal injury impairs the blood–retina barrier and leads to accumulation of inflammatory and angiogenic cells and mediators in the vitrous cavity. 10,11 DM is characterized with low-grade systemic inflammation, which may exacerbate local inflammation in the eye as determined by high PTX-3 levels. Another possibility is that the local high-grade inflammation with increased PTX-3 levels might help determining DR in the advanced stages of DM.
Treatment with DPP4 inhibitors, along with glycemic profile, improves endothelial function. 8 Some of our patients were on DPP-4 treatment; but we did not evaluate patient subgroups according to treatment to not to make the groups smaller. Given DR is a consequence of ED, this field also needs to be investigated in DR patients. But we could not evaluate markers of vascular damage in our research for financial reasons.
There was no relationship between CRP or PTX-3 levels and the presence of NP and CHD in both diabetic groups. In contrast to Salcini et al. 33 who showed that diabetic patients with polyneuropathy had higher plasma PTX-3 levels compared with controls, we did not find a difference. We can explain this with small number of our groups and the limited investigation. We did not perform electromyography, but we evaluated our patients based on complaints and neurologic examination. In accordance with our study, Baragetti et al. 34 showed that PTX-3 levels were neither a predictor of subclinical atherosclerosis nor an incident of cardiovascular events. The discrepancy of these results may result from differences in the site and extent of inflammation, cytokines, or other confounding factors and variations related to time. Our subjects were examined by cardiologist and were diagnosed through ECG and noninvasive methods; so we may have under diagnosed CHD.
We did not find any relationship between severity of retinopathy and PTX-3 or CRP, uric acid, and fibrinogen levels in consistent with some studies. 7,35 But many authors found different results. 2,26,27,31,35 PTX-3 level may be related to the presence of DR rather than its severity, such as AGE levels. 2 In line with our research, Zhou and Hu 36 found that both serum and vitreous PTX-3 concentrations were higher in type 2 diabetic patients than subjects without diabetes and controls. Higher inflammatory mediators in vitreous than plasma due to the retinal–blood barrier may be suggested as evidence of local over systemic inflammation in proliferative DR. 21,26 We measured the biomarkers in serum, not in vitreous, which could better reflect the local inflammation. Systemic inflammation induced local inflammatory mediators, and progressive vascular changes, including vascular leakage and angiogenesis due to vasoactive substances and growth factors, take place in different stages of DR. We think that high PTX-3 levels in both diabetic groups are linked to diabetes itself. But in RP (+) patients, the higher levels may be considered as the reflection of local inflammation. We suggest that PTX-3 levels begin to increase first, locally and systemically, without an association with CRP in diabetes and DR. As our study is cross-sectional, we cannot speculate a casual relationship.
We found a correlation between DR and UACR, without relationship with HbA1c levels. Spijkerman et al. 37 showed that retinopathy was associated with HbA1c and urinary albumin excretion (UAE). Inflammation, ED, and microalbuminuria are interrelated in chronic kidney disease. 17,38 –41 In our research, RP (+) patients had higher levels of UACR and urea levels than RP (−) and control subjects. Moon et al. 42 demonstrated that a mild increase in UAE is independently associated with an increased risk of DR and suggested that there is a synergistic effect between a prolonged increased glycemic exposure and mildly increased UACR on the development of DR. Given the association of RP and nephropathy, probably common pathogenic factors may be responsible in the development of both complications. As in the case of DR, the major risk factors for development of diabetic nephropathy are prolonged duration of diabetes, HT, and poor glycemic control. In diabetic nephropathy, chronic hyperglycemia alters the expression of growth factors and cytokines in glomerular cells. Various inflammatory and angiogenesis molecules affect the pathogenesis and progression of diabetic nephropathy. Inflammation damages the microcirculation and causes kidney damage. 43 We may accept PTX-3 levels as predictor of nephropathy in type 2 DM, so PTX-3 levels should be monitored for the early detection of diabetic nephropathy along with UACR.
Conclusion
Although inflammation has an important pathophysiologic role in DR, there are many alterations in vascular network beyond inflammation, including vascular and neuronal damage, due to complex interrelated pathways. For this reason use of the biomarkers reflecting inflammation is not sufficient to predict development and progression of DR. Plasma PTX-3 levels may be a valuable predictor of DR-like well-known factors such as duration of diabetes, HT, and UACR. We suggest that diabetic patients should be followed up with PTX-3 levels, as a noninvasive marker, along with ophthalmological evaluation. A single determination may not reflect the variations over time, so repeat measures are needed to confirm if PTX-3 is just a biomarker or has a causal role in this process. Diabetes-induced microvascular disease seems to be associated with inflammation, hence, future therapeutic investigations should focus on inflammation along with antiangiogenetic therapies. We recommend for researchers to perform prospective studies in larger groups evaluating inflammatory, oxidative, hemostatic, metabolic, and endothelial cell function markers and comorbid conditions over time.
Footnotes
Author Disclosure Statement
No competing financial interests exist.