




Abstract
Background:
Fasting hyperglucagonemia can be detrimental to glucose metabolism in patients with type 2 diabetes (T2D) and may contribute to metabolic disturbances in obese and/or prediabetic subjects. However, the mechanisms underlying fasting hyperglucagonemia remain elusive.
Methods:
We evaluated the interrelationship between fasting hyperglucagonemia and demographic and biochemical parameters in 106 patients with T2D (31% female, age: 57 ± 9 years [mean ± standard deviation; body mass index (BMI): 30.1 ± 4.4 kg/m2; fasting plasma glucose (FPG): 9.61 ± 2.39 mM; hemoglobin A1c (HbA1c): 57.1 ± 13.1 mmol/mol] and 163 nondiabetic control subjects (29% female; age: 45 ± 17 years; BMI: 25.8 ± 4.1 kg/m2; FPG: 5.2 ± 0.4 mM; and HbA1c: 35.4 ± 3.8 mmol/mol). Multiple linear regression analysis was applied using a stepwise approach with fasting plasma glucagon as dependent parameter and BMI, waist-to-hip ratio (WHR), blood pressure, hemoglobin A1c, FPG, and insulin concentrations as independent parameters.
Results:
Fasting plasma glucagon concentrations were significantly higher among patients with T2D (13.5 ± 6.3 vs. 8.5 ± 3.8 mM, P < 0.001) together with HbA1c (P < 0.001), FPG (P < 0.001), and insulin (84.9 ± 56.4 vs. 57.7 ± 35.3 mM, P < 0.001). When adjusted for T2D, HbA1c and insulin were significantly positive determinants for fasting plasma glucagon concentrations. Furthermore, WHR comprised a significant positive determinant.
Conclusions:
We confirm that fasting plasma glucagon concentrations are abnormally high in patients with T2D, and show that fasting plasma glucagon concentrations are influenced by WHR (in addition to glycemic control and fasting plasma insulin concentrations), which may point to visceral fat deposition as an important determinant of increased fasting plasma glucagon concentrations.
Introduction
T
In the majority of patients with T2D, glucagon concentrations are elevated in the fasting state and remains elevated during the first hour of an oral glucose tolerance test or after ingestion of a carbohydrate-rich meal. 6,7 Furthermore, postprandial glucagon concentrations are higher than normal after a mixed meal intake. 9 The inappropriately high glucagon concentrations result in increased hepatic glucose output and, thereby, contribute to the fasting and postprandial hyperglycemia characterizing patients with T2D. 10 Over the years, hyperglucagonemia has increasingly been recognized as a therapeutic target in patients with T2D 11,12 and the important role of hyperglucagonemia in the pathophysiology of T2D has been confirmed in several studies, most clearly in recent studies employing glucagon receptor antagonists. 13 However, the mechanisms behind diabetic hyperglucagonemia remain poorly understood.
In this study we evaluated which phenotypical characteristics (including a range of demographic and biochemical measures) might determine the occurrence and degree of fasting hyperglucagonemia in patients with T2D and nondiabetic subjects and show that waist-to-hip ratio (WHR), a strong predictor of nonalcoholic fatty liver disease (NAFLD), represents a determinant of fasting hyperglucagonemia in patients with T2D and nondiabetic subjects.
Methods
Design and data sampling
We pooled available demographic and biochemical potential predictors of fasting hyperglucagonemia in patients with T2D and nondiabetic controls using data from previous clinical studies performed at Gentofte Hospital, University of Copenhagen, Denmark, from 2003 to 2016. 9,14 –37 All subjects had undergone an initial screening visit and fulfilled prespecified inclusion criteria for T2D or normal glucose tolerance, respectively, before study inclusion. 38 If a study subject had participated in more than one study, we only used data from the first study that this individual had participated in. Data from each study subject were collected in the same way; that is, all baseline values were measured before any kind of intervention and blood samples were obtained after an overnight fast of minimum 10 hr. None of the included patients with T2D received any other oral antidiabetic therapy than metformin and/or sulfonylurea. Patients had paused their oral antidiabetic therapy for a period of no less than a week before study participation, except patients from one study 14 who paused their sulfonylurea treatment 3 days before blood sampling. Blood samples for the measurement of glucagon were collected in iced EDTA tubes and centrifuged for 20 min at 4°C. Plasma was then transferred to storage tubes on ice and immediately stored at −20°C until analysis. Clinical measurements, such as height, weight, WHR, and blood pressure were carried out according to standard operating procedures.
Analyses
Screening blood samples were analyzed using routine assays in the Department of Clinical Biochemistry, Gentofte Hospital. Plasma glucose was measured bedside either using the glucose oxidase method (YSI 2300 STAT PLUS analyzer; YSI, Yellow Springs, OH) or the HemoCue Glucose 201 RT analyzer (HemoCue, Vedbæk, Denmark). Analysis of plasma glucagon was performed in batches, including samples from all participants in any given study. The glucagon assay used in all studies was the previously described 39 in-house C-terminal radioimmunoassay, which reliably measures intact glucagon as validated by sandwich enzyme-linked immunosorbent assay (ELISA) and mass spectrometry. 39,40
Calculations and statistics
Baseline characteristics are displayed as mean ± SEM or median and interquartile range. Normal distribution was tested performing histograms and baseline characteristics were compared using t-test or Mann–Whitney test as appropriate. In the attempt to determine potential determinants of fasting hyperglucagonemia among our available demographical and biochemical data, we chose a model with the aim to create the best multiple regression model explaining fasting plasma glucagon concentrations, that is, a model where the most important variables could be assessed and adjusted for confounders. We initially conducted quantile–quantile (Q-Q) plots together with Shapiro Wilk's test and performed simple linear regression on all the variables measured. Variables included age, gender, body mass index (BMI), WHR, fasting plasma glucose (FPG), fasting plasma insulin (FPI), glycated hemoglobin A1c (HbA1c), and systolic and diastolic blood pressure. Logarithmic transformations of glucagon and FPI were performed and retained during the remaining statistical work. After fitting all of the simple linear regression models (Fig. 1), we ended up with our final predictor variables, which involved gender, BMI, WHR, FPI, and HbA1c. We then expanded our analyses with multiple regression modeling. BMI was not included because WHR and BMI are too highly correlated with each other (i.e., correcting for colinearity). We used a forward stepwise model approach to fit the best model. Level of significance was set to 0.05. Finally, regression diagnostics were performed using Cooks distance, Q-Q plots, and residual plots (Supplementary Figs. S1–S3; Supplementary Data are available online at
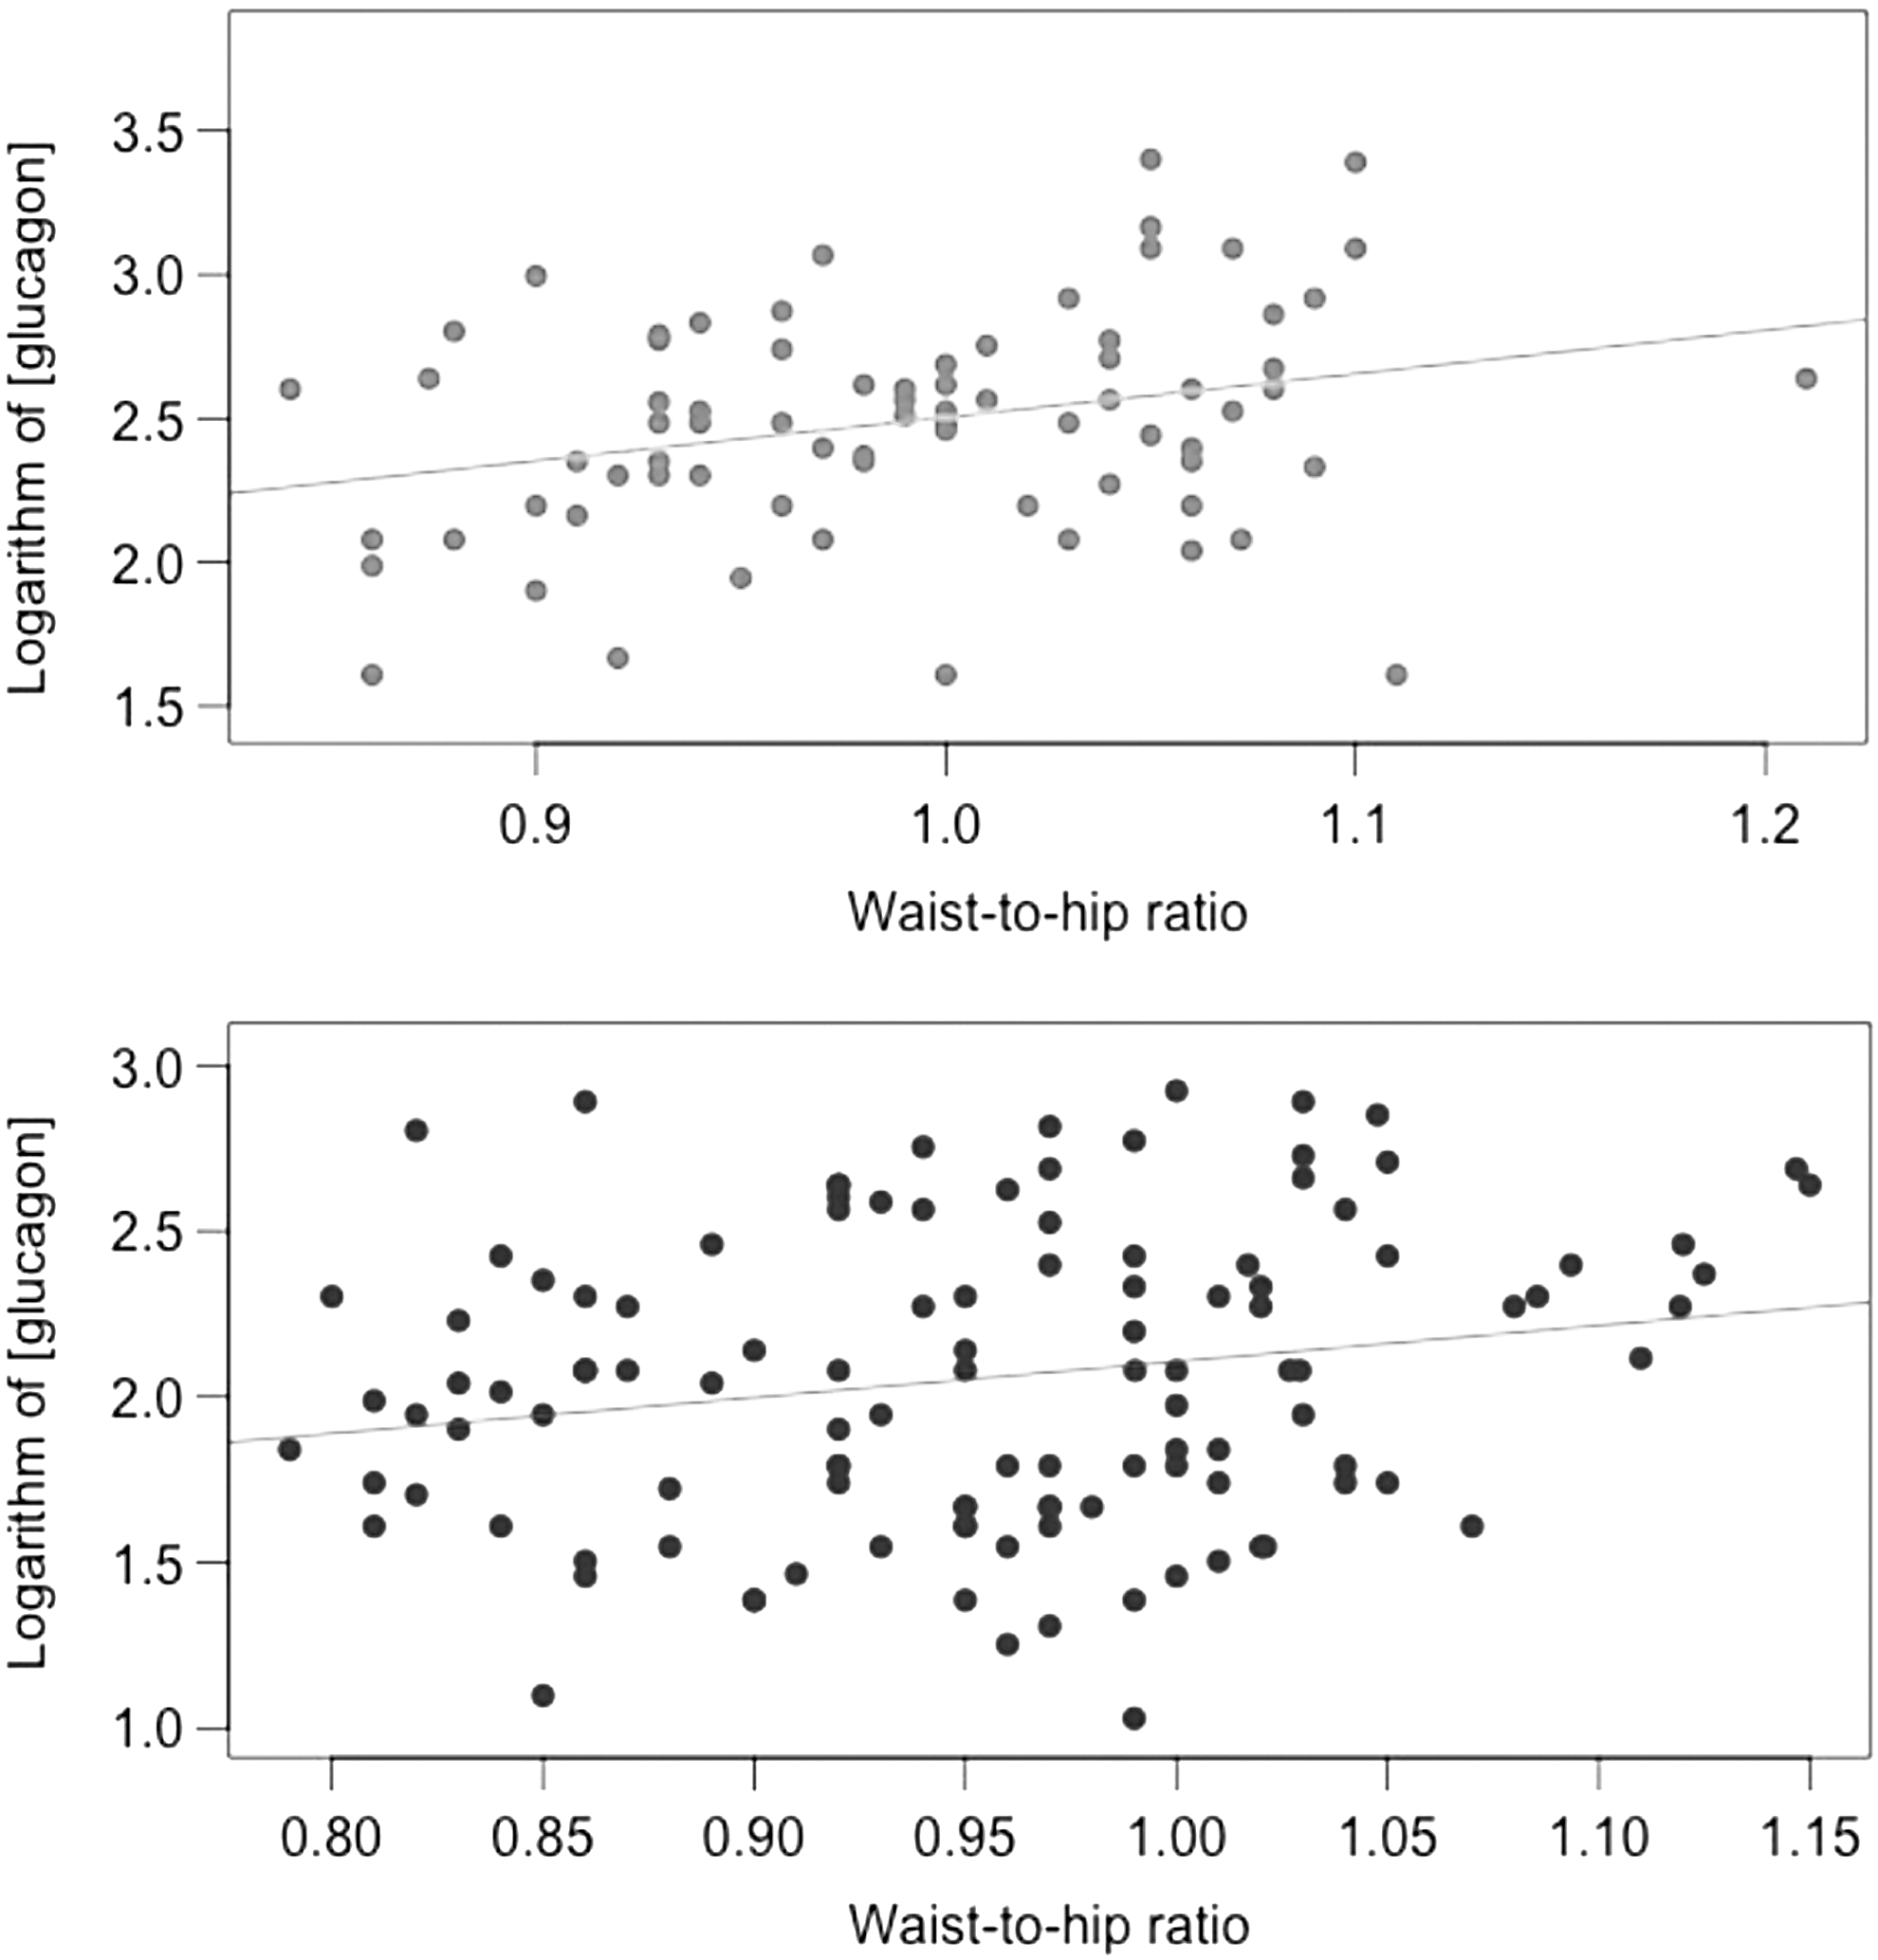
Simple scatter plots from patients with type 2 diabetes (upper panel) and nondiabetic controls (lower panel). The significant explanatory variables (here, waist-to-hip ratio) plotted against the response variable (logarithm of the plasma glucagon concentration).
Results
We included data from 25 different minor grouped intervention studies (including a total of 269 study subjects), in which all participants had measurements of fasting plasma glucagon concentrations. All, except two studies, were designed as paired grouped intervention studies, divided as patients with T2D versus NGT subjects.
Table 1 displays baseline characteristics of our study population divided into groups of patients with T2D and nondiabetic controls, respectively, with no significant difference in gender distribution (Fishers exact test, P = 0.79), and significant differences between the groups in terms of BMI, FPG, and HbA1c.
Subject Characteristics
Data are mean ± standard deviation.
BMI, body mass index; FPG, fasting plasma glucose; FPI, fasting plasma insulin; HbA1c, hemoglobin A1c; T2D, type 2 diabetes; WHR, waist-to-hip ratio.
Simple linear regression models with each of our predictor variables and our response variable being fasting plasma glucagon showed significant positive correlations between WHR and fasting plasma glucagon in both groups (nondiabetic controls: alpha = 1.08, r2 = 0.04, and P = 0.02; patients with T2D: alpha = 1.51, r 2 = 0.08, and P = 0.01), and moreover, the control group showed significant positive correlations between fasting concentrations of glucagon and fasting concentrations of insulin (alpha = 0.17, r2 = 0.12, and P < 0.001). When we performed the same set of analyses on both groups brought together, we found significant positive correlations for all independent variables involved (WHR: alpha = 1.74, r 2 = 0.09, and P < 0.001; insulin: alpha = 0.16, r2 = 0.10, and P < 0.001; HbA1c: alpha = 0.01, r2 = 0.17, and P < 0.001; and BMI: alpha = 0.04, r2 = 0.13, and P < 0.001).
Multivariate linear regression modeling in pooled data from both group's best fit (reported in Table 2) yielded a r2 of 0.32 with an overall significance expressed as an F-test of 29.4 of 3 with P < 0.001. Due to missing data in various variables, 77 observations had to be omitted from the final model. Goodness of fit was tested with performance of a Q-Q plot (Supplementary Fig. S2) and the linearity of the relationship between the predictors and the outcome was checked by looking at the relationship between the fitted values and the residuals themselves (Supplementary Fig. S3). Significant drivers of this model included FPI, HbA1c, and WHR. By contrast, age, and gender systolic and diastolic blood pressure did not contribute to the model. Adjustment for T2D did not change the significant driving variables.
The Best Multiple Linear Regression Model
Report of our final multiple linear regression model.
CI, confidence interval; SE, standard error.
Discussion
In this study, we confirm that fasting plasma glucagon concentrations are abnormally high in T2D and show that fasting plasma glucagon concentrations are influenced by WHR in addition to glycemic control and FPI concentrations, which may point to visceral fat deposition and hepatic steatosis as important determinants of increased fasting plasma glucagon concentrations.
More than 40 years ago, Unger et al. proposed that T2D is a consequence of not only a relative lack of insulin but also an excess of glucagon. 41 Some years later, Reaven et al. showed that hyperglucagonemia is evident throughout the day in both obese and nonobese patients with T2D, and occurs in the presence of significant elevations of both plasma insulin and glucose, 42 both thought to inhibit glucagon secretion under normal circumstances. Thus, patients with T2D often exhibit fasting hyperglucagonemia and they are not able to suppress glucagon efficiently after intake of energy-dense meals. This results in an increased hepatic glucose output contributing to the hyperglycemic state of T2D. 10 Recent data supporting the important role of glucagon in the pathophysiology of T2D stem from T2D mouse models (both genetically and diet-induced) with and without glucagon receptors and, in particular, from several clinical studies employing specific antagonists of the human glucagon receptor, which robustly improve glycemic control in patients with T2D. 13,43 –53
Historically, diabetic hyperglucagonemia has been ascribed to alpha cell resistance to the glucagon-suppressive effects of insulin and glucose. 5 However, more recent studies have showed that while hyperglucagonemia in T2D is aggravated by oral intake of glucose, isoglycemic intravenous glucose infusion results in normal suppression of glucagon concentrations. 17,54 Due to the isoglycemic conditions in these studies and as insulin responses during oral glucose are higher than during isoglycemic intravenous glucose infusion (because of the incretin effect), it seems unlikely that altered effects of glucose and insulin on the diabetic alpha cells represent key determinants of T2D hyperglucagonemia. This suggests that other mechanisms are responsible for the hyperglucagonemia in T2D.
Interestingly, fasting hyperglucagonemia together with increased hepatic glucose production have also been observed in nondiabetic obese subjects, prediabetic individuals, and nondiabetic subjects with NAFLD, 27,55 –57 indicating that patients with T2D per se might not be the underlying cause of hyperglucagonemia. In line with this, we recently showed that patients with T2D without NAFLD exhibited normal plasma glucagon concentrations, whereas patients with T2D and nondiabetic subjects with NAFLD had similarly high fasting plasma glucagon concentrations. 57 Hypothetically, NAFLD might reduce hepatic glucagon sensitivity 8 as suggested by rodent studies. 58 Furthermore, patients suffering from hepatic dysfunctions, such as NAFLD and cirrhosis exhibit hyperglucagonemia without altered glucose tolerance. 59 Lastly, a study in a nondiabetic population showed an association between the degree of obesity (assessed by BMI) and fasting plasma glucagon independently of insulin resistance. 60
Recently, existence has been proposed of a liver-alpha cell axis, where steatosis-induced glucagon resistance of the liver interferes with a feedback mechanism acting on the alpha cells and thereby causes increased glucagon secretion and hyperglucagonemia. 8 How the liver signals to the pancreas and vice versa might be explained by glucagon acting not only as an important glucoregulatory hormone, but also as a crucial regulator of protein and amino acid metabolism. 61,62 While glucagon regulates amino acid concentrations, amino acids control alpha cell mass and function. 62 –65
The present study revealed a positive relation between fasting hyperglucagonemia and increased WHR. The latter is likely to also represent an increased degree of hepatic steatosis. 66,67 Zheng et al. investigated different anthropometric indicators (including WHR) and their effectiveness in the prediction of NAFLD in 490 patients, and WHR was associated with the best diagnostic value confirmed by logistic regression analysis and receiver-operating characteristic curve. 68 This indicates that WHR and central obesity are closely related to the occurrence of NAFLD. The results from the multiple regression model in our study support that it is not T2D per se, which is the main driver of fasting hyperglucagonemia. Thus, when we adjusted the model for T2D and gender, the model still showed a significant positive correlation between the entire study population's fasting plasma concentration of glucagon and WHR. In addition, as expected when adjusting the model for WHR, the positive significant correlation to T2D disappeared. Due to the fact that many of the studies included have a predominance of males, we ended up having only 80 females together with 189 males in our study population. Nevertheless, an increased WHR in both females and males has been shown to correlate well with central obesity. 69,70
Our multiple regression model was able to predict 32% of hyperglucagonemia from WHR, HbA1c, and FPI concentrations. One might argue that a regression model with an r 2 value of 32% is of minor importance, but as all of the involved predictors in our model are statistically significant, each one consistently contributes to the resulting fasting glucagon concentration. The main goal of this study was not to produce precise prediction intervals for each variable, instead, we wanted to identify statistically significant predictors and see how changes in these relate to changes in our response variable (fasting plasma glucagon). The predictors, HbA1c and FPI, were both positively correlated with glucagon concentrations as expected, and furthermore of particular interest was WHR. One likely explanation to our relatively low r 2 value could be that we lack important measurements, that is, further influential predictor variables, to improve our model. Such data could include more detailed information concerning the hepatic status of our study subjects, for example, magnetic resonance imaging, liver biopsies, and/or biochemical markers, such as the liver enzymes alanine aminotransferase, aspartate amino transferase, and gamma-glutamyltransferase, in addition to measures of urea and amino acid concentrations. 71 Another limitation of this study is the missing WHR data in some of the included studies. However, we do not suspect that this occurred in a systematic way and therefore influences our results.
Unfortunately, we did not have access to data from a relevant group of subjects with impaired glucose tolerance (IGT). It would be interesting to see if fasting hyperglucagonemia in this group also correlate with WHR and future studies addressing this are warranted.
In conclusion, we confirm that fasting plasma glucagon concentrations are abnormally high in patients with T2D, demonstrate that WHR represents an important determinant of fasting hyperglucagonemia in both patients with T2D and nondiabetic subjects, and suggest that WHR may influence glucagon concentrations, which seem to fit with recent hypotheses linking steatosis-induced altered glucagon sensitivity in the liver to alpha cell secretion in a liver-alpha cell feedback loop. 8
Footnotes
Acknowledgments
The authors thank Lisbeth Bonde, MD, Kasper Aaboe, MD, PhD, and Nicolai A. Rhee, MD, PhD, for providing data from their respective studies.
Author Disclosure Statement
All authors declare that none has received support from any organization for the present work, no relationship with any organization that may have an interest in the present work, and any other relationships or activities that could appear to have influenced the present work.
References
Supplementary Material
Please find the following supplemental material available below.
For Open Access articles published under a Creative Commons License, all supplemental material carries the same license as the article it is associated with.
For non-Open Access articles published, all supplemental material carries a non-exclusive license, and permission requests for re-use of supplemental material or any part of supplemental material shall be sent directly to the copyright owner as specified in the copyright notice associated with the article.
