




Abstract
Background:
Nonalcoholic fatty pancreas and liver disease (NAFPD and NAFLD) and pericardial adipose tissue (PAT) are often associated with type 2 diabetes mellitus (T2DM). Our aim was to evaluate the incidence rate of NAFLD and NAFPD, PAT size, and the effect of metformin treatment on NAFLD, NAFPD, and PAT in new-onset T2DM (NODM).
Methods:
Seventeen patients with NODM and 10 subjects used as a control group were involved in the study. Computed tomography (CT) and laboratory tests were performed before the beginning of metformin therapy and 4 months afterward. PAT and the amount of fat in the pancreas and liver were determined by X-ray attenuation during unenhanced CT examination and compared with the values for the control subjects.
Results:
Metabolic parameters improved significantly after metformin therapy. NAFLD was diagnosed in 64.7% of the patients with NODM and in 10% of the control subjects. The radiation absorption of the liver was significantly lower in the patients with NODM compared with the control group and significantly higher after metformin therapy compared with the baseline values. Only six patients (35.3%) had NAFLD after metformin therapy. NAFPD was diagnosed in 82.3% of the patients with NODM and in 20% of the control subjects. The radiation absorption of the pancreas was significantly lower in the patients with NODM compared with the control group but did not change significantly after treatment. PAT size was significantly larger in the patients with NODM and did not change significantly after metformin treatment.
Conclusions:
NAFLD, NAFPD, and increased PAT were detected in the majority of patients with NODM. Metformin therapy decreased the amount of fat in the liver in parallel with an improvement in the metabolic parameters and may, thus, be beneficial for preventing the late consequences of NAFLD.
Introduction
It is a well-known fact that insulin resistance, diabetes, and obesity cause fat accumulation in many organs, including the liver (nonalcoholic fatty liver disease [NAFLD]), pancreas (nonalcoholic fatty pancreas disease [NAFPD]), and pericardium (pericardial adipose tissue [PAT]). 1 The worldwide prevalence of NAFLD ranges widely from 6.3% to 33% with a median of 20%, depending on the kind of assessment methods used. 2 –6 There is a high prevalence of NAFLD in patients with type 2 diabetes mellitus (T2DM) (64%–69%) 2,7 –10 and dyslipidemia (20%–81%). 11,12
Obesity, T2DM, and dyslipidemia are risk factors for the development of NAFLD. 8,9,13,14 The incidence rate of prediabetes mellitus (DM) is as high as 93.3% in NAFLD, so pre-DM is a more important predictor of NAFLD than metabolic syndrome. 15 Moreover, it seems that the male gender is presumably a further risk factor for NAFLD. 2 If left untreated, NAFLD may progress through steatohepatitis to cirrhosis and hepatocellular carcinoma. 16,17
NAFPD is a less well-studied phenomenon. Fatty pancreas is a common ultrasound finding with increased echogenicity of the parenchyma due to fat accumulation. 18 Previous studies have suggested a 16%–35% prevalence of fatty pancreas in the general population. 19,20 It seems that age, 21 obesity, hyperglycemia, and dyslipidemia are risk factors for NAFPD. 20,22 –24 Also, NAFPD may increase the risk for the development of metabolic syndrome by causing inflammation, 25 impaired pancreatic beta cell function, and finally hyperglycemia. 26 This relationship may explain the presence of T2DM 27 in 6.9%–12.6% of patients with pancreatic steatosis. 19,20 Several studies have suggested that insulin resistance is associated with pancreatic fat accumulation, 22 –24,28,29 nonalcoholic steatohepatitis (NASH), 22,30 and pre-DM. 23
Higher pancreatic triglyceride content in obesity can be detected by proton magnetic resonance spectroscopy, 31 computed tomography (CT), 32,33 or magnetic resonance imaging (MRI) 34 even before the development of T2DM. 31 It has been demonstrated that obesity may lead to pancreatic ductal adenocarcinoma through pancreatic steatosis. 25,35,36 Evidence suggests that pancreatic steatosis plays a role in T2DM, pancreatic exocrine dysfunction, acute pancreatitis, 37,38 pancreatic cancer, and the formation of pancreatic fistulas after pancreatic surgery. 39
NAFLD and NAFPD are associated with each other because pancreatic fat formation is related to NASH and is a significant predictor of the presence of NAFLD. 40 The elevation of liver transaminases may suggest the presence of NAFLD or NASH. Ultrasonography and transient elastography are currently the most appropriate imaging modality for NAFLD screening, and liver biopsy is the “gold standard” for characterizing liver histology in patients with NAFLD. 41 In contrast to the liver, no biochemical marker is available for diagnosing NAFPD. Further, as the pancreas is a retroperitoneal organ, a pancreatic biopsy is more cumbersome and may be accompanied by more sampling errors and complications compared with a liver biopsy. Visualizing the pancreas by ultrasonography is more difficult, and the sensitivity and specificity of ultrasonography in detecting NAFPD are hampered by obesity and bloating.
Further, in prediabetic and T2DM patients, the amount of PAT is significantly higher compared with that in normoglycemic patients. 42,43 Previous reviews have demonstrated that, besides epicardial adipose tissue, PAT is another risk factor for the development of cardiovascular disease in T2DM patients. 44
The aim of this study was to evaluate the incidence rate of NAFLD and NAFPD, PAT size, and the effect of metformin treatment on NAFLD, NAFPD, and PAT in new-onset T2DM (NODM) by measuring tissue attenuation during unenhanced CT examination.
Subjects and Methods
Seventeen patients with NODM (male: 8; female: 9; mean age: 55.3 ± 10.8 years; body mass index [BMI]: 31.8 ± 5.1 kg/m2) were involved in this prospective study. The control group comprised 10 healthy subjects (male: 6; female: 4; mean age: 53.9 ± 13.8 years; BMI: 30.0 ± 4.7 kg/m2) without DM, without the presence of any pancreatic, liver, or cardiovascular disease, or history of alcohol consumption and matched for age, sex, BMI, and serum lipids (Table 1).
Age, Body Mass Index, Cholesterol, and Triglyceride Levels in Patients with New-Onset Type 2 Diabetes Mellitus and Healthy Control Subjects at Baseline
Data expressed as mean values ± SD.
BMI, body mass index; NODM, new-onset type 2 diabetes mellitus; SD, standard deviation.
The diagnosis of T2DM was made in accordance with the American Diabetes Association criteria. 45 NODM is defined as DM diagnosed within the past 1 month before the date of enrollment. Patients were only on a low-carbohydrate diet and received no hypoglycemic agents before inclusion. Exclusion criteria consisted of any pancreatic, liver, or cardiovascular disease, inherited disorders of fat metabolism, pregnancy, malignant disease, antidiabetic medication, or alcohol consumption in patients' medical records. NODM patients received no other new drugs beyond 1000 mg metformin twice daily after inclusion. However, a hypolipidic diet was recommended to patients with elevated lipid levels. The follow-up period was 4 months. CT and laboratory tests (serum triglyceride, cholesterol, insulin level, fasting blood glucose, and glycosylated hemoglobin [HbA1c]) were performed before the beginning of metformin therapy and 4 months afterward. Homeostatic model assessment-estimated insulin resistance (HOMA-IR) was also calculated. PAT size and the amount of fat in the pancreas and liver were determined by X-ray attenuation rate during unenhanced CT examination (Hounsfield unit [HU]) (Fig. 1). Each region of interest (ROI) in the liver, pancreas, and spleen was a round area of ∼1.0 cm2 as a marker of the degree of attenuation. 46 In the case of PAT, measurements were performed in one dedicated slice at the junction of the inferior vena cava and right atrium. ROIs were identified in Segment VII of the liver, along the diaphragmatic surface of the spleen and in the body of the pancreas. Mean density was calculated, and General Electric Centricity PACS software was used to determine the values. NAFLD and NAFPD were defined when the liver-to-spleen or pancreas-to-spleen attenuation ratio was <1. 47,48

Typical plain CT images in new-onset type 2 diabetic patients before and 4 months after the start of metformin therapy and in control subjects. The density of the liver was diffusely decreased in new-onset type 2 diabetic patients
All the participants provided written informed consent. The study protocol was in full accordance with the most recent revisions of the Helsinki Declaration and was approved by the ethics committee at the University of Szeged.
Statistical analysis
Continuous measures are summarized and presented as means and standard deviations. Categorical data are presented as percentages. The two-sample t-test and paired-samples t-test were used to determine differences between continuous parameters. Non-normally distributed data were log transformed. Data were processed with SPSS 22.0 (Armonk, NY), and a level of P < 0.05 was considered statistically significant.
Results
Fasting blood glucose, HbA1c, serum insulin and cholesterol, and HOMA-IR decreased significantly after metformin therapy compared with the baseline values (Table 2). However, serum triglyceride and BMI did not change.
Changes of Laboratory Test Results and Body Mass Index from Baseline Values to 4 Months Afterward During Metformin Therapy in Patients with New-Onset Type 2 Diabetes Mellitus
Data expressed as mean values ± SD.
HbA1c, glycosylated hemoglobin; HOMA-IR, homeostatic model assessment-estimated insulin resistance. Significance level p < 0.05 for figures that are bold italic.
NAFLD was diagnosed in 64.7% (11 out of 17) of the patients with NODM and in 10% of the control subjects based on the diagnostic criteria. NODM patients with and without NAFLD were compared (Table 3). The amount of fat in the liver was significantly higher in NODM patients with NAFLD than in those without it (25.2 ± 12.7 vs. 55.6 ± 9.3 HU). The serum cholesterol level was significantly higher in patients without NAFLD as compared with patients with the disease in the NODM group (P = 0.002). BMI, serum triglyceride, fasting blood glucose level, HbA1c, and liver enzymes were not significantly different between patients with and without NAFLD (Table 3).
Amount of Fat in the Liver, Cholesterol, Triglyceride, Body Mass Index, Fasting Blood Glucose, HbA1c, and Liver Enzyme Values in New-Onset Type 2 Diabetes Mellitus Patients With and Without Nonalcoholic Fatty Liver Disease at Baseline
Data expressed as mean value ± SD.
HU, Hounsfield unit; NAFLD, nonalcoholic fatty liver disease. Significance level p < 0.05 for figures that are bold italic.
The radiation absorption of the liver was significantly lower in patients with NODM compared with the control group (32.3 ± 17.7 vs. 53.1 ± 8.3 HU [P = 0.001]) and significantly increased after metformin therapy compared with the baseline values (32.3 ± 17.7 vs. 47.3 ± 12.1 HU [P = 0.026]) (Fig. 2). Only six patients (35.3%) had NAFLD after the 4-month metformin therapy according to the diagnostic criteria.
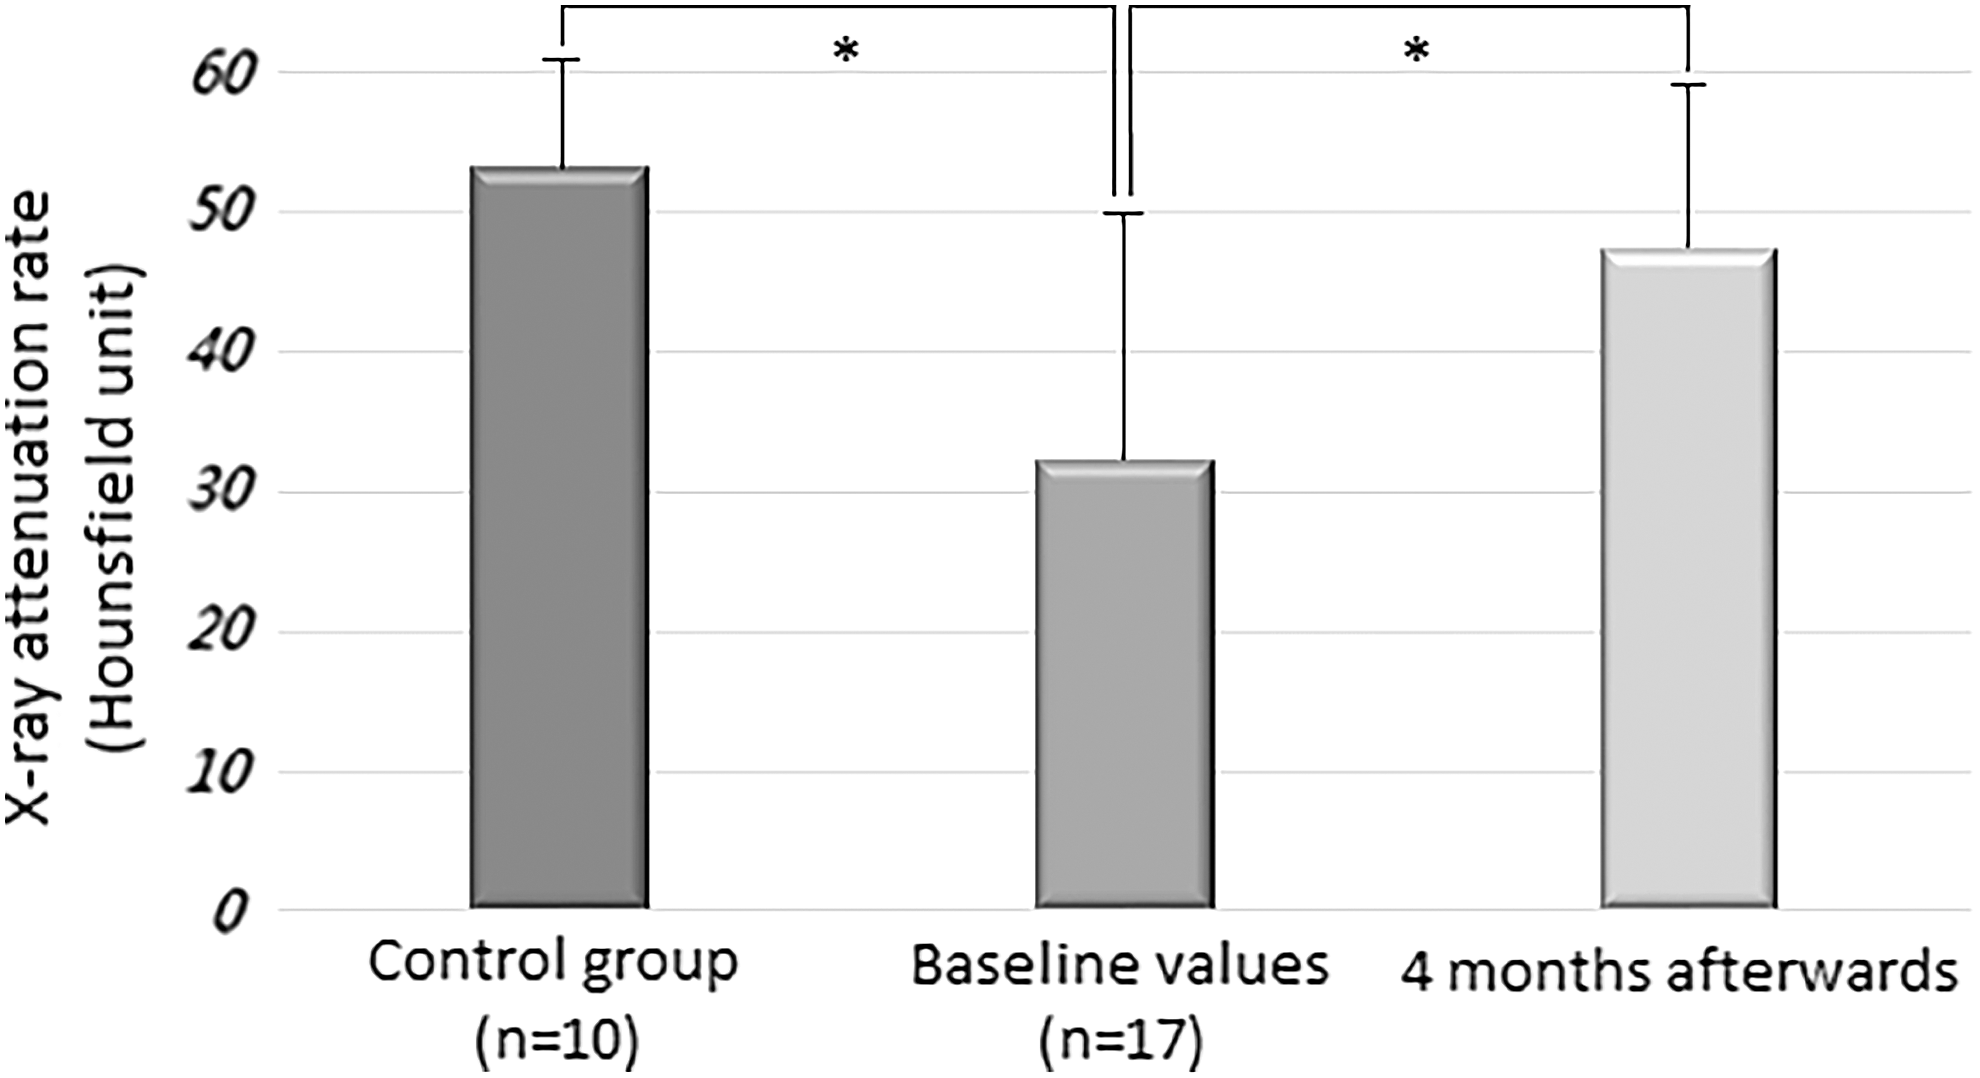
The radiation absorption of the liver in new-onset type 2 diabetic patients before and 4 months after the start of metformin therapy and in control subjects. The X-ray attenuation rate during a native CT examination was measured in new-onset type 2 diabetic patients before and 4 months after the start of metformin therapy and in control subjects. Data expressed as mean values ± SD. *P < 0.05. SD, standard deviation.
NAFPD was diagnosed in 82.3% (14 out of 17) of the patients with NODM and in 20% of the control subjects based on the diagnostic criteria. The amount of fat in the pancreas was significantly higher in the NODM patients with NAFPD than in those without it (30.2 ± 6.9 vs. 45.4 ± 3.9 HU [P < 0.001]). The radiation absorption of the pancreas was significantly lower in the patients with NODM compared with the control group (34.0 ± 7.9 vs. 39.4 ± 7.8 HU [P = 0.04]) but did not change significantly after the 4-month metformin treatment (34.0 ± 7.9 vs. 37.7 ± 10.2 HU [P = 0.178]) (Fig. 3).
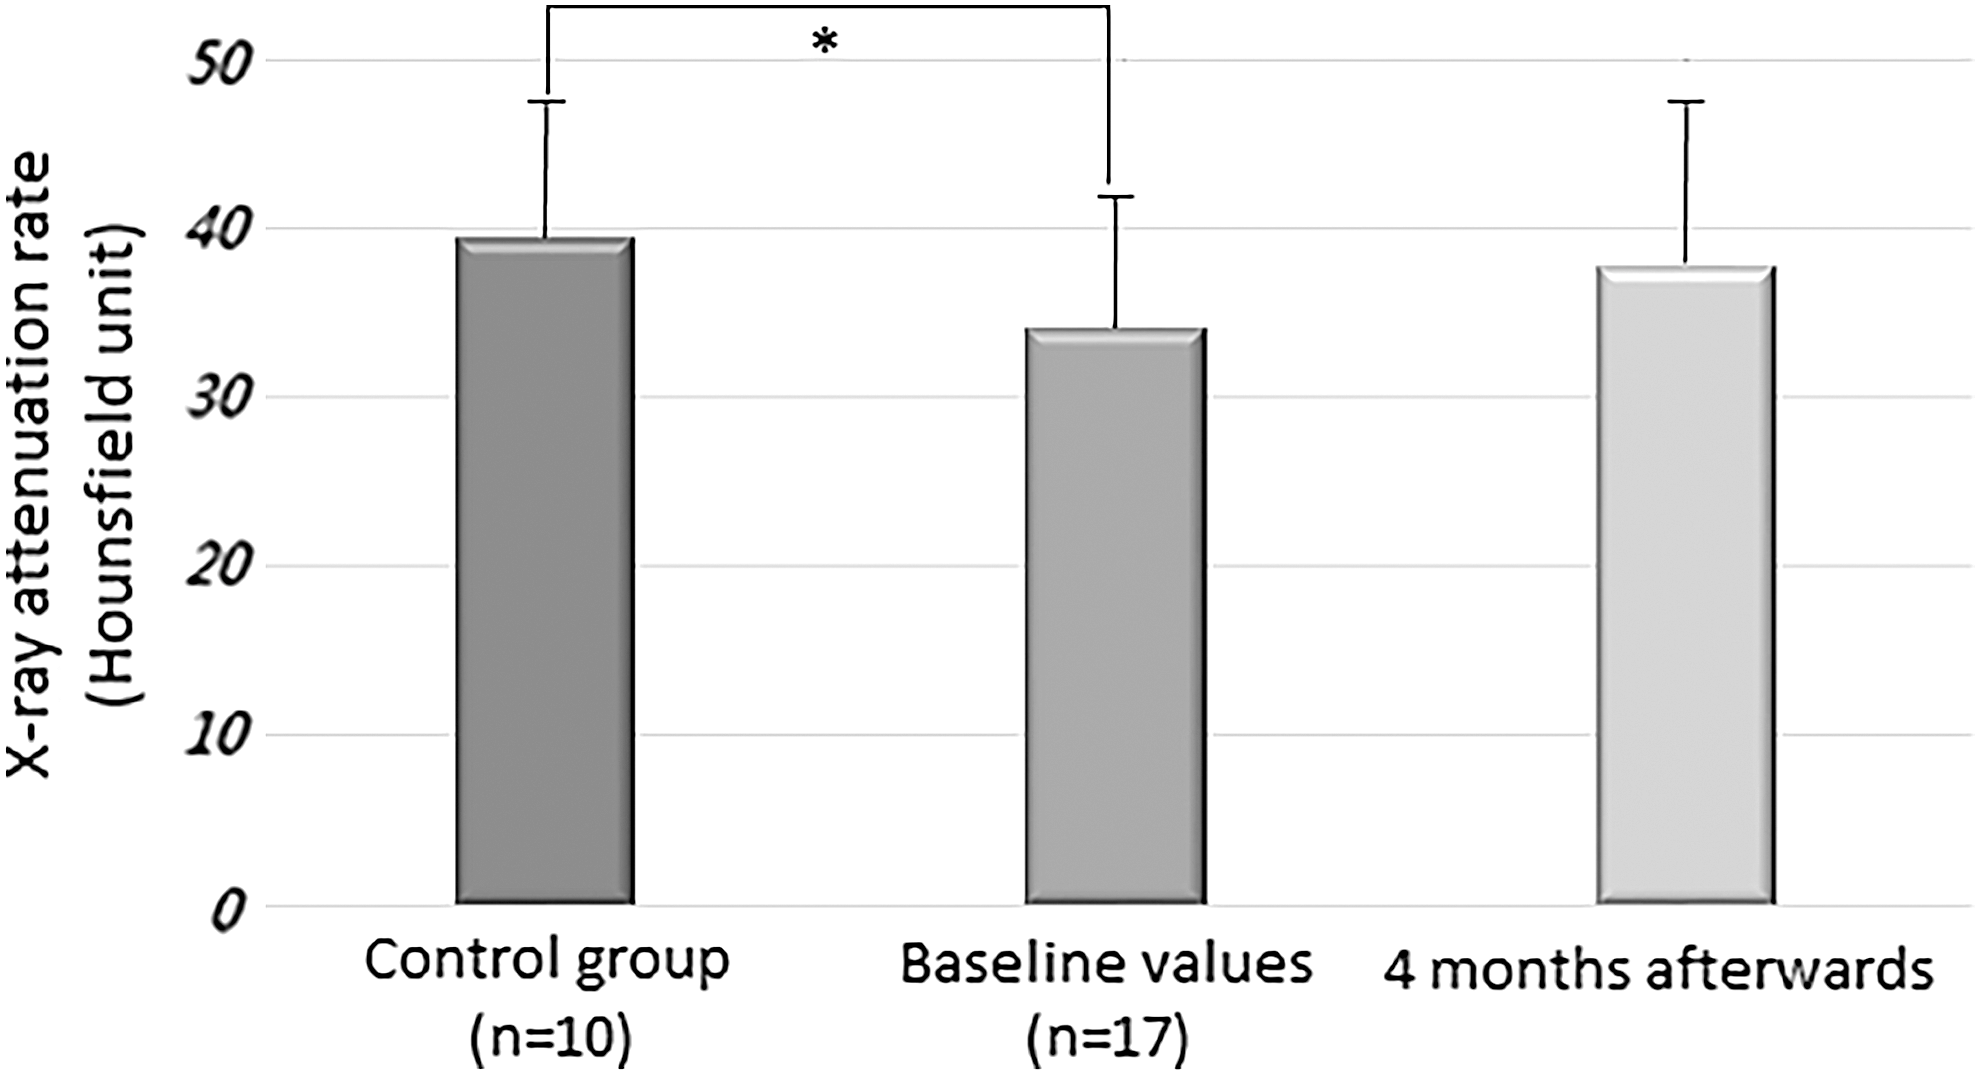
The radiation absorption of the pancreas in new-onset type 2 diabetic patients before and 4 months after the start of metformin therapy and in control subjects. The X-ray attenuation rate during a native CT examination was measured in new-onset type 2 diabetic patients before and 4 months after the start of metformin therapy and in control subjects. Data expressed as mean values ± SD. *P < 0.05.
PAT size was significantly larger in the patients with NODM compared with the control group (2143.1 ± 1036 vs. 1223.9 ± 312.9 mm2 [P = 0.008]) and did not change significantly after the metformin treatment (2143.1 ± 1036 vs. 2048.2 ± 997 mm2 [P = 0.798]) (Fig. 4).
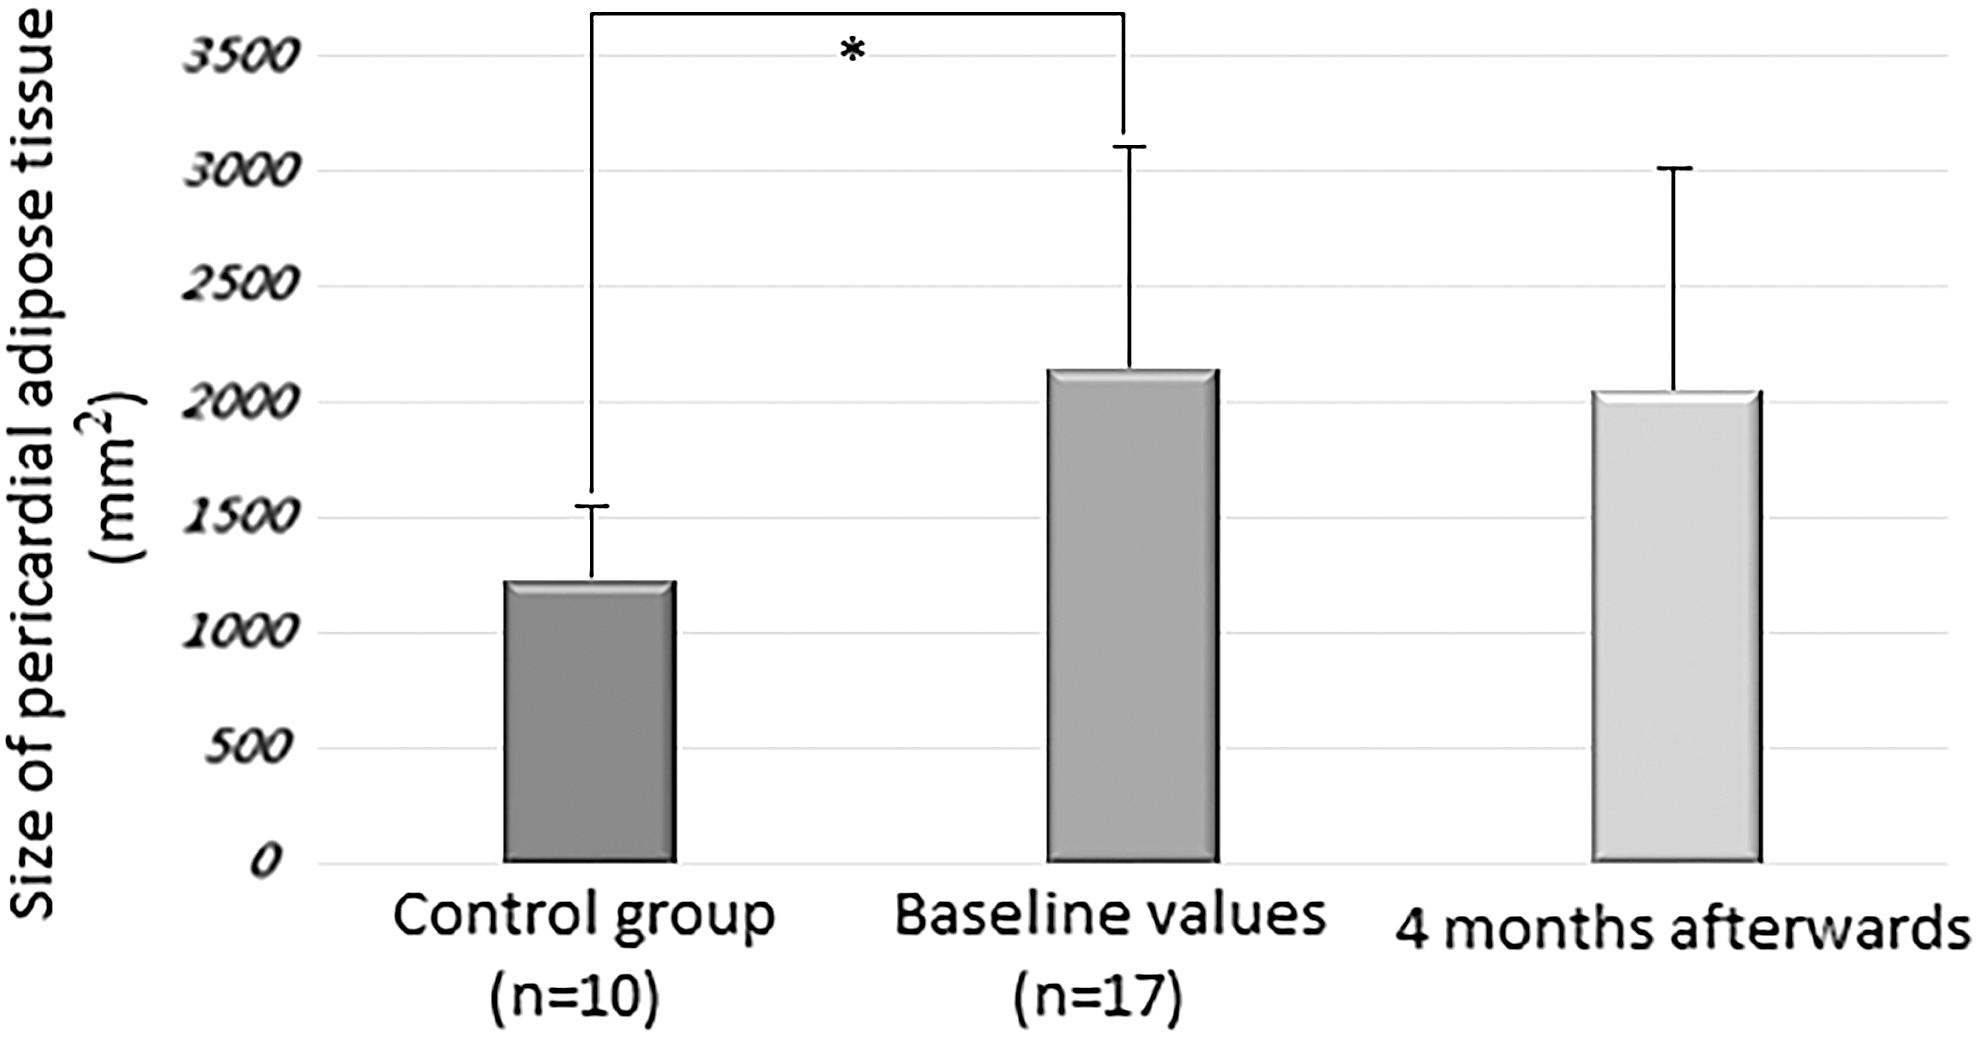
The size of pericardial adipose tissue in new-onset type 2 diabetic patients before and 4 months after the start of metformin therapy and in control subjects. A native CT examination was measured in new-onset type 2 diabetic patients before and 4 months after the start of metformin therapy and in control subjects. Data expressed as mean values ± SD. *P < 0.05.
Discussion and Conclusions
This study demonstrates that NAFLD and NAFPD are already present and PAT volume is increased in patients with NODM. Metformin therapy effectively decreased the amount of fat in the liver but did not affect the amount of fat in the pancreas or PAT volume.
NAFLD is the most common liver disorder worldwide and contributes significantly to overall mortality and to cardiovascular and liver-related mortality in particular. The main risk factor is T2DM; NAFLD can be demonstrated in 64%–69% of T2DM patients. 2,7 –9 It is likely that NAFLD is the hepatic manifestation of metabolic syndrome, where insulin resistance is the main risk factor. 49 On the other hand, NAFLD may progress to an inflammatory complication, NASH. The high incidence of NASH in patients with T2DM may lead to further complications, such as liver cirrhosis and hepatocellular carcinoma. 16,17 Given the expected rise in the prevalence of T2DM, NAFLD is projected to be the principal etiology for liver transplantation within the next decade. 7 Further, NAFLD is believed to be an independent determinant of cardiovascular disease. 50
Metabolic syndrome and obesity are commonly associated with NAFLD. However, the links between NAFLD, insulin resistance, and T2DM are not fully understood. 7 NAFLD can predict the incidence of diabetes independently of traditional risk factors, including obesity, peripheral insulin resistance, and metabolic syndrome. 51 Moreover, diabetes promotes or worsens hepatic steatosis, thus fueling a vicious cycle.
PAT plays a role in myocardial energy metabolism through the connection with the coronary arteries and the myocardium. 52,53 Increased pericardial fat volume was demonstrated as a risk factor for coronary artery disease 54 and the development of cardiovascular disease in T2DM patients. 44 In the Jackson heart study, PAT was associated with elevated levels of fasting glucose, triglycerides, C-reactive protein, systolic blood pressure, and lower levels of high-density lipoprotein. 53 Moreover, PAT was also linked to metabolic syndrome, hypertension, T2DM, and metabolic syndrome. 53 Further, Lozzo found increased PAT volume in T2DM patients. 43 We demonstrated that PAT volume is already higher in NODM; however, metformin therapy did not affect PAT volume. The latter finding is in line with a previous study, where 24-week-long metformin treatment did not change PAT size. 55 The mechanisms of metformin are complex and are still not fully understood. Metformin works directly or indirectly on the liver to reduce hepatic glucose production, affects the gut to increase glucose utilization and the level of glucagon-like peptide-1 (GLP-1), and alters the microbiome. 56 The GLP-1 receptor is also expressed in the adipose tissue, and GLP-1 promotes adipogenesis by upregulation of adipocyte-specific markers and transcription factors. 57 This may explain why metformin did not decrease PAT volume, although it had a beneficial effect on metabolic parameters.
In our study, a T2DM patient cohort was selected to analyze the effect of insulin resistance on the prevalence of NAFLD. The control subjects did not have DM or any pancreatic, liver, or cardiovascular disease, or history of alcohol consumption, but they were matched for age, sex, BMI, and serum lipids. Therefore, NODM was the only variable in our study that could influence the prevalence of NAFLD. Patients with NODM were enrolled in this prospective study if they had been diagnosed within 1 month, they consumed no alcohol, and their medical records showed no pancreatic, liver, or cardiovascular disease, inherited disorders of fat metabolism, antidiabetic medication or pregnancy, or malignant disease. The aims of the study were (1) to analyze the effect of early phase insulin resistance on the development of NAFLD and NAFPD and (2) to investigate the effect of newly introduced metformin therapy on the degree of fat content in the liver and pancreas and on PAT size.
Sixty-nine percent and 62% of T2DM patients had NAFLD as defined by ultrasound in two previous studies, 8,9 and 87% of the NAFLD cases were confirmed histologically in the latter study. However, these studies featured a cross-sectional design that included diabetic patients with variable disease lengths. We involved NODM patients diagnosed within 1 month before enrollment in our study. Overall, 64.7% of newly diagnosed diabetic patients in our investigation had NAFLD. This means that NAFLD is already present in the early phase of DM. The high prevalence of NAFLD in our study can be explained by the fact that our patients had several risk factors. They were generally overweight and had elevated cholesterol and triglyceride levels. However, BMI, serum cholesterol, and triglyceride levels were also above normal in the control group, and there were no significant differences between the control group and the DM group. In contrast, only 10% of the control subjects had NAFLD. Further, the radiation absorption of the liver was significantly lower, indicating a higher amount of fat in the liver in patients with T2DM compared with the control group. This increased amount of fat, therefore, can be attributed to insulin resistance after excluding other risk factors. It was demonstrated that insulin resistance is already present at least 5 years before overt diabetes in populations with a high prevalence of T2DM. 58 The high prevalence of NAFLD can also be explained by the fact that we defined fatty liver by measuring radiation absorption on CT, which is more sensitive, specific, and operator-independent compared with ultrasound.
NAFPD has been poorly investigated compared with NAFLD, although interest is increasing among researchers. Reports on the relationship between NAFPD and β-cell function are inconsistent. Some studies indicate that pancreatic lipid content is negatively associated with insulin secretion in nondiabetic subjects 27 or individuals with prediabetes, 26 whereas others suggest that there is no relationship between β cell function and pancreatic fat in prediabetic 59 or diabetic subjects. 27
Pancreatic fat content can be studied with multiple diagnostic modalities. A histological examination requires a pancreatic biopsy. However, this is invasive, and there are complications associated with it. Ultrasonography is cheap and easily available, but a relatively insensitive measure of pancreatic fat content. More recently, expensive MRI techniques have been used to assess pancreatic fat deposition. A native CT scan was employed in our study to measure the amount of pancreatic steatosis using radiation absorption correlated to the spleen.
Diabetic patients have been demonstrated to have higher pancreatic fat content as measured by magnetic resonance spectroscopy 27,31 and dual-echo magnetic resonance chemical shift imaging. 60 In contrast, Saisho et al. found that pancreatic fat content was not significantly increased in T2DM. 61 Overall, 82.3% of NODM patients were diagnosed as having NAFPD based on the diagnostic criteria, whereas NAFPD was only detected in 20% of the control population in our study. Since the control group was matched for age, sex, BMI, and serum lipids with the T2DM group, NAFPD may be a consequence of insulin resistance.
Newly (<1 month) diagnosed T2DM patients were enrolled in the study to assess the effect of metformin on NAFLD and NAFPD. Metformin is the first-line agent for the treatment of diabetes and the most popular antidiabetic agent worldwide. The effects of metformin on NAFLD have been evaluated in several studies, with some of them showing a beneficial effect on aminotransferase levels or liver histological alterations. 2,62 –64 To our knowledge, no study has ever evaluated the effect of metformin on hepatic fat content measured by tissue attenuation during unenhanced CT examination. Four-month-long metformin treatment significantly reduced fat content in the liver in our study. Metformin also improved glycemic control and insulin resistance, as measured by HOMA-IR, and lowered serum cholesterol level, the results of which can partly be attributed to its beneficial effects. However, metformin therapy did not reduce pancreatic fat content and PAT size.
In conclusion, NAFLD, NAFPD, and increased PAT were detected in the majority of the NODM patients. Metformin therapy lowered the amount of fat in the liver in parallel with the improvement in metabolic parameters but did not decrease the level of adipose tissue in the pancreas nor reduce PAT size. Metformin therapy started early in the course of diabetes may be beneficial for the prevention of the late consequences of NAFLD.
Footnotes
Acknowledgment
The study was partly funded by a grant (K 128222 to L.C.) from the Hungarian National Research, Development and Innovation Office.
Author Disclosure Statement
The article has been read, understood, and approved by all the authors. The authors declare that this article is not under review elsewhere and that it has not been published earlier. They have no commercial associations that might represent a conflict of interest in relation to the submitted article.